Precise Measurement of the Reionization Optical Depth from The Global 21-cm Signal Accounting for Cosmic Heating
Abstract
As a result of our limited data on reionization, the total optical depth for electron scattering, , limits precision measurements of cosmological parameters from the Cosmic Microwave Background (CMB). It was recently shown that the predicted 21-cm signal of neutral hydrogen contains enough information to reconstruct with sub-percent accuracy, assuming that the neutral gas was much hotter than the CMB throughout the entire epoch of reionization. Here we relax this assumption and use the global 21-cm signal alone to extract for realistic X-ray heating scenarios. We test our model-independent approach using mock data for a wide range of ionization and heating histories and show that an accurate measurement of the reionization optical depth at a sub-percent level is possible in most of the considered scenarios even when heating is not saturated during the epoch of reionization, assuming that the foregrounds are mitigated. However, we find that in cases where heating sources had hard X-ray spectra and their luminosity was close to or lower than what is predicted based on low-redshift observations, the global 21-cm signal alone is not a good tracer of the reionization history.
Subject headings:
cosmology: cosmological parameters, dark ages, reionization, first stars; X-rays: binaries, galaxies, general1. Introduction
The reionization of the intergalactic medium (IGM), between redshifts and (Zahn et al., 2012; George, 2015; Ade et al., 2015; Becker et al., 2015), is one of the least studied epochs in the history of the Universe and is a research frontier in present-day cosmology (Loeb & Furlanetto, 2013). During this process, the neutral intergalactic gas was likely ionized by ultra-violet (UV) photons emitted by stars. In addition, sources of X-ray photons, such as X-ray binaries, mini-quasars and hot gas in galaxies, also had an effect on the epoch of reionization (EoR) by pre-heating and mildly ionizing the gas far from the sources (Oh, 2001; Mesinger et al., 2013; Fialkov et al., 2015).
The EoR also affects the Cosmic Microwave Background (CMB) through its scattering off free electrons. This scattering degrades the accuracy with which cosmological parameters can be extracted from the CMB data. In particular, measurements of the amplitude of primordial fluctuations, , is degenerate with the total optical depth, , since the total amplitude is estimated from the temperature power spectrum of the CMB as . Because the precision with which can be measured using the CMB is very poor (e.g., the 68% confidence level in corresponds to a relative error of when measured from the temperature power spectrum), the errors in are high. As a result, is sometimes referred to as a nuisance parameter for CMB cosmology. Luckily, alternative probes of reionization can provide independent constraints on and remove the related uncertainty.
One of the most promising tools to constrain reionization is the predicted 21-cm signal of neutral hydrogen, HI, e.g., see Furlanetto et al. (2006) and Pritchard & Loeb (2012). The brightness temperature of this signal, , depends on the fractional amount of hydrogen atoms in the IGM which are neutral, , and, thus, is expected to provide exclusive information on the reionization history of the Universe. Recently, Liu et al. (2015) advocated that the sky-averaged (global) 21-cm signal, , alone has enough information to fully reconstruct the reionization history and measure the optical depth to reionization with great precision. To alleviate the computational costs, the authors assumed that the 21-cm signal tracks the ionization history, which is true only when X-ray sources heat up the cosmic gas to a temperature above the CMB well before the beginning of reionization. In this case, the dependence of on the gas temperature is saturated (the so-called saturated heating regime), is proportional to , and the reionization history can be fully extracted from the global 21-cm signal measurements despite the presence of strong foregrounds. In particular, Liu et al. (2015) showed that assuming saturated heating, the 21-cm signal allows to determine with much higher accuracy than it is possible from the CMB measurements.
However, the assumption that heating is saturated all the way through reionization is debated (Fialkov et al., 2014), and the nature and efficiency of early X-ray sources could have a significant impact on the intensity of the redshifted 21-cm signal even at the end of the EoR (Pritchard & Loeb, 2012; Mesinger et al., 2013; Fialkov et al., 2014; Pacucci et al., 2014). The nature of the first X-ray sources is still unknown and possible candidates include X-ray binaries (Mirabel et al., 2011; Fragos et al., 2013; Fialkov et al., 2014) and mini-quasars (Madau et al., 2004; Fialkov et al., 2015) which emit hard X-rays with spectral energy distribution (SED) peaking at few keV, soft X-ray sources such as hot gas in galaxies which can be well described by a power-law spectral shape (Furlanetto, 2006), as well as more exotic candidates such as annihilating dark matter (Cirelli et al., 2009). The efficiency of high-redshift sources, , defined through the relation between their luminosity and the star formation rate is another unknown (Fialkov et al. (2015) and references therein), calibrated so that the value of corresponds to the luminosity of observed low-redshift sources boosted by a metallicity-dependent factor (Fragos et al., 2013).
Here we consider a completely model-independent method to reconstruct from the global 21-cm signal measurements after relaxing the saturated heating assumption and examining realistic X-ray sources with hard and soft spectra varying their efficiency. Our results are timely since many of the experiments such as the Experiment to Detect the Global Epoch of Reionization Signature (EDGES, Bowman & Rogers (2010)), Large-Aperture Experiment to Detect the Dark Ages (LEDA, Greenhill & Bernardi (2012), Bernardi et al. (2015)), Dark Ages Radio Explorer (DARE, Burns et al. (2012)), and New extension in Nancay upgrading LOFAR (NenuFAR, Zarka et al. (2012)) are on their way to detect this signal for the first time while next generation telescopes, such as the Hydrogen Epoch of Reionization Array (HERA111http://reionization.org/) and the Square Kilometer Array (SKA, Koopmans et al. (2015)), are expected to extensively explore the EoR.
In Section 2 we set up the stage describing simulation methods and model parameters. In Section 3 we explore to which extent the global 21-cm signal tracks the neutral fraction in each case and propose a model-independent way to reconstruct the heating and ionization history from the global 21-cm signal. In Section 4 we calculate the optical depth from the reconstructed reionization history and discuss the accuracy with which it can be detected by global 21-cm experiments. Finally, we conclude in Section 5. Throughout this paper we assume the standard Planck satellite cosmology (Ade et al., 2015).
2. The Mock Universe
We simulate the mock global 21-cm signal from the redshift range using a hybrid simulation, first introduced by Visbal et al. (2012) and described in more detail by Fialkov et al. (2014). This simulation allows to estimate the non-local impact of X-ray, Ly- and UV sources on the redshifted 21-cm signal of neutral hydrogen as well as on the ionization history of the IGM, and includes the effect of supersonic flows between dark matter and gas, (Tseliakhovich & Hirata, 2010), which has an impact on high-redshift star formation in M⊙ halos (Stacy et al., 2011; Maio et al., 2011) and, consequently, on the 21-cm signal (Dalal et al., 2010; Tseliakhovich et al., 2011; Fialkov et al., 2012; McQuinn & O’Leary, 2012; Fialkov, 2014). In addition, we account for the photoheating feedback (Cohen et al., 2015) which happens when the intergalactic gas heats up and stops accreting into halos below M⊙, thus suppressing star formation in low-mass halos.
In our simulation, ionization by UV photons is computed following the excursion-set formalism, by comparing the time-integrated number of ionizing photons to the number of neutral atoms in each region (Furlanetto et al., 2004). Specifically, a simulation cell is ionized if , where is the ionization efficiency normalized to yield , is the collapsed fraction, and is the fraction of free electrons. In addition, we account for partial ionization of the neutral IGM by X-rays, which boost the free electron fraction far from the sources and have a non-negligible effect on the topology of reionization.
The reionization history is strongly linked to the mechanism of star formation and its timing depends on the minimal mass of halos that can form stars, M. The smaller is M, the earlier reionization starts and the more gradual is the grows of the ionized fraction. Because star formation at high redshifts is very unconstrained and is biased by multiple feedback mechanisms (Greif, 2015; Bromm, 2013), we consider three different scenarios varying the low-mass cutoff of star forming halos:
-
•
“Massive halos”: Stars form in halos of M M⊙ (circular velocity km/s).
-
•
“Atomic cooling”: Stars form through the atomic cooling channel in halos of M M⊙ (circular velocity km/s) with active photoheating feedback.
-
•
“Molecular cooling”: star formation happens in all halos with circular velocity km/s (M M⊙). In this case we include the photoheating feedback, account for the effect of , but exclude the effect of Lyman-Werner (LW) photons which are expected to destroy molecular hydrogen acting as negative feedback to star formation. The degree to which the LW feedback is efficient is a topic of active research (Schauer et al., 2015; Visbal et al., 2014); therefore, we ignore the effect of this feedback here to optimize the contribution of the molecular cooling halos and increase the diversity of ionization histories. The case of molecular cooling with LW and included is close to the atomic cooling scenario (Fialkov et al., 2013) which we consider separately. Although the role of molecular cooling halos in reionization is expected to be small based on the low optical depth found by Planck satellite, their contribution is not ruled out considering large uncertainty in measurements.
In all the above cases we assume a star formation efficiency of . We consider the contribution of hydrogen and first helium reionizatio to , assuming that singly ionized helium and hydrogen are ionized to the same fraction, (Wyithe et al., 2003), and normalize our models to yield consistent with Planck (Ade et al., 2015) while also requiring reionization to end by or earlier. For atomic and massive halos we choose which gives the redshift of full reionization, , being and respectively. This value of is between the Planck and WMAP measurements of the optical depth and is away from the Planck’s best fit value of 0.066. In the case of molecular cooling the process of reionization is very gradual, and we need to take ( away from the Planck’s best fit value) to have reionization end by .
Finally, we consider two types of heating sources: (i) X-ray binaries with hard SED, and (ii) soft sources with power-law SED (as described by Fialkov et al. (2014)). In addition, we consider three different values of heating efficiency for each type of sources: (low), (standard) and (high). The choice of low and high heating efficiencies is motivated by rather poor observational constrains on the temperature of the IGM before the end of reionization. The unresolved soft cosmic X-ray background, which amounts to of the flux in the keV Chandra band (Lehmer, 2012), sets an upper limit on when attributed to the high redshift sources (Dijkstra et al., 2012; Mesinger et al., 2013; Fialkov et al., 2015). Depending on the details of star formation and for EoR ending at this measurement yields an upper bound of () in the case of hard (soft) X-rays; while for the efficiencies should be times higher (Fialkov et al., 2015). Here we choose as a representative value of the high heating efficiency for all the considered models. The lower limit on comes from the data collected by the Precision Array for Probing the EoR (PAPER, Pober et al. (2015), Ali et al. (2015)) which rules out 21-cm fluctuations of power greater than mK2 at in the k = 0.15-0.5 h Mpc-1 range, where h is the Hubble constant in units of 100 km s-1 Mpc-1. This constrain translates into (0.001) for hard (soft) X-ray sources in the atomic cooling case. However, for such low efficiency, the gas appears to be colder than the CMB by the end of EoR, and the method which we present in this paper does not apply. Therefore we choose as our low heating efficiency value.
For every model we output global neutral fraction, (which we refer to as the true reionziation history), average kinetic gas temperature and the 21-cm signal which depends on the ionization and thermal history in the following way,
| (1) |
where is a constant that depends on atomic physics and cosmological parameters, is the baryon overdensity which is statistically known from cosmology, and is the CMB temperature. Here we ignore the peculiar velocity term, which adds a small correction to the global 21-cm signal (Bharadwaj & Ali, 2004; Barkana & Loeb, 2005). Finally, is the spin temperature of the 21-cm transition which depends on environment. In particular, when Ly- coupling is saturated, which is usually true for , we can equate the spin temperature to gas kinetic temperature, (Madau et al., 1997); while when the IGM is much hotter than the CMB (the saturated heating case). In the latter case Eq. (1) can be further simplified, , and the 21-cm signal can be used as a tracer of neutral fraction weighted by the density fluctuations.
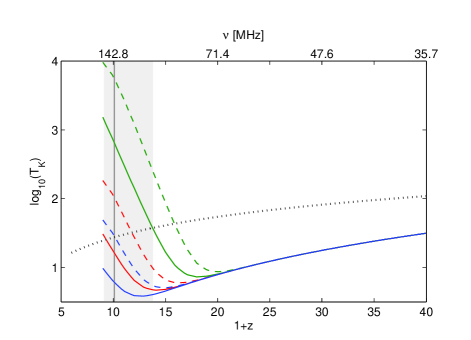
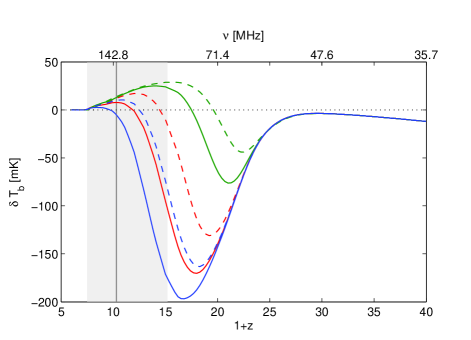
Typical global spectrum of the 21-cm signal (left column of Figure 1) features a prominent trough at frequencies corresponding to redshifts where the IGM was colder than the CMB (the signal is seen in absorption). The minimal value of is reached at the beginning of heating era at redshift when the first population of X-ray sources turned on. At this point also the temperature of the gas, which was adiabatically cooled by cosmic expansion, reaches its minimum (right column of Figure 1). X-ray sources inject energy into the IGM heating it up and above the temperature of the CMB, if heating is sufficiently strong. In this case the 21-cm signal is seen in emission against the CMB at redshifts lower than where . The emission signal peaks at and its amplitude declines at lower redshifts as reionization progresses. If heating is not strong enough, pockets of neutral gas remain colder than the CMB throughout the EoR, marked by a grey band in each panel of Figure 1, and the 21-cm signal is seen in absorption all the way down to . We list , and in Table 1 for every considered model.


| Model | Heating | ||||||||
|---|---|---|---|---|---|---|---|---|---|
| Massive | Hard, | 12.2 | 8.3 | none | 0% | 0% | none | - | 1% |
| Soft, | 13.4 | 9.0 | 8.6 | 0% | 0% | 25% | - | 1% | |
| Hard, | 13.1 | 8.1 | none | 0% | 0% | none | - | 1% | |
| Soft, | 14.2 | 10.5 | 9.2 | 0% | 0% | 31.4% | - | 1% | |
| Hard, | 15.5 | 12.7 | 11.0 | 25.7% | 54.9% | 54.9% | 0.007% | ||
| Soft, | 16.9 | 14.6 | 13.0 | 58.8% | 60.8% | 64.2% | 0.03% | ||
| Atomic | Hard, | 15.8 | 8.7 | 7.4 | 0% | 0% | 16.3% | - | 1% |
| Soft, | 17.3 | 11.5 | 9.8 | 0% | 0% | 30.6% | 16.3 | 0.01% | |
| Hard, | 16.9 | 10.9 | 9.2 | 0% | 22.6% | 24.1% | - | 1% | |
| Soft, | 18.3 | 13.5 | 11.0 | 40.1% | 61.0% | 36.7% | 15.9 | 0.09% | |
| Hard, | 20.1 | 16.5 | 13.2 | 75.9% | 93.5% | 56.6% | 0.04% | ||
| Soft, | 21.4 | 18.6 | 15.0 | 87.4% | 90.0% | 71.1% | 0.01% | ||
| Molecular | Hard, | 21.0 | 11.3 | 9.2 | 1.8% | 2.2% | 14.9% | - | 1% |
| Soft, | 22.4 | 15.0 | 12.2 | 1.7% | 1.7% | 25.6% | - | 1% | |
| Hard, | 22.4 | 14.5 | 12.0 | 1.8% | 26.6% | 25.8% | - | 1% | |
| Soft, | 23.9 | 17.6 | 14.5 | 41.0% | 46.5% | 34.9% | 26.8 | 0.08% | |
| Hard, | 26.6 | 21.9 | 17.5 | 78.8% | 82.9% | 48.8% | 0.1% | ||
| Soft, | 27.8 | 24.0 | 19.2 | 89.0% | 89.0% | 60.0% | 0.03% |
As Figure 1 suggests (and as was recently reported by Fialkov et al. (2014)), the saturated heating assumption may be justified only in the case of high (green lines in the Figure) where the IGM is indeed hotter than the CMB at the beginning of the EoR. In other cases the gas is colder than the CMB at the beginning of reionization and undergoes the heating transition during the EoR. The most interesting case is that of massive halos, which is also well-motivated by the low optical depth measurements. For this star formation scenario heating is slower than reionization and the neutral gas is always colder than the CMB in two out of six cases, namely the case of hard X-ray sources with standard and low heating efficiency.
3. Extracting the Neutral fraction from the global 21-cm signal
We would now like to mimic a global 21-cm experiment, assuming the foregrounds fully under control, where we rely on Liu et al. (2015) who showed that foreground contamination from Galactic synchrotron emission (de Oliveira-Costa et al., 2008), can be mitigated, allowing precise reconstruction of the optical depth from the global 21-cm signal. We first examine to which extent the global 21-cm signal can be used to constrain the ionization history and reconstruct the neutral fraction, and then (in the next Section) use this information to extract the total CMB optical depth.
We start by adopting the saturated heating assumption. Given the data, , we estimate the neutral fraction from Eq. (1) excluding temperature effects
| (2) |
and check up to which values of (listed in Table 1) the true neutral fraction is followed by the estimated one. (Following Liu et al. (2015), we include the factor into the definition of , thus the quantity is, in reality, . However, the effect of density fluctuations on the global signal is not very large and omitting this contribution would not alter our conclusions.)
As can be seen from the Table, the saturated heating assumption is not accurate even in the case of high , and, although the gas is hotter than CMB by the beginning of EoR, thermal effects continue to play a role. In particular, for soft (hard) X-rays succeeds to track the true reionization history from the end of EoR all the way up to () for molecular cooling, () in the case of atomic cooling and () for massive halos. On the other hand, for low and standard heating efficiencies, is a very poor approximation with a fractional error being greater than 5% for all models except for molecular and atomic cooling with soft X-rays and standard heating efficiency in which case follows the true neutral fraction up to . We show an example of the true ionization history and the saturated heating approximation in Figure 2.

The situation can be alleviated with information on the thermal state of the IGM used. Assuming that the gas kinetic temperature, , can be reconstructed from the global 21-cm spectrum, we can estimate the neutral fraction as
| (3) |
where we also adopted saturated Ly- coupling approximation. Eq. (3) improves over the saturated heating assumption and promises to be a better tracer of the true neutral fraction than .
As a proof of concept, we use a very simple method to extract from . Two critical points of the global spectrum can inform us about the heating history: (i) the redshift of the heating transition, , where the gas temperature equates that of the CMB, , and (ii) the trough of the 21-cm signal at which represents the beginning of the heating era. We know that the gas cooled down adiabatically from to , and, given the values of cosmological parameters, we can estimate the gas kinetic temperature at using publicly available codes such as RECFAST (Seager et al., 2000). We interpolate between these two values of redshift and temperature to reconstruct the thermal history at assuming adiabatic cooling at higher redshifts. The true temperature found in our simulation and the reconstructed one are shown in Figure 3 for the case of atomic cooling with and . In the same figure we also show the factor found from our mock data and compare it to the reconstructed value which is always equal to 1 within the saturated heating regime. Despite being a very crude approximation, follows the general trend of , and the reconstructed factor correctly reproduces the features of the true value of . Undoubtedly, this is a much better approximation that the saturated heating assumption; however, a better guess of the thermal history during the EoR would be very beneficial for the extraction.


We use the reconstructed factor to estimate the ionization history according to Eq. (3). An example of is shown in Figure 2, and we list the values of for which the deviation of the estimated neutral fraction from the true one is 5% in Table 1. With the temperature information added, follows the true neutral fraction up to in the case of , hard SED and atomic cooling shown in the Figure (red lines), while this case was completely missed by . Moreover, for the rest of the considered models the redhsift at which the deviation reaches 5% is pushed deeper into the first half of reionization with the exception of all the cases with for which the neutral IGM is barely (or not at all) heated to by the end of reionization as well as the case of massive halos with and hard SED. This inability to track is explained by the fact that our is a too poor approximation and lacks precision to serve in the regime .
3.1. Complete Ionization History
Next, we would like to develop a model-independent method to reconstruct the entire reionization history based on the global 21-cm signal. To this end, we choose to use (and not ) as a tracer of the neutral fraction. From our analysis in the previous Section, we know that this approximation works well during the late stages of the EoR; however, we do not have a good measure for the critical redshift (or the value of the neutral fraction), (), up to which this approximation holds. Here we adopt a rather conservative approach, outlined below, to define this instant and to reconstruct the full ionization history, .
First, we keep all the measured data points for which is guaranteed to follow the true neutral fraction starting from the end of reionizaion at and up to . We adopt the next model-independent criterion to find : if the signal is seen in emission at the advanced stages of the EoR, we search for a redshift () between and the emission peak at which the derivative is maximal. Intuitively, this instant marks the change in the behavior of the global signal when it transits between ionization-driven to heating-driven evolution. Clearly, this approach does not apply to the cases with no emission feature. This definition is rather conservative, and in the cases with high degree of heating we lose some information. In particular, is typically lower than the value of where it deviates from the true neutral fraction by more than 5% (Table 1); moreover, in these cases works as well as at redshifts below . However, this definition of works very well in the cases when heating is weak and extracting the reionization information from the global signal is difficult, e.g., in the cases of with hard SED for molecular and atomic cooling. We find that in these cases is very close to the marginal value of at which ceases to be a good approximation. In other words, when using this model-independent criterion we do succeed to retain all the useful information in the “difficult” cases with weak heating; while we do lose some information in the “easy” cases with enough heating (however, as we see in the next section, this loss does not affect our main results).
Second, we assume that EoR starts at with the Universe being neutral at higher redshifts. This ”anchor” point can be determined from independent experiments, e.g., using the kinetic Sunyaev-Zeldovich effect (Zahn et al., 2012); therefore, we do not include in the list of our free parameters when fitting the ionization history.
Third, in the intermediate redshift range () is completed using a fitting function . We tried several options and found that the best results in terms of the final optical depth estimate are achieved with a three-parameter function which appears to fit the reionization history reasonably well for all the considered cases for which our approach can be applied (i.e., all the cases which undergo the heating transition until the end of the EoR). In particular, here we choose cumulative distribution function of Gamma distribution
where is the shape parameter, is the scale parameter, and marks the end of reionization. It is worth noting that in addition to the temperature effects, photoheating feedback complicates the fitting procedure for atomic and molecular cooling. In the presence of this feedback, the low-redshift neutral fraction does no longer follow the collapsed fraction (as it does in the case of massive halos which are immune to the photoheating feedback). For X-ray binaries with (red curve in Figure 2) formed in atomic cooling halos the true neutral fraction follows the collapsed fraction at high values of , while changing its behavior at due to the presence of a feature (a bump) introduced by the photoheating feedback. In this particular case, the information which we can extract from is dominated by the photoheating effects and does not give us any insight on the process of reionization at higher redshifts which we try to fit.
In total, our reconstructed neutral fraction, which we use in the next Section to find , is
| (4) |
We find that our method works well for the majority of cases with and does a decent job reconstructing when the starting point of reionization, , is chosen close to the true value. Figure 4 shows two examples of : (i) a case where the reconstruction works well (atomic cooling with hard SED and , , shown with black curves in the Figure), and (ii) where it fails (atomic cooling with hard SED and , , red curves). Here we clearly see that in the case of the low heating efficiency the photoheating feature is very misleading and does not allow for a more accurate fitting.

A simpler fit, such as the commonly used function, works well for a subset of models which we consider here, but with only two free parameters it does not capture the different shapes of the ionization history. In our case, this fit worked sufficiently well to describe the atomic cooling case with strong heating but failed to match the cases of molecular cooling and massive halos.
4. Reconstructing the Reionization optical depth
The CMB optical depth is dependent on the ionization history
| (5) |
where is the average number density of free electrons in ionized regions accounting for hydrogen ionization and first helium ionization, is the Thomson cross-section and is the line-of-sight proper distance element. Thus, knowing the ionization history from the global 21-cm signal should allow estimating the optical depth.
Although the reconstruction does not work perfectly well to reproduce as can be seen from Figure 4, the error in is expected to be much smaller than the error in itself because: (i) the largest part of the optical depth is contributed by redshifts when the Universe was fully ionized (in our case of massive halos with reionization ending at only 30% of the optical depth is sourced by the ionized patches during the EoR); and (ii) the fit over- and under-predicts at different redshifts which results is partial cancellation of the error.
Using we compute the optical depth and compare it to the true value, , found directly from the simulation data. The accuracy with which the optical depth can be extracted from the global signal depends on the value of , as can be seen from Figure 5 where the fractional error in the optical depth, , is shown as a function of for all the cases where the fitting procedure converged. In most of our cases features a broad minimum (of ) within which the fractional error in is below 1%. The location of this feature is very close to the true beginning of EoR, marked by grey bars in Figure 5 which correspond to the values of ionized fraction. The minimal value of the fractional error, which we quote in Table 1 together with the corresponding is below , which is much better than the current 1 confidence level of the Planck satellite (). In cases where the reconstruction does not work well and the fractional error does not feature a minimum, remains below level in the range of the ionized fraction.


5. Conclusions
The total CMB optical depth is a long-standing nuisance for CMB cosmology. Here we have examined to which extent the global 21-cm signal can be used to probe the total CMB optical depth in realistic cases of IGM heating, including hard and soft X-ray sources with low, standard and high heating efficiency. Following Fialkov et al. (2014), we have shown that the intensity of the 21-cm signal produced during the EoR is strongly affected by the thermal state of the IGM in addition to its ionization, which makes it harder to extract the reionization history from the global 21-cm signal compared to a scenario in which heating is saturated (Liu et al., 2015).
We have developed a simple and model independent approach to reconstruct the neutral fraction from a realistic global 21-cm signal and used it to estimate the optical depth for a large variety of models with different ionization and heating histories. The method can be summarized as follows: (i) at low redshifts we extract the neutral fraction from the global 21-cm signal going beyond the saturated heating assumption and using information on the thermal state of the IGM extracted directly from the mock global 21-cm signal; (ii) we assume that the redshift at which reionization starts, , is known with the Universe neutral at that epoch; (iii) we complement the neutral fraction in the intermediate redshift range using a three-parameter fitting function which works well for the different types of reionization histories which we have explored.
One of the main conclusions we reach is that with the thermal history added a better estimation of the reionization history is possible, and the neutral fraction can be reconstructed even when the 21-cm signal is affected by thermal history all the way throughout the EoR. As a proof of concept, we adopt a very simple method to estimate the temperature of neutral IGM using two critical points of the global signal, namely (i) the heating transition at which the gas kinetic temperature equates that of the CMB, and (ii) the beginning of the heating era when X-ray sources turn on. Even this simple method improves over the saturated heating approximation.
Finally, we calculate the optical depth using the extracted reionization history and show that an accurate measurement of , with fractional error below 1% over a wide range of , is possible even when the IGM heating is not saturated all the way throughout the EoR. We have blindly tested our method on a large variety of ionization histories for different star formation scenarios varying the low-mass cutoff of star-forming halos.
Our results are timely considering the plethora of existing and planned global 21-cm experiments which might remove the optical depth nuisance from the CMB cosmology in near future, allowing for a much more precise determination of the cosmological parameters.
References
- Ade et al. (2015) Planck Collaboration; Ade, P. A. R., et al. 2015, arXiv:1502.01589
- Ali et al. (2015) Ali, Z., Parsons, A. R., Zheng, H., Pober, J. C., Liu, A., et al., 2015 ApJ, 809, 61
- Barkana & Loeb (2005) Barkana, R., & Loeb, A., 2005 ApJ, 624, L65
- Becker et al. (2015) Becker, G. D., Bolton, J. S., Madau, P., et al. 2015, MNRAS, 447, 3402
- Bernardi et al. (2015) Bernardi, G., McQuinn M., & Greenhill, L. J., 2015, ApJ, 799, 1
- Bharadwaj & Ali (2004) Bharadwaj, S., & Ali, S. S. 2004, MNRAS, 352, 142
- Bowman & Rogers (2010) Bowman, J. D., & Rogers, A. E. E. 2010, Nature, 468, 796
- Bromm (2013) Bromm, V. 2013, RPPh, 76, 2901
- Burns et al. (2012) Burns, J. O., Lazio, J., Bale, S., Bowman, J., Bradley, R., et al. 2012, Advances in Space Research 49, 433
- Cappelluti et al. (2012) Cappelluti, N., Ranalli, P., Roncarelli, M., Arevalo, P., Zamorani, G., et al. 2012, MNRAS, 427, 651
- Cirelli et al. (2009) Cirelli, M., Iocco, F., & Panci, P. 2009, JCAP, 10, 009
- Chornock et al. (2013) Chornock, R., Berger, E., Fox, D. B., Lunnan, R., & Drout, M. R. 2013, ApJ, 774, 26
- Cohen et al. (2015) Cohen, A., Fialkov, & A., Barkana, R., 2015, arXiv:1508.04138
- Dalal et al. (2010) Dalal, N., Pen, U.-L., & Seljak, U. 2010, JCAP, 11, 007
- Dijkstra et al. (2012) Dijkstra, M., Gilfanov, M., Loeb, A., & Sunyaev, R. 2012, MNRAS, 421, 213
- Fan et al. (2006) Fan, X., Strauss, M. A., Becker, R. H., White, R. L., & Gunn, J. E. 2006, AJ, 132, 117
- Fialkov et al. (2012) Fialkov, A., Barkana, R., Thesilakhovich, C., & Hirata, C. M. 2012, MNRAS, 424, 1335
- Fialkov et al. (2013) Fialkov, A., Barkana, R., Visbal, E., Thesilakhovich, C., & Hirata, C. M. 2013, MNRAS, 432, 2909
- Fialkov et al. (2014) Fialkov, A., Barkana, R., & Visbal, E. 2014, Nature, 506, 197
- Fialkov & Barkana (2014) Fialkov, A. & Barkana, R. 2014, MNRAS, 445, 213
- Fialkov (2014) Fialkov, A. 2014, IJMPD, 2330017
- Fialkov et al. (2015) Fialkov, A., Cohen, A., Barkana, R., & Silk, J., in preparation
- Furlanetto (2006) Furlanetto, S. R. 2006, MNRAS 371, 867
- Furlanetto et al. (2006) Furlanetto, S. R., Oh, S. P., & Briggs, F. H. 2006, PhR, 433, 181
- Furlanetto et al. (2004) Furlanetto S. R., Zaldarriaga M., & Hernquist L. 2004, ApJ, 613, 1
- Fragos et al. (2013) Fragos, T., Lehmer, B. D., Naoz, S., Zezas, A., & Basu-Zych, A. 2013, ApJ, 776, 31.
- George (2015) George, E. M., Reichardt, C. L., Aird, K. A., Benson, B. A., Bleem, L. E., et al. 2015, ApJ, 799, 177
- Greenhill & Bernardi (2012) Greenhill, L. J. & Bernardi, G. 2012, arXiv:1201.1700
- Greif (2015) Greif, T. H. 2015, ComAC, 2, 3
- Koopmans et al. (2015) Koopmans, L., Pritchard, J., Mellema, G., Aguirre, J., Ahn, K., et al. 2015, Proceedings of Advancing Astrophysics with the Square Kilometre Array (AASKA14). 9 -13 June, 2014. Giardini Naxos, Italy
- Loeb & Furlanetto (2013) Loeb, A. & Furlanetto, S. 2013, The First Galaxies in the Universe, Princeton University Press (Princeton)
- Lehmer (2012) Lehmer, B. D., Xue, Y. Q., Brandt, W. N., Alexander, D. M., Bauer, F. E., et al. 2012, ApJ, 752, 46L
- Liu et al. (2015) Liu, A., Pritchard, J. R., Allison, R., Parsons, A. R., Seljak, U., & Sherwin, B. D. 2015, arXiv:150908463L
- Madau et al. (1997) Madau, P., Meiksin, A., & Rees, M. J. 1997, ApJ, 475, 429
- Madau et al. (2004) Madau, P., Rees, M. J., Volonteri, M., Haardt, F., & Oh, S. P. 2004, ApJ, 604, 484
- Maio et al. (2011) Maio, U., Koopmans, L. V. E., & Ciardi, B. 2011, MNRAS, 412, 40
- McQuinn & O’Leary (2012) McQuinn, M., & O’Leary, R. M. 2012, ApJ, 760, 4
- Mesinger et al. (2013) Mesinger A., Ferrara A., & Spiegel D. S. 2013, MNRAS, 431, 621
- Mirabel et al. (2011) Mirabel, I. F., Dijkstra, M., Laurent, P., Loeb, A. & Pritchard, J. R. 2011, A& A 528, A149
- de Oliveira-Costa et al. (2008) de Oliveira-Costa, A., Tegmark, M., Gaensler, B. M., Jonas, J., Landecker, T. L., & Reich, P. 2008, MNRAS, 388, 247
- Oh (2001) Oh, P., 2001 ApJ, 533, 499
- Pacucci et al. (2014) Pacucci, F., Mesinger, A., Mineo, S., Ferrara, A., et al. 2014, MNRAS, 443, 678
- Pentericci et al. (2014) Pentericci, L., Vanzella, E., Fontana, A., Castellano, M., Treu, T., et al. 2014, ApJ, 793, 113
- Pober et al. (2015) Pober, J. C., Ali, Z. S., Parsons, A. R., McQuinn, M., Aguirre, J. E., et al. 2015, ApJ 809, 62
- Pritchard & Furlanetto (2007) Pritchard, J. R. & Furlanetto, S. R. 2007, MNRAS, 376, 1680
- Pritchard & Loeb (2012) Pritchard, J. R. & Loeb, A. 2012, RPP, 75, 6901
- Robertson et al. (2015) Robertson, B. E., Ellis, R. S., Furlanetto, S. R., & Dunlop, J. S. 2015, ApJ, 802, 19
- Schauer et al. (2015) Schauer, A. T. P., Whalen, D. J., Glover, S. C. O., & Klessen, R. S. 2015, MNRAS, 454, 2441
- Seager et al. (2000) Seager, S., Sasselov, D., & Scott, D. 2000, ApJS, 128, 407
- Stacy et al. (2011) Stacy, A., Bromm, V., & Loeb, A. 2011, ApJ, 730, 1
- Tilvi et al. (2014) Tilvi, V., Papovich, C., Finkelstein, S. L., Long, J., Song, M., et al. 2014, ApJ, 794, 5
- Tseliakhovich & Hirata (2010) Tseliakhovich D., & Hirata C. M. 2010, PRD, 82, 083520
- Tseliakhovich et al. (2011) Tseliakhovich D., Barkana, R., & Hirata C. M. 2011, MNRAS, 418, 906
- Visbal et al. (2012) Visbal, E., Barkana, R., Fialkov, A., Tseliakhovich, D., & Hirata, C. M. 2012, Nature, 487, 70
- Visbal et al. (2014) Visbal, E., Haiman, Z., & Bryan, G. L. 2014, MNRAS, 442, 100
- Wyithe et al. (2003) Wyithe J. S. B., & Loeb A. 2003, ApJ, 586, 693
- Zahn et al. (2012) Zahn, O., Reichardt, C. L., Shaw, L., Lidz, A., Aird, K. A., et al. 2012, ApJ, 756, 65
- Zarka et al. (2012) Zarka, P., Girard, J. N., Tagger, M., & Denis, L. 2012, SF2A-2012: Proceedings of the Annual meeting of the French Society of Astronomy and Astrophysics