Jiamusi Pulsar Observations: I. Abnormal emission events of PSR B0919+06
Abstract
PSR B0919+06 generally radiates radio pulses in a normal phase range. It has been known for its occasional perplexing abnormal emission events wherein individual pulses come to an earlier phase range for a few tens of periods and then returns to its usual phase. Heretofore, only a few such events have been available for study. We observed PSR B0919+06 for about 30 hours using the Jiamusi 66-m telescope at Jiamusi Deep Space Station at S-band, and detected 92 abnormal emission events. We identify four types of events based on the abrupted or gradual phase-shifting of individual pulses. The abnormal emission events are seen to occur randomly some every 1000 to 3000 periods, and they affect the leading edge of the mean profile by up to 2% in amplitude. The abnormal emission events are probably related to gradual changes of emission processing in the pulsar magnetosphere.
keywords:
pulsars: general – pulsars: individual: PSR B0919+06.1 Introduction
Pulsars radiate the pulsed emission periodically, though individual pulses vary in shape and in intensity. Sub-pulses of individual pulses can appear in different ranges of pulsar rotation phases. Various phenomena such as nulling, subpulse drifting and mode-changing have been observed from many pulsars (see e.g. Sobey et al., 2015). When individual pulses are averaged over many periods, the mean pulse profile is very stable for a pulsar in general, which is believed to be a cut of the emission window of pulsar magnetosphere (Manchester, 1995), and their polarization features are closely related to the emission geometry (e.g. Lyne & Manchester, 1988; Gangadhara & Gupta, 2001; Wang et al., 2013). Sub-pulses of some pulsars drift within the pulsar emission window (e.g. Rankin, 1986; Rankin et al., 2013). Some pulsars exhibit different emission modes in a sequence of individual pulses. For example, the precursor of the main pulse and the interpulse of PSR B182209 are relevantly switched on and off for several hundreds of periods (Gil et al., 1994; Latham et al., 2012). The extreme case for emission mode changes is the nulling phenomena, in which case the emission process appears to be fully stopped for many periods (e.g. Wang et al., 2007; Yang et al., 2014; Sobey et al., 2015).
PSR B0919+06 is a nearby bright pulsar with a period of 0.43062 s and a small dispersion measure of 27.27 pc cm-3 (Hobbs et al., 2009). Its narrow mean pulse profile at high frequencies (e.g. above 1.4 GHz) is highly polarized (Stinebring et al., 1984; Johnston et al., 2008; Hankins & Rankin, 2010), and is very asymmetric with a long gradual leading edge and a sharp trailing edge. Such a profile was classified as a partial cone by Lyne & Manchester (1988), and the emission at high frequencies originates mainly from the trailing conal component. At lower frequencies, two or three profile components emerge (Phillips & Wolszczan, 1992; Smits et al., 2006; Johnston et al., 2008; Hankins & Rankin, 2010), and the central core and leading conal components become stronger. Orthogonal polarization modes have been observed mainly in the central weak component (Stinebring et al., 1984; Rankin et al., 2006; Smits et al., 2006).
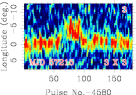
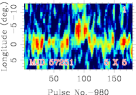
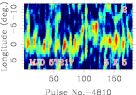
The abnormal emission events of PSR B0919+06 were first discovered by Rankin et al. (2006), who noticed five occurrences of a gradual shifting of individual pulses about in longitude towards early pulse phases from four pulse squences of 10763 pulses in total. From their observations made on MJD 52854 at 1425 MHz, two abnormal emission events are seen in the pulse series of 480 s (1115 pulses), each lasting for 30-40 periods with a separation of some 650 periods. Rankin et al. (2006) observed PSR B0919+06 at 327 MHz for 30 minutes (4180 pulses) on MJD 52916, and detected one event lasting for 60 periods. They also found two more abnormal emission events in archive data of Stinebring et al. (1984) of 3582 pulses observed on MJD 44857 at 1.4 GHz, but no event from 1886 pulses observed on MJD 44859. The great advantage of the observations made by Rankin et al. (2006) is that polarization data are recorded. The orthogonal polarization modes and the integrated polarization profiles for the normal emission mode and the abnormal emission events of PSR B0919+16 obtained from these observations clearly show that the leading conal component and the core component emerge during the abnormal emission events at 1425 MHz and during the normal the abnormal modes at 327 MHz. The orthogonal polarization modes were detected from not only the core component at 1425 MHz but also both the leading conal component and the core component at 327 MHz. A very important conclusion derived from the observation of Rankin et al. (2006) is that the polarization angles during the abnormal emission events follow the same “S”shaped-curve as the trailing conal component (shown in their Figure 3) after the orthogonal polarization modes are considered, suggesting that the abnormal emission events occur as if the two profile components at early pulse phases are lightened and the trailing conal component is switched off.
Such abnormal emission events of PSR B0919+06 for a gradual shifting of individual pulses were recently confirmed by Perera et al. (2015) from their single pulses observed at MJD 55751. In addition to such a so-called “main flare state” of shifting Perera et al. (2015) found a “small flare state”, characterized by a smaller gradual shifting of about 3∘ in longitude of pulse phases for a few seconds.
Very intriguing is the fact that the profiles of PSR B0919+06 have also shown two states (Lyne et al., 2010; Perera et al., 2015) with the most distinctive difference exactly in the range of pulse phases where abnormal emission events stand out. Long term timing observations of PSR B0919+06 (Lyne et al., 2010; Perera et al., 2015) show that its spin-down rate varies between “low and high states” with a double-peak structure and a quasi-periodicity of 630 days or 550 days, which was seen to be very closely correlated with variations between the two profile states. Perera et al. (2015) removed the identified “flare states” shown in one or two subintegrations (10 seconds or 1 minute each) from their timing data of normally 20 minutes and found that the correlation still exists between the slow variations and the profile-shape parameters. It is possible that variations of profiles arised from either some un-identified “flare states” or the leakages of flares to nearby subintegrations or “small flares” in their timing data.
At the present, it is unclear how often and how long the abnormal emission events occur in PSR B0919+06 and how much they contribute to the profile variations. Here we report our observations of PSR B0919+06 for about 30 hours by using the Jiamusi 66-m telescope at Jiamusi Deep Space Station, in which we find 92 abnormal emission events. The observation system is briefly described in Sect. 2, the results are presented and analyzed in Sect. 3, and discussions and conclusions are given in Sect. 4.
| Obs. Date | MJD | Start Time | Obs. length | Channel | Sample |
|---|---|---|---|---|---|
| UTC | UTC | min. / Pulse No. | No. | (ms) | |
| 2015.04.18 | 57130 | 13:29 | 15.0 / 2088 | 256 | 0.19968 |
| 2015.07.12 | 57215 | 04:09 | 381.0 / 53053 | 256 | 0.19968 |
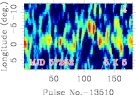
| 2015.07.14 | 57217 | 01:07 | 485.2 / 67611 | 256 | 0.19968 |
| 2015.08.17 | 57251 | 22:31 | 466.5 / 65003 | 128 | 0.09984 |
| 2015.08.18 | 57252 | 22:15 | 253.4 / 35306 | 256 | 0.19968 |
| 2015.08.19 | 57253 | 03:20 | 179.4 / 25001 | 256 | 0.19968 |
| MJD | Event No. | Start–End pulse No. | Duration | Type | Details |
|---|---|---|---|---|---|
| 57130 | 1 | 365 – 395 | 31 | Fig.2 | |
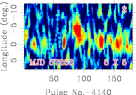
| 57215 | 1 | 1360 – 1400 | 41 | ? | Fig.12 |
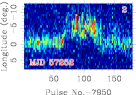
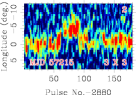
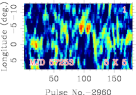
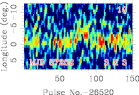
| 57215 | 2 | 2940 – 2975 | 36 | M | Fig.9 |
| 57215 | 3 | 4638 – 4683 | 46 | M | Fig.9 |
| 57215 | 4 | 6710? – 6760 | 51 | M | Fig.9 |
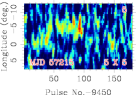
| 57215 | 5 | 9510 – 9550 | 41 | ? | Fig.12 |
| 57215 | 6 | 15280? – 15325? | 46 | ? | Fig.12 |
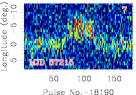
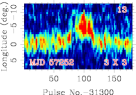
| 57215 | 7 | 18258 – 18309 | 52 | Fig.8 | |
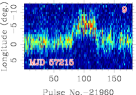
| 57215 | 8 | 20238 – 20284 | 47 | Fig.8 | |
| 57215 | 9 | 22040 – 22080 | 41 | Fig.8 | |
| 57215 | 10 | 23213 – 23248 | 36 | Fig.11 | |
| 57215 | 11 | 24315 – 24339 | 25 | Fig.10 | |
| 57215 | 12 | 27330? – 27365? | 36? | ? | Fig.12 |
| 57215 | 13 | 29845 – 29882? | 38? | M | Fig.9 |
| 57215 | 14 | 31422 – 31460 | 39 | M | Fig.9 |
| 57215 | 15 | 33130 – 33163 | 34 | M | Fig.9 |
| 57215 | 16 | 35195 – 35240 | 46 | M | Fig.9 |
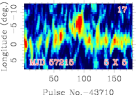
| 57215 | 17 | 43770 – 43812 | 43 | ? | Fig.12 |
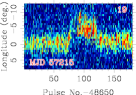
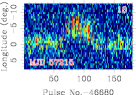
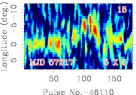
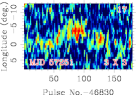
| 57215 | 18 | 46745 – 46794 | 50 | Fig.8 | |
| 57215 | 19 | 48722 – 48770 | 49 | Fig.8 | |
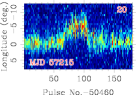
| 57215 | 20 | 50525 – 50567 | 43 | Fig.8 | |
| 57215 | 21 | 51700 – 51736 | 37 | Fig.11 | |
| 57215 | 22 | 52796 – 52822 | 27 | Fig.10 | |
| 57217 | 1 | 3175 – 3225? | 51? | M | Fig.9 |
| 57217 | 2 | 4900? – 4935? | 36? | ? | Fig.12 |
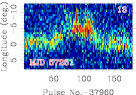
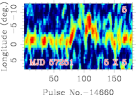
| 57217 | 3 | 14950 – 14993 | 44 | M | Fig.9 |
| 57217 | 4 | 16955 – 16990 | 36 | M | Fig.9 |
| 57217 | 5 | 21495 – 21535 | 41 | ? | Fig.12 |
| 57217 | 6 | 31165? – 31190? | 26? | Fig.10 | |
| 57217 | 7 | 33278 – 33312 | 35 | M | Fig.9 |
| 57217 | 8 | 35414 – 35449 | 36 | M | Fig.9 |
| 57217 | 9 | 38315 – 38357 | 43 | M | Fig.9 |
| 57217 | 10 | 39651 – 39690 | 40 | M | Fig.9 |
| 57217 | 11 | 39982 – 39998 | 17 | Fig.10 | |
| 57217 | 12 | 40777 – 40796 | 20 | Fig.10 | |
| 57217 | 13 | 42208 – 42250 | 43 | M | Fig.9 |
| 57217 | 14 | 44078 – 44127 | 50 | M | Fig.9 |
| 57217 | 15 | 46200 – 46235 | 36 | ? | Fig.12 |
| 57217 | 16 | 53655 – 53700 | 46 | M | Fig.9 |
| 57217 | 17 | 55047 – 55080 | 34 | M | Fig.9 |
| 57217 | 18 | 61080 – 61120 | 41 | Fig.11 | |
| 57217 | 19 | 63446 – 63482 | 37 | M | Fig.9 |
| 57217 | 20 | 65035? – 65070? | 36? | ? | Fig.12 |
| 57217 | 21 | 66840 – 66875 | 36 | ? | Fig.12 |
| 57251 | 1 | 1050? – 1090? | 41? | ? | Fig.12 |
| 57251 | 2 | 5522 – 5565 | 44 | M | Fig.9 |
| 57251 | 3 | 6860 – 6887 | 28 | Fig.10 | |
| 57251 | 4 | 8125 – 8165? | 41? | M | Fig.9 |
| 57251 | 5 | 14750? – 14780? | 31? | ? | Fig.12 |
| 57251 | 6 | 16170 – 16195 | 26 | ? | Fig.12 |
| 57251 | 7 | 22020? – 22055 | 36? | M | Fig.9 |
| 57251 | 8 | 23822 – 23856 | 35 | Fig.10 | |
| 57251 | 9 | 25867 – 25903 | 37 | M | Fig.9 |
| 57251 | 10 | 28397 – 28436 | 40 | M | Fig.9 |
| 57251 | 11 | 31802 – 31844 | 43 | M | Fig.9 |
| 57251 | 12 | 36030? – 36065? | 36? | Fig.10 | |
| 57251 | 13 | 38027 – 38080 | 54 | M | Fig.9 |
| 57251 | 14 | 39385 – 39430 | 46 | Fig.10 | |
| 57251 | 15 | 40571 – 40600 | 30 | Fig.10 | |
| 57251 | 16 | 44775 – 44820 | 46 | M | Fig.9 |
| 57251 | 17 | 46880 – 46940 | 61 | ? | Fig.12 |
| 57251 | 18 | 50630? – 50675 | 46? | Fig.10 |
| MJD | Event No. | Start–End pulse No. | Duration | Type | Details |
|---|---|---|---|---|---|
| 57251 | 19 | 52720 – 52760 | 41 | Fig.10 | |
| 57251 | 20 | 54076 – 54115 | 40 | M | Fig.9 |
| 57251 | 21 | 54580 – 54612 | 33 | Fig.10 | |
| 57251 | 22 | 56295 – 56343 | 49 | M | Fig.9 |
| 57251 | 23 | 56892 – 56925 | 34 | Fig.10 | |
| 57251 | 24 | 58188 – 58210 | 23 | Fig.10 | |
| 57251 | 25 | 59745 – 59772 | 28 | Fig.10 | |
| 57251 | 26 | 62310 – 62355 | 46 | ? | Fig.12 |
| 57252 | 1 | 4667 – 4726 | 60 | M | Fig.9 |
| 57252 | 2 | 8015 – 8080 | 66 | M | Fig.9 |
| 57252 | 3 | 10750 – 10800 | 51 | ? | Fig.12 |
| 57252 | 4 | 13605? – 13640? | 36? | ? | Fig.12 |
| 57252 | 5 | 16618 – 16666 | 49 | Fig.10 | |
| 57252 | 6 | 17472 – 17502 | 31 | Fig.10 | |
| 57252 | 7 | 19175? – 19210? | 36? | ? | Fig.12 |
| 57252 | 8 | 24220 – 24260 | 41 | ? | Fig.12 |
| 57252 | 9 | 25960 – 25990 | 31 | ? | Fig.12 |
| 57252 | 10 | 26585 – 26620 | 36 | ? | Fig.12 |
| 57252 | 11 | 28122 – 28160 | 39 | M | Fig.9 |
| 57252 | 12 | 29195 – 29215 | 21 | Fig.10 | |
| 57252 | 13 | 31375 – 31416 | 42 | M | Fig.9 |
| 57252 | 14 | 32296 – 32320 | 25 | Fig.10 | |
| 57252 | 15 | 33455? – 33470? | 16? | Fig.10 | |
| 57252 | 16 | 34198 – 34245 | 48 | Fig.10 | |
| 57253 | 1 | 3035? – 3075? | 41? | ? | Fig.12 |
| 57253 | 2 | 4210 – 4235 | 26 | ? | Fig.12 |
| 57253 | 3 | 7010 – 7060 | 51 | ? | Fig.12 |
| 57253 | 4 | 9950? – 9985? | 36? | ? | Fig.12 |
| 57253 | 5 | 21426 – 21480? | 55? | ? | Fig.12 |
| 57253 | 6 | 22665? – 22700? | 36? | ? | Fig.12 |
Note: “?” indicates the uncertainty in the start–end pulse numbers, duration and classification.
2 The observation system and data taking
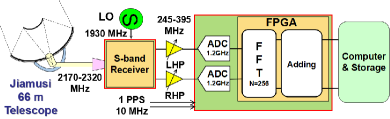
The Jiamusi 66-m telescope is located at Jiamusi in Heilongjiang province, China, which is operated by the Jiamusi Deep Space Station of the China Xi’an Satellite Control Center. A cryogenically cooled dual-channel S-band receiver was used for the observations, which has a bandwidth of about 140 MHz at the radio frequency around 2.25 GHz. After adjusting the signal amplitude of the intermediate frequency (IF) output with two variable-gain amplifiers, we connected a digital backend to the receiver (see Figure 1 for illustration). The backend samples the IF signals and then channelizes the signals via a FFT module in a Field-Programmable Gate Array (FPGA) board. The total radio power is obtained by summing the detected power from the left hand and right hand polarization receivers for each of the 256 or 128 frequency channels, and then accumulated for duration of the sampling time. The accumulated radio powers of 256 or 128 channels are saved to a computer with a time resolution of 0.2 ms or 0.1 ms.
A test observation was made for 15 minutes on 2015 April 18 (MJD 57130), and long observations of PSR B0919+06 were made in 2015 July and August (MJD 57215 – 57253, see Table 1).
3 Data Analysis and results
A few steps were needed to analyze the recorded data. First, the radio frequency interference (RFI) was cleaned. RFI appears in a few channels for a long time or in many channels for a some short time. The polluted data were identified and then replaced with randomly selected samples from the same channel or nearby channels to keep the statistical properties. The total power data from all channels were dedispersed with the known dispersion measure value of PSR B0919+06, and then summed with proper weights due to different gains of the 256 or 128 channels to get a long time series. Finally, the individual pulses were aligned with the best period which we found out around the formal period value.
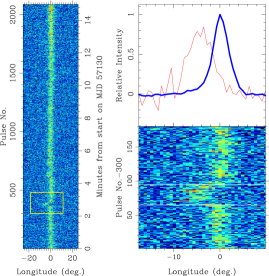
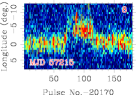
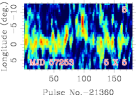
Results from a test observation of PSR B0919+06 on MJD 57130 are shown in Figure 2. One abnormal emission event was identified between pulses 365 and 395, as illuminated in the right panels, in which pulses show up at earlier phases of about in longitude. This event is very similar to the two abnormal emission events observed by Rankin et al. (2006, shown in their Figure 1) and the one “main flare state” observed by Perera et al. (2015, shown in their Figure 10), during which individual pulses have a gradual shifting in the pulse rotation phase for 30-40 periods.
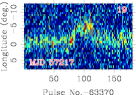
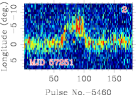
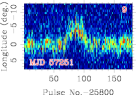
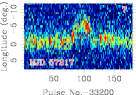
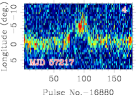
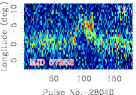
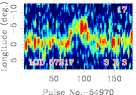
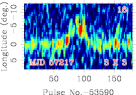
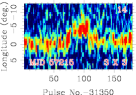
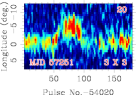
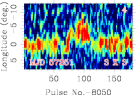
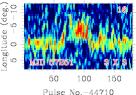
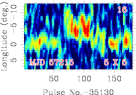
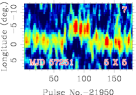
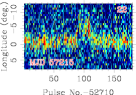

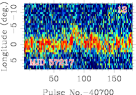
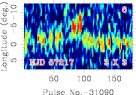
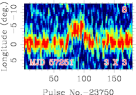
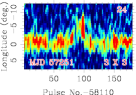
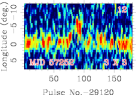
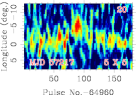
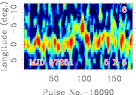
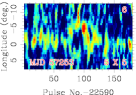
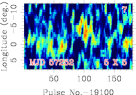
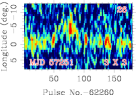
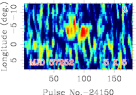
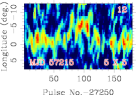
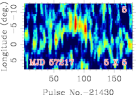
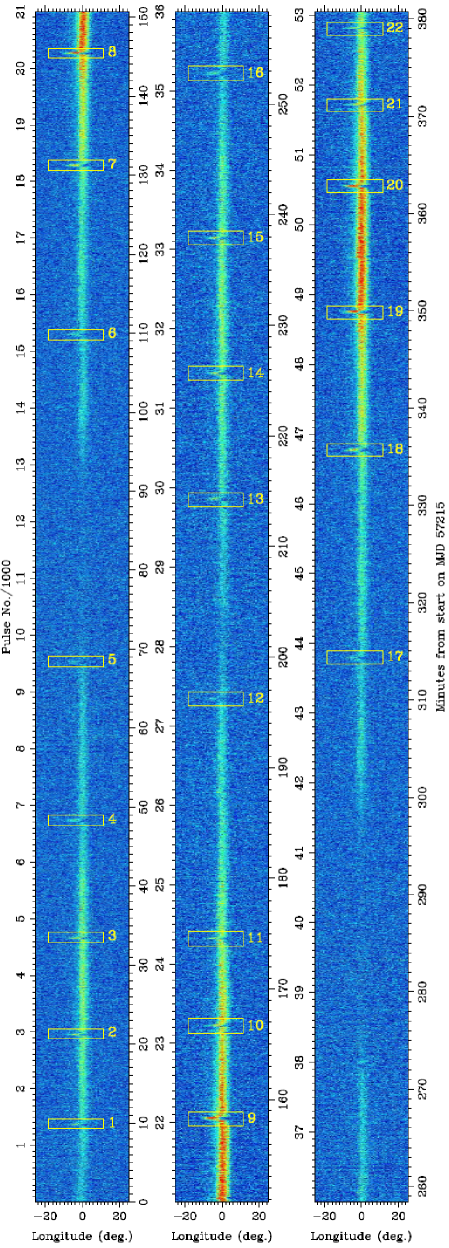
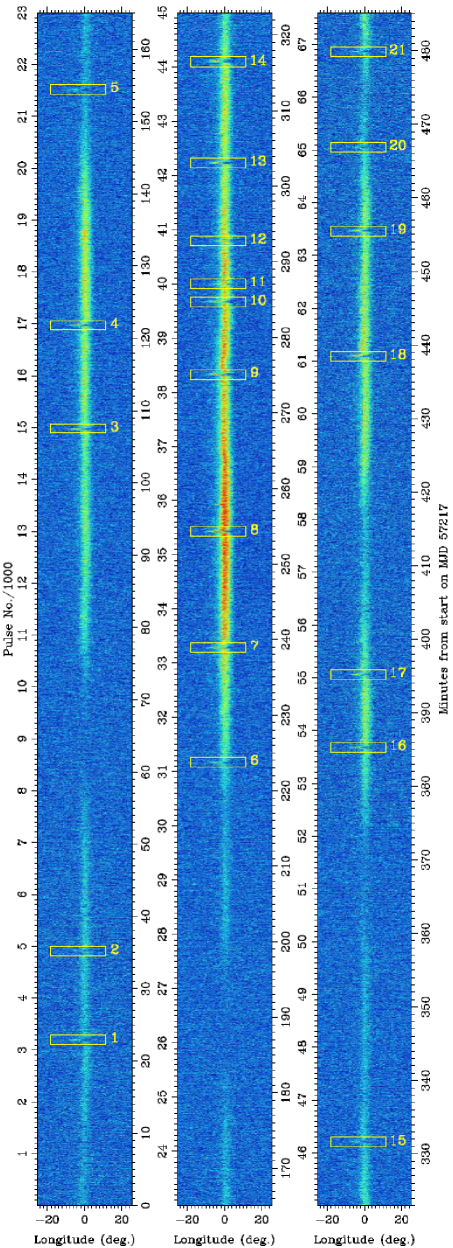
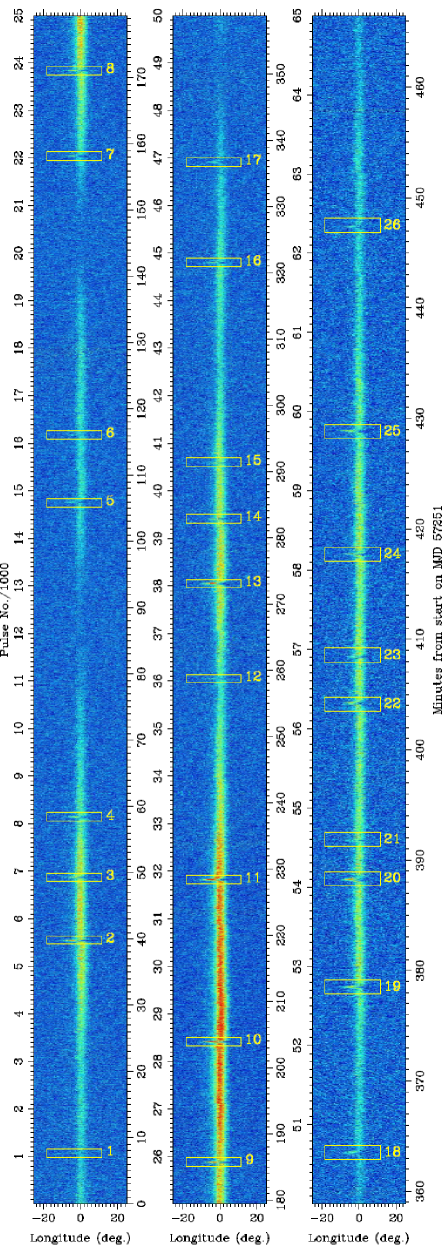
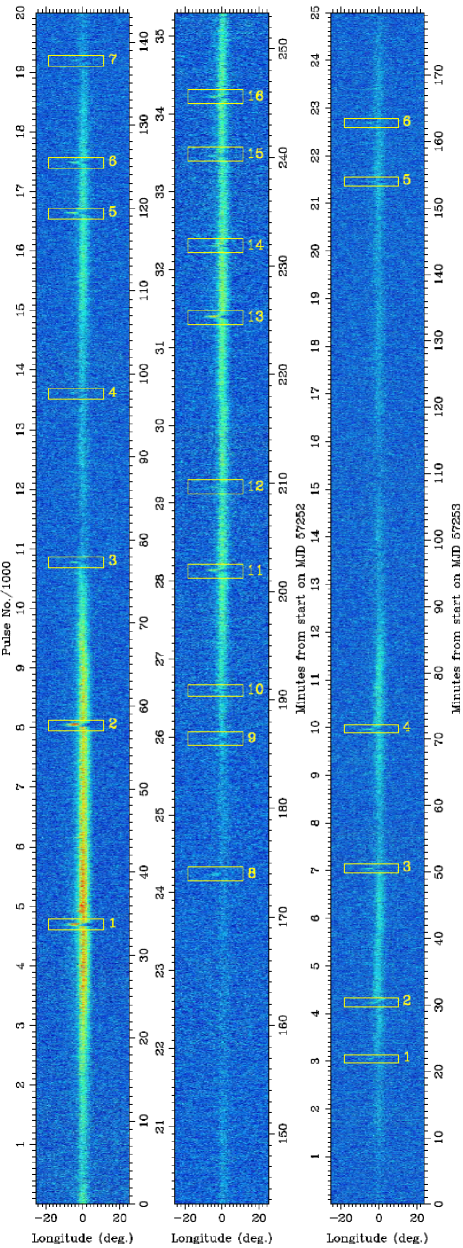
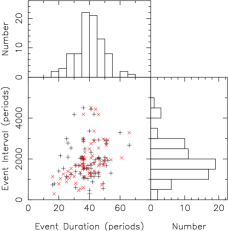
To investigate how often such events occur, we have carried out observations in 5 days, several hours in each day. The aligned plots of individual pulses111Dedispersed data series are available at http://zmtt.bao.ac.cn/psr-jms/ are shown in Figures 3–6. Due to interstellar scintillation, the flux intensity of PSR B0919+06 clearly shows variations on a time scale of one to two hours. From these long series of individual pulses, we found 92 abnormal emission events through the visual-checking of plots. See Table 2 for their start and end pulse numbers. Based on the total number of events over the entire timespan of observations, we can estimate that one event, on average, occurs about every 20 minutes. However, there are possibilities that events were missing when pulsar signals are weaked by scintillation. The total number of events should therefore be taken as the lower limit, and hence the waiting time of events are expected to be shorter. As shown in Figure 7, we made the duration statistics for the pulsar normal mode emission and abnormal emission events. The abnormal emission events were seen to last for 15–70 periods with a peak of about 40 periods (i.e. 20 seconds, remembering the pulsar period of 0.43062 s), and normal emission lasted for 1000 to 3000 periods with a peak about 1500 periods (i.e. 10 minutes).
The abnormal emission events of PSR B0919+06 were obviously detected by looking at plots for individual pulses if with a good signal-to-noise ratio. For events with weak signals, the data samples of neighbor phase bins and from a few periods could be averaged to enhance the signal-to-noise radio. Based on their details of phase-shifting of individual pulses, we classified abnormal emission events as following:
-
•
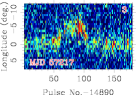
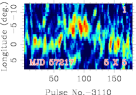
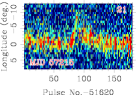
type: Individual pulses of abnormal emission events abruptly come a few degrees early in longitude, and then stay in this phase range (i.e. the “high state”) for a few tens of periods, eventually come back abruptly to the normal phase range. There are seven such cases detected during our observations, one shown in Figure 2 and six shown in Figure 8. Such a quick switching is almost the same as the mode-changing phenomena of other pulsars. Note also that subpulse drifting was observed before and during the abnormal emission events No. 8 and No. 19 observed on MJD 57215, which can be seen from very enlarged plots of Figure 8.
-
•
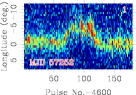
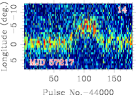
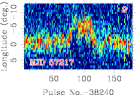
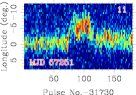
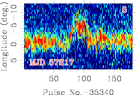
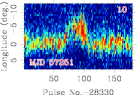
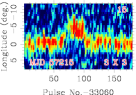
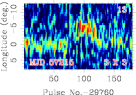
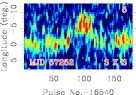
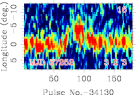
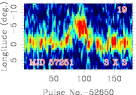
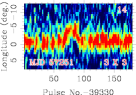
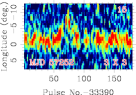
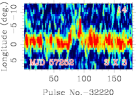
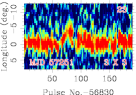
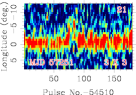
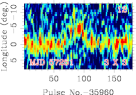
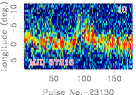
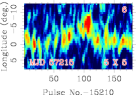
M type: It is the original type of abnormal emission event that was discovered by Rankin et al. (2006). Individual pulses gradually “go up” on the longitude over a few periods, stay on the “high state” for more than 20 periods perhaps with some fluctuations in phases, and finally gradually come back to the normal phase over a few periods. We identified 33 events of this type (see Figure 9).
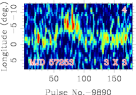
- •
-
•
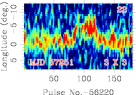
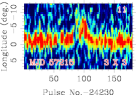
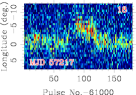
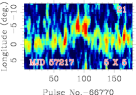
type: A few abnormal emission events show a rapid “rise” but a slow “decay”, which appears as a longer tail in Figure 11.
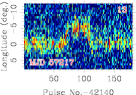
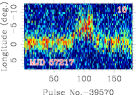
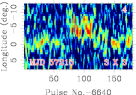
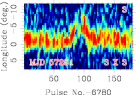
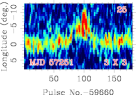
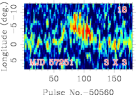
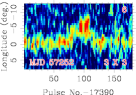
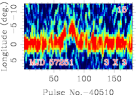
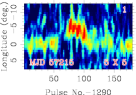
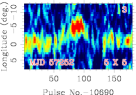
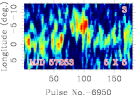
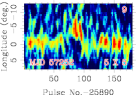
In addition to these classified events, 26 events (see Figure 12) have a very weak signal-to-noise ratio, which can not be certainly classified even after their “images” are enhanced by a “Gaussian smoothing”. These events are marked with a “?” for the type in Table 2.
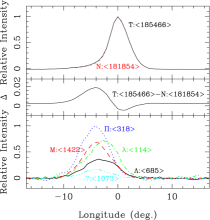
The short duration and the small total number of individual pulses of abnormal emission events indicates that they contribute very little () to the mean intensity. In Figure 13, we compare the mean pulsar profile from all 185466 bright pulses including abnormal emission events with that from 181854 bright pulses excluding the abnormal emission events in between. The difference between the above two profiles are shown in the middle panel. In the bottom panel the mean profiles of all types of abnormal emission events are shown, and clearly they are different. The abnormal emission events mostly affect the mean profile in the phase window of to .
4 Discussions and Conclusions
We observed PSR B0919+06 for about 30 hours and detected 92 abnormal emission events during which individual pulses are shifted to early pulse phases by a few degrees in longitude. Such events last for a few tens of periods, and are seen to happen randomly every 1000 to 3000 periods. We have classified the abnormal emission events into four types based on the phase-shift features of individual pulses.
Although the pulse number during the abnormal emission events are small (3612 vs. 185466 normal pulses, i.e. about 2%), it is clear that the abnormal emission events should lead to changes of mean pulse profiles of PSR B0919+06 up to 2%. This amplitude is roughly equal to the difference of the two profile modes shown by Perera et al. (2015). Timing observations for 20 minutes or less may or may not include one abnormal emission event, since the events occur randomly with an interval of 500 to 3500 periods (i.e. 200 to 1400 seconds). Therefore it is not clear if the long-term variations of profiles are related to such abnormal emission events. In addition, during timing, it seems to be important to get the time of arrival of pulses by fitting the standard profile to the profiles only in the later phase range of , rather than the all phase ranges of pulsed emission.
Can the precession be the causal reason for the abnormal emission events? Free precession has been suggested to cause long-term variations of pulsar profiles and (Stairs et al., 2000; Kerr et al., 2015), especially their correlation (Akgün et al., 2006; Jones, 2012). However, a small wobbling of the rotation axis should lead a gradual variation of profiles quasi-periodically, not just in short duration of 20 seconds of every 10 to 15 minutes. Therefore, it is very unlikely that the precession is the intrinsic cause for such abnormal emission events lasting only for a few tens of periods.
We emphasize that PSR B0919+06 is not the only pulsar with such a phase shift. PSR B1859+07 was also found (Rankin et al., 2006; Perera et al., 2016) to exhibit similar events, though the events were seen to be much more frequent. Other pulsars might have similar emission features uncovered, simply due to lack of long observations.
Based on the features of abnormal emission events of PSR B0919+06 we observed, together with the same mean “S”-shaped curve of polarization angles of the abnormal emission events as the normal trailing conal component observed by Rankin et al. (2006, as described in Section 1), we believe that the abnormal emission events of PSR B0919+06, as the phenomena of mode-changing and subpulse drifting observed in other pulsars, probably originate from emission processes in the pulsar magnetosphere.
Acknowledgments
We thank Prof. JinXin Hao of NAOC for his support of this work, Prof. Biping Gong from Huazhong University of Science and Technology for stimulative discussions, and Ms. SuSu Shan, Mr. Fan Yang and the operation team of Jiamusi 66 m Deep Space Station of the China Xi’an Satellite Control Center for the assistance of observations. We also thank the referee for helpful comments. The authors are partially supported by the National Natural Science Foundation of China through grants No. 11473034 and 11273029, the Strategic Priority Research Program “The Emergence of Cosmological Structures” of the Chinese Academy of Sciences, Grant No. XDB09010200”, and the Open Fund of the State Key Laboratory of Astronautic Dynamics of China.
References
- Akgün et al. (2006) Akgün T., Link B., Wasserman I., 2006, MNRAS, 365, 653
- Gangadhara & Gupta (2001) Gangadhara R. T., Gupta Y., 2001, ApJ, 555, 31
- Gil et al. (1994) Gil J. A., Jessner A., Kijak J., Kramer M., Malofeev V., Malov I., Seiradakis J. H., Sieber W., Wielebinski R., 1994, A&A, 282, 45
- Hankins & Rankin (2010) Hankins T. H., Rankin J. M., 2010, AJ, 139, 168
- Hobbs et al. (2009) Hobbs G., Hollow R., Champion D., et al. 2009, PASA, 26, 468
- Johnston et al. (2008) Johnston S., Karastergiou A., Mitra D., Gupta Y., 2008, MNRAS, 388, 261
- Jones (2012) Jones D. I., 2012, MNRAS, 420, 2325
- Kerr et al. (2015) Kerr M., Hobbs G., Johnston S., Shannon R., 2015, MNRAS, in press. ArXiv e-prints 1510.06078
- Latham et al. (2012) Latham C., Mitra D., Rankin J., 2012, MNRAS, 427, 180
- Lyne et al. (2010) Lyne A., Hobbs G., Kramer M., Stairs I., Stappers B., 2010, Science, 329, 408
- Lyne & Manchester (1988) Lyne A. G., Manchester R. N., 1988, MNRAS, 234, 477
- Manchester (1995) Manchester R. N., 1995, Journal of Astrophysics and Astronomy, 16, 107
- Perera et al. (2015) Perera B. B. P., Stappers B. W., Weltevrede P., Lyne A. G., Bassa C. G., 2015, MNRAS, 446, 1380
- Perera et al. (2016) Perera B. B. P., Stappers B. W., Weltevrede P., Lyne A. G., Rankin J. M., 2016, MNRAS, 455, 1071
- Phillips & Wolszczan (1992) Phillips J. A., Wolszczan A., 1992, ApJ, 385, 273
- Rankin (1986) Rankin J. M., 1986, ApJ, 301, 901
- Rankin et al. (2006) Rankin J. M., Rodriguez C., Wright G. A. E., 2006, MNRAS, 370, 673
- Rankin et al. (2013) Rankin J. M., Wright G. A. E., Brown A. M., 2013, MNRAS, 433, 445
- Smits et al. (2006) Smits J. M., Stappers B. W., Edwards R. T., Kuijpers J., Ramachandran R., 2006, A&A, 448, 1139
- Sobey et al. (2015) Sobey C., Young N. J., Hessels J. W. T., et. al. 2015, MNRAS, 451, 2493
- Stairs et al. (2000) Stairs I. H., Lyne A. G., Shemar S. L., 2000, Nat, 406, 484
- Stinebring et al. (1984) Stinebring D. R., Cordes J. M., Rankin J. M., Weisberg J. M., Boriakoff V., 1984, ApJS, 55, 247
- Wang et al. (2007) Wang N., Manchester R. N., Johnston S., 2007, MNRAS, 377, 1383
- Wang et al. (2013) Wang P. F., Han J. L., Wang C., 2013, ApJ, 768, 114
- Yang et al. (2014) Yang A., Han J. L., Wang N., 2014, Science China Physics, Mechanics, and Astronomy, 57, 1600