Ginwidth=\Gin@nat@width,height=\Gin@nat@height,keepaspectratio
\toappearPublication rights licensed to ACM. ACM acknowledges that this contribution was authored or co-authored by an employee, contractor or affiliate of a national government. As such, the Government retains a nonexclusive, royalty-free right to publish or reproduce this article, or to allow others to do so, for Government purposes only
CHI’16, May 07 - 12, 2016, San Jose, CA, USA
Copyright is held by the owner/author(s). Publication rights licensed to ACM.
ACM 978-1-4503-3362-7/16/05…$15.00
DOI: http://dx.doi.org/10.1145/2858036.2858525
![[Uncaptioned image]](/html/1601.02768/assets/img/teaser.jpg)
We demonstrate how electroencephalography can be used to evaluate human-computer interaction. For example, a keyboard (left) can be compared with a touch interface (middle) using a continuous measure of mental workload (right, here participant 4).
Framework for Electroencephalography-based Evaluation of User Experience
Abstract
Measuring brain activity with electroencephalography (EEG) is mature enough to assess mental states. Combined with existing methods, such tool can be used to strengthen the understanding of user experience. We contribute a set of methods to estimate continuously the user’s mental workload, attention and recognition of interaction errors during different interaction tasks. We validate these measures on a controlled virtual environment and show how they can be used to compare different interaction techniques or devices, by comparing here a keyboard and a touch-based interface. Thanks to such a framework, EEG becomes a promising method to improve the overall usability of complex computer systems.
keywords:
EEG; HCI Evaluation; Workload; Attention; Interaction errors; Neuroergonomycategory:
H.5.2 User Interfaces Evaluation/methodology
Introduction
In practice, a tool is only as good as one’s ability to assess it. For instance, evaluations in Human-Computer Interaction (HCI) usually rely on inquiries – e.g., questionnaires or think aloud protocols – or on users’ behavior during the interaction– e.g., reaction time or error rate. However, while both types of methods have been used successfully for decades, they suffer from some limitations. Inquiries are prone to be contaminated by ambiguities [24] or may be affected by social pressure [27]. It is also very difficult to gain real-time insights without disrupting the interaction. Indeed, think aloud protocol distracts users and questionnaires can be given only at specific time points, usually at the end of a session – which leads to a bias due to participants’ memory limitations [18]. On the other hand, metrics inferred from behavioral measures can be computed in real-time, but are mostly quantitative. They do not provide much information about users’ mental states. For example, a high reaction time can be caused either by a low concentration level or by a difficult task [2, 15].
Recently, is has been suggested that portable brain imaging techniques – such as electroencephalography (EEG) and functional near infrared spectroscopy (fNIRS) – have the potential to address these limitations [9, 28, 12]. fNIRS has been studied to assess users’ workload, for example to evaluate user interfaces [16] or different data visualizations [26]. However, most of these works are evaluating passive tasks or very basic interactions that are not ecological, especially as user interfaces and interactions are getting more complex.
In this paper, not only do we detail a framework for HCI designers to gain further insights about user experience using brain signals – here from EEG – but we also validate this framework on an actual and realistic task. We show that they can be used to compare different HCI, in an environment that provides many simulations and where participants are engaged in rich interactions.
In the following sections, we describe the virtual environment that we developed, specifically aimed at validating the use of EEG as an evaluation method for HCI. We validated the workload induced by our environment in a first study, with NASA-TLX questionnaires [15]. Then, we detail how EEG can be used to assess 3 different constructs: workload, attention and error recognition. Finally, during the main study we employ EEG recordings to measure continuously such workload, altogether with the attention level of participants toward external stimuli and the number of interaction errors they perceived, while they interact with our virtual environment. We took the opportunity of these EEG-based measures to compare a keyboard input to a touch screen input.
To summarize, our main contributions are:
-
1.
To validate the use of EEG as a continuous HCI evaluation method thanks to controlled and realistic interaction tasks we designed.
-
2.
To demonstrate how such tool can assess which of the tested interaction technique is better suited for a particular environment.
-
3.
To propose a framework that can be easily replicated to improve existing interfaces with little or no modifications.
Related work
Since a few years, brain imaging has been used in HCI to deepen the understanding of users, thanks notably to the spread of affordable and lightweight devices. For instance, EEG and fNIRS are particularly well suited for mobile brain imaging [21, 7]. These techniques can be employed to study the spatial focus of attention [33] or to identify system errors [34, 30].
EEG and fNIRS are opportunities to assess the overall usability of a system and improve the ergonomics of HCI. In a recent work we showed preliminary results regarding the evaluation of mental workload during a 3D manipulation task [36]. After being processed, EEG signals highlighted which parts of the interaction induced a higher mental workload. In the present paper we go much beyond, exploring a continuous index of workload as well as two others constructs, namely attention and error recognition. We also rigorously validate such indexes, and study them in light of behavioral measures (performances and reaction times) and inquiries (NASA TLX questionnaire).
Attention refers to the ability to focus cognitive resources on a particular stimulus [18]. In HCI, measuring the attention level could help to estimate how much information users perceive. In the present work the measure of attention relates to inattentional blindness; i.e. it concerns participants’ capacity to process stimuli irrelevant to the task [5].
Error recognition relates to the detection by users of an outcome different from what is expected [23]. We focused on interaction errors [10], which arise when a system reacts in an unexpected way, for example if a touch gesture is badly recognized. Interaction errors enable to assess how intuitive a UI is, and they are hardly measurable by another physiological signal than EEG. The combined measure of workload, attention and error recognition constitutes a powerful complementary evaluation tool for people who design new interaction techniques.
Even though commercial solutions, such as the B-Alert system111http://www.advancedbrainmonitoring.com/, are already pointing this direction, they are validated in the literature with lab tasks only [2]. Our work, on the other hand, is closer to the field. More importantly, as opposed to proprietary software, our methodology is transparent and our multidimensional index of user experience can be easily replicated.
Virtual 3D maze
The 3D virtual environment that we built uses gamification [8] to increase users’ engagement and ensure better physiological recordings [11]. Such a virtual environment also enables us to assess workload, attention and error recognition during ecological and realistic interaction tasks. Indeed, such constructs are traditionally evaluated during controlled lab experiments based on protocols from psychology that are vastly different from an actual interaction task, see, e.g., [13].
Overall description
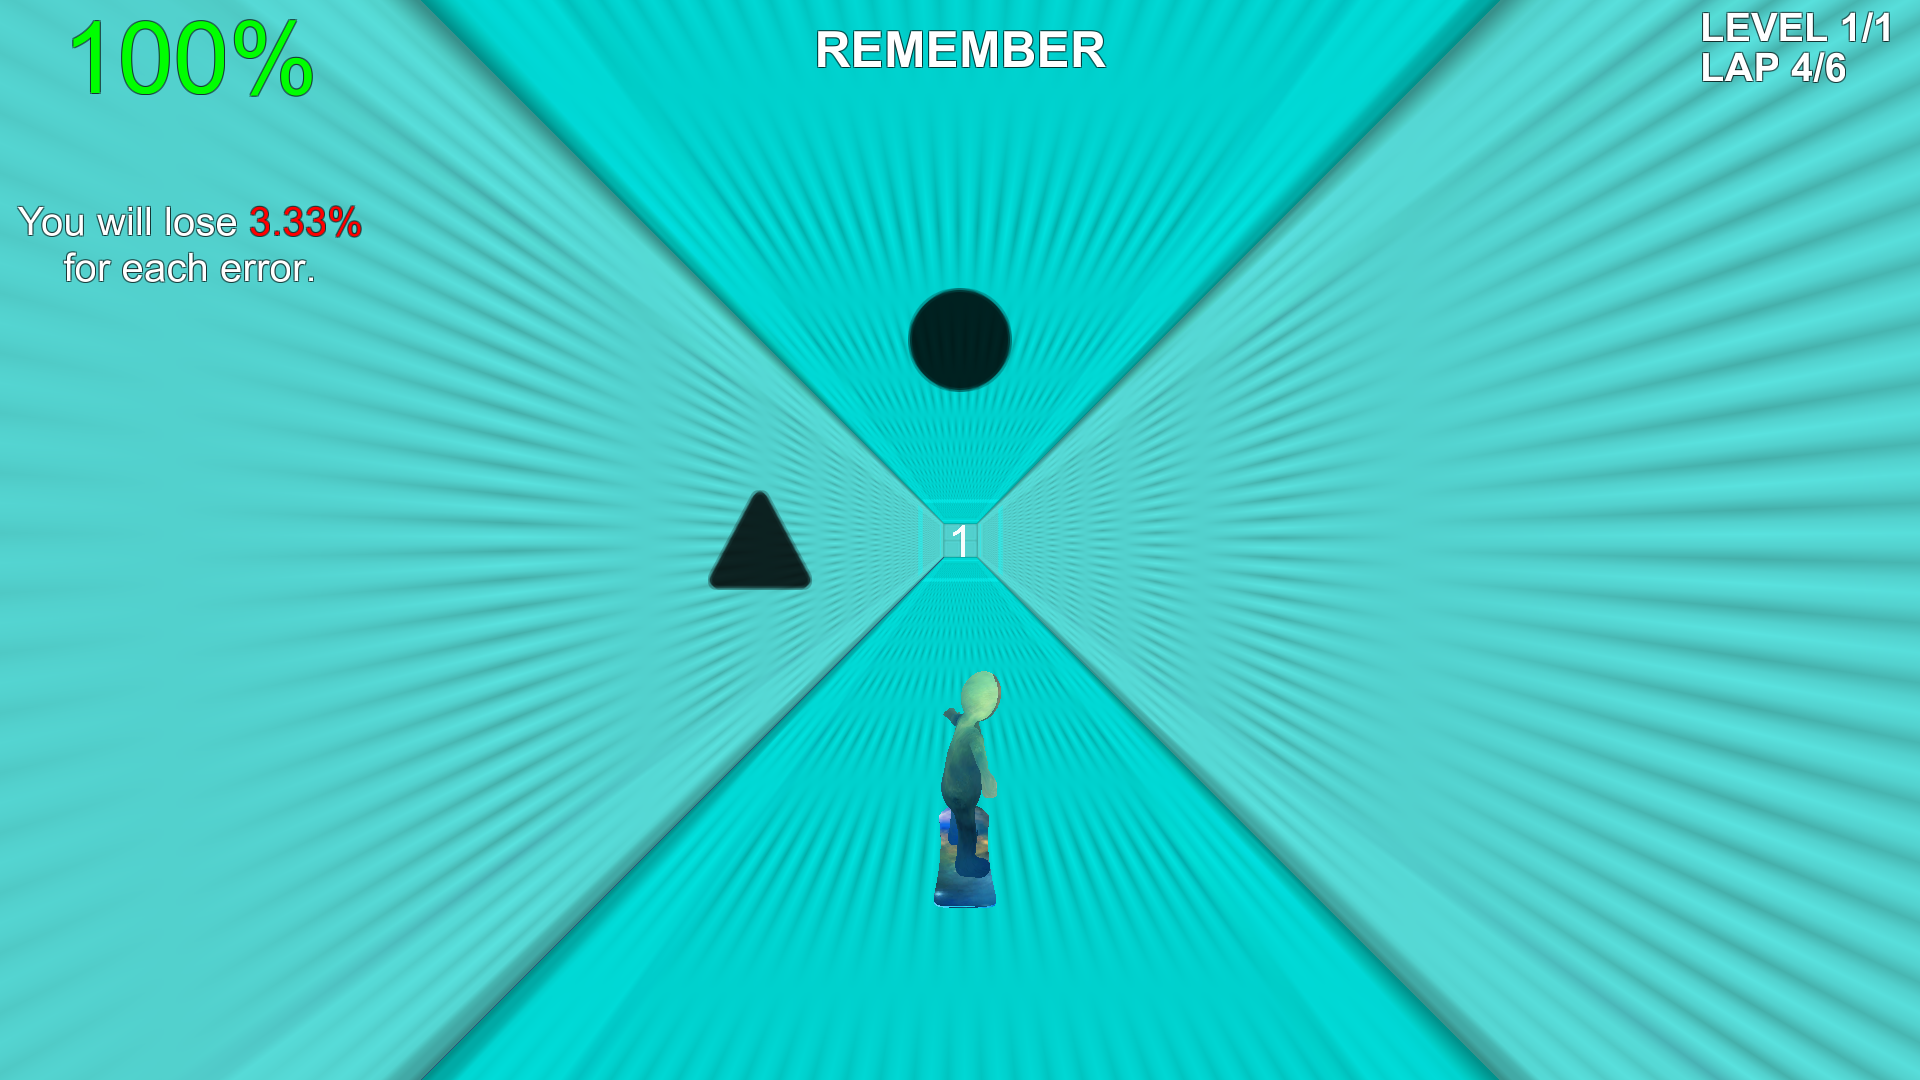
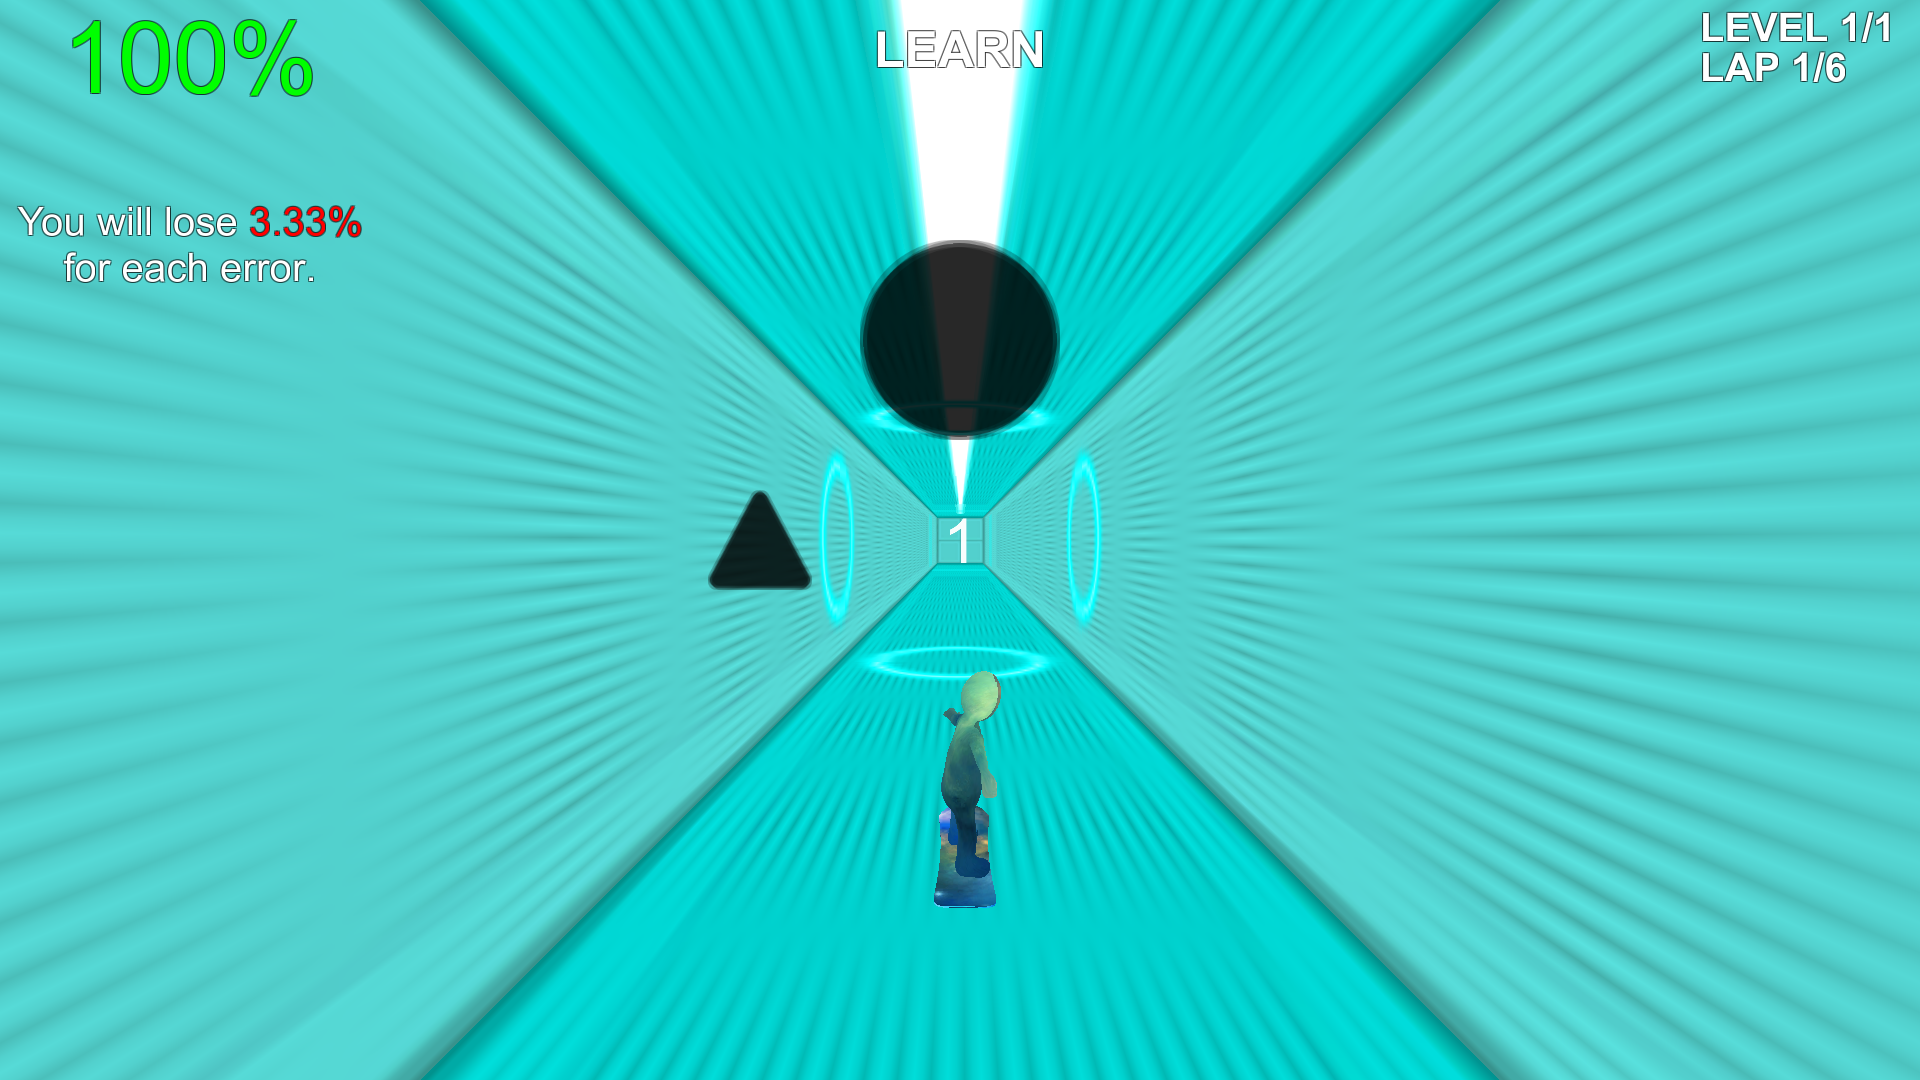
The virtual environment takes the form a maze where players have to learn and reproduce a path by triggering directions at regular intervals (see Figure 1). A character displayed with a third person perspective moves by itself at a predefined speed inside orthogonal tunnels. Soon after the character enters a new tunnel, symbols appear on-screen. Those symbols are basic 2D shapes, such as squares, circles, triangles, diamonds or stars, and their positions (bottom, top, left or right) indicate which directions are “opened”. Players must select one of these symbols before the character reaches the end of an intersection, either by pressing a key or touching the screen. If users respond too early, i.e., before symbols appeared, too late, or if they select a direction that does not exist, they loose points and the character “dies” by smashing against a wall, respawning soon after at the beginning of the current tunnel.
The main element of the gameplay consists in selecting the directions in the correct order. Indeed, one level comprised two phases. During the “learning” phase a particular sequence of symbols is highlighted; at each symbols’ appearance one of them is bouncing to indicate the correct direction. Another cue takes the form of a “breadcrumb trail”, a beam of light that precedes the character and points to the right direction (see Figure 1b). Selecting an available but incorrect direction does not result in the character’s “death” but leads to a loss of points. A visual feedback is given to users when they select a direction: the corresponding symbol turns green if the choice is correct and red otherwise. When the end of the maze is reached, the character loops over the entire path so that players have another opportunity to learn the sequence. When the training phase ends, the “recall” phase follows. The symbols are identical but the cues are no more displayed; players have to remember by themselves the right path. Symbols position in each tunnel and symbols sequence are randomly drawn when a new level starts.
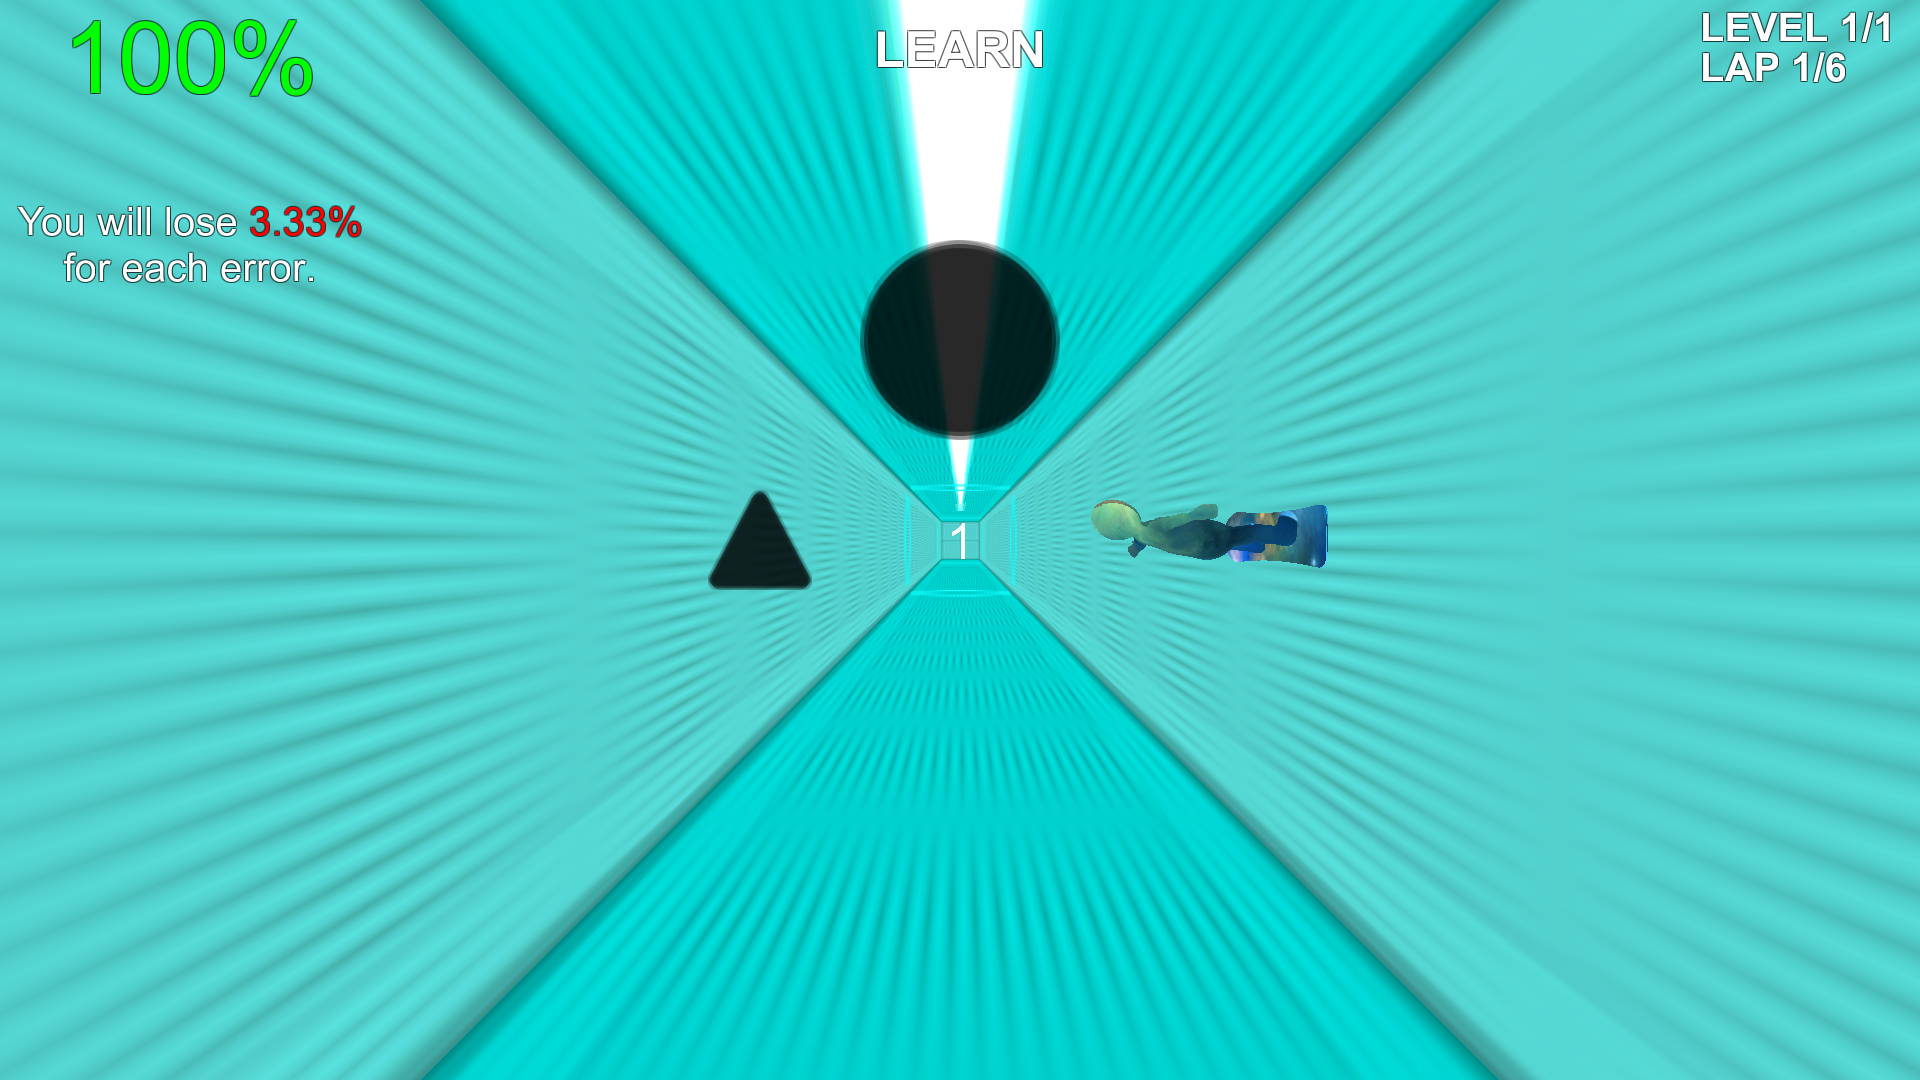
Beside learning a sequence, the principal challenge comes from how the directions are selected. The third-person view fulfills a purpose: the input device that users are controlling – i.e. keyboard or touch screen – is mapped to the character position. Since the character is a futuristic surfer that defies the law of gravity, it slides by itself from the bottom of the tunnel to one of the walls or to the ceiling from time to time. In this latter situation, when the character is upside down, commands are inverted compared to what players are used to, even though symbols remain in the same positions. This game mechanism stresses spatial cognition abilities; users have to constantly remain aware of two different frames of reference. For example, if “up” and “left” directions are open in a given tunnel and if the character’s position – controlled by the application – is on the right wall, as illustrated in Figure 1c, users have to press right to go up. This discrepancy between input and output is a reminder of the problematic often observed with 3D user interfaces, where most users manipulate a device with 2 degrees of freedom (DOF), such as a mouse, to interact with a 6 DOF environment.
The combination of the game design and game mechanisms herein described offers a wide variety of elements that we put in use so as to investigate users’ mental states. In particular, we detail below how we tuned the game elements to manipulate the user’s workload and attention in controlled ways as well as to trigger interaction errors. Knowing which constructs value (e.g. high or low workload) to expect, we can validate whether our EEG-based estimates during interaction match these expectations, and thus whether they are reliable.
Manipulating workload
Our virtual environment possesses several characteristics that could be used to induce different levels of mental workload. We can notably adjust 4 parameters:
- •
-
•
Number of directions: at each intersection, up to 4 directions are “opened” in the maze; the complexity of the symbols sequence grows as this number increases.
-
•
Game speed: the pace of the game can be adjusted to increase temporal pressure. When the speed increases symbols appear sooner and users must respond quicker, thus increasing overall stress [15, 20]. In the easiest level the character spends 6s in a tunnel and players must respond within 3s after symbols appearance; in the hardest level a tunnel lasts 2s and players have 1s to choose a symbol.
-
•
Spatial orientation: in order to keep selecting the correct directions, users have to perform a mental rotation if the character they control jumps from the floor to the walls or to the ceiling. Furthermore, they need to update their frame of reference as often as the character shifts from one side to another. Depending on the spatial ability of users, this mechanism can cause an important cognitive load [29].
We used those mechanisms and dimensions to create 4 different difficulty levels for the game: “EASY”, “MEDIUM”, “HARD” and “ULTRA” (see Table 1). These levels affect mostly (symbolic) memory load and time pressure. Indeed, the 3D maze is more about remembering a sequence of symbols or directions rather than spatial navigation per se. Because randomization could create loops in the maze topography and since there were no landmarks, it is unlikely that participants were able to adopt an allocentric strategy.
While the EASY level is designed to be completed with very little effort, the ULTRA level, on the other hand, is designed to sustain a very high level of workload, up to the point that it is barely possible to complete it with no error. While during EASY levels there is no need to perform mental rotations and players have to memorize only 2 symbols that are constrained to either left and right directions, in ULTRA levels the frame of reference changes between each selection and the sequence reaches 5 symbols that could appear in all 4 directions, and players have to react thrice as fast. No matter the level, players had 3 “loops” to learn the maze and another set of 3 loops to reproduce the path.
| Difficulty | Depth | Directions | Resp. time | Orientation |
|---|---|---|---|---|
| EASY | 2 | 2 | 3s | 0% |
| MEDIUM | 4 | 3 | 2.5s | 30% |
| HARD | 5 | 4 | 2s | 60% |
| ULTRA | 5 | 4 | 1s | 100% |
Assessing attention
We relied on stimuli not congruent to the main task in order to probe for inattentional blindness, using the “oddball” paradigm. The oddball paradigm is often employed with EEG as the appearance of rare (i.e. “odd”) stimuli among a stream of frequent stimuli (i.e. distractors) triggers a particular event-related potential (ERP) within EEG signals [6]. ERP are “peaks” and “valleys” in EEG recordings, and the amplitude of some of them decreases as users are less attentive to stimuli.
Our protocol uses audio stimuli. It is based on [4], which studied the immersion of video game players. In our virtual environment, while users’ characters were navigating in the maze, sounds were played at regular intervals, serving as a background “soundtrack” that was consistent with the user experience. 20% of these sounds had a high pitch (odd event) and the remaining 80% had a low pitch (distracting events) – this proportion is on par with the literature [4, 10].
Our hypothesis is that the attention level of participants toward sounds – as measured with the oddball paradigm – should decrease as the workload increase, since most of their cognitive resources will be allocated to the main task during the most demanding levels.
Assessing error recognition
EEG could be used to measure interaction errors, i.e. errors originating from an incorrect response of the user interface, that differs from what users were expecting [10]. Interaction errors are of particular interest for HCI evaluation since they could account for how intuitive an interface is [12]. In order to test the feasibility of such measure, we decided to implement two different interaction techniques. Both of them use discrete events – i.e. symbols’ selection – so that we could more easily synchronize EEG recordings with in-game events later on.
The first technique uses indirect interactions by the mean of a keyboard (Figure Framework for Electroencephalography-based Evaluation of User Experience, left). In due time, left, right, up or down arrow keys are used to send the character in the tunnel that is situated to its left, right, top or bottom. Indeed, we have seen previously that in our virtual environment players have to orientate themselves depending of the position of the character. If the character is moving on the sides, players have to perform a mental rotation of 90°, if it is on the ceiling then the angle is 180°, i.e. commands are inverted.
The second technique uses direct interaction by the mean of a touch screen (Figure Framework for Electroencephalography-based Evaluation of User Experience, middle). Usually, with touch screen, pointing is co-located with software events, since users can directly indicate where they want to interact. However, in our case, we decided to mimic exactly the behavior of the keyboard interface. That is to say that with the touch screen as well players have to orientate themselves depending on the position of the character. Hence, if the character is positioned on the left, players have to touch the right fringe of the screen in order to go up. This is mostly counter-intuitive since players have to inhibit the urge to point to the actual direction they want to go; there is a cognitive dissonance.
Since in our experimental design the use of the direct (touch-based) interaction is counter-intuitive, we hypothesize that it will lead to an overall higher number of interaction errors compared to the indirect interface (keyboard).
Pilot study: validation of the induced workload level
We designed our virtual environment as a test-bench aimed at inducing several mental states within users, notably, different workload levels. Thus, we had to formally validate the mental workload that each game level seeks to induce. As such, we conducted a pilot study – separate from the main study to alleviate the protocol of the latter –, with no physiological recordings but using the NASA-TLX questionnaire [15], a well established questionnaire that accounts for workload.
Protocol
15 participants took part in this study (4 females), mean age 24.53 (SD: 3.00). We used a within-subject design; all participants answered for all 4 difficulty levels. The gaming session used the keyboard and started with 2 “training levels”, that introduced participants to the game mechanisms. In the first training level, players learned the objective of the game. In the second training level, they discovered how the character could change its orientation by itself. After this training phase, participants continued with the main phase of the experiment.
During the main phase of the experiment, participants played once each of the four levels (EASY, MEDIUM, HARD or ULTRA), in a random order. Immediately after the end of a level, participants were given a NASA-TLX questionnaire to inquire about their mental workload. The questionnaire took the form of a 9-points Likert scale. As in the original questionnaire [15], it comprised 6 items, that assessed mental demand, physical demand, temporal demand, performance, effort and frustration. The experiment lasted approximately 25 minutes and finished once participants played all 4 levels and filled the corresponding NASA-TLX questionnaire.
Results
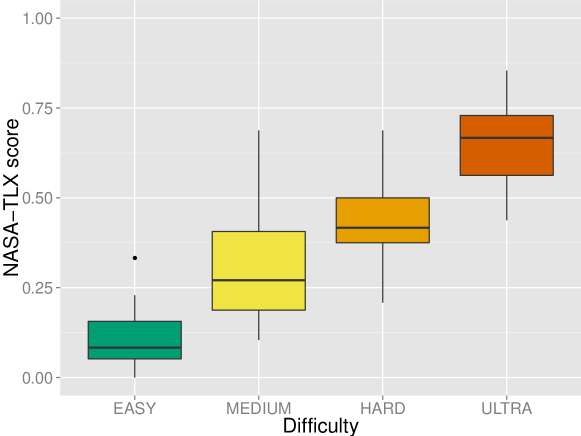
For each participant and each level of difficulty, we averaged the 6 items of the NASA-TLX questionnaire and normalized the scales from [1;9] to [0;1] – except for the “performance” item, that was normalized from [1;9] to [1;0] because its scale is in reverse order compared to the other items (“1” for “good” and “9” for “poor”).
The resulting averaged scores are: EASY: 0.11 (SD: 0.09); MEDIUM: 0.32 (SD: 0.17); HARD: 0.43 (SD: 0.13); ULTRA: 0.65 (SD: 0.13) – see Figure 2. A repeated measures analysis of variance (ANOVA) showed a significant effect of the difficulty factor over the NASA-TLX scores and a post-hoc pairwise Student’s t-test with false discovery rate (FDR) correction showed that each levels differed significantly from the others (p < 0.01).
Discussion
In this pilot study, we demonstrated through questionnaires that each difficulty level presented in Table 1 induces a different workload level. Hence, we can use our virtual environment as a baseline to assess the reliability of analogous EEG measures and put into perspective this new evaluation method.
EEG in practice
EEG measures the brain activity under the form of electrical currents [22]. To identify mental states from EEG, 3 types of information can be used:
-
•
Frequency domain: oscillations that occur when large groups of neurons fire altogether at a similar frequency
-
•
Temporal information: ERPs possess temporal features; positive and negative “peaks” with varying amplitudes and delays.
-
•
Spatial domain: position of the electrodes that record a specific brain activity.
However, there is an important variability between people’s EEG signals, and many external factors that could influence EEG recordings (amplifier’s specifications, electrodes exact location, and so on). As such, it is difficult to identify a universal set of features to estimate a given mental state, for different sessions and participants. This is why machine learning is typically used in EEG studies [3]. With this approach, a calibration phase occurs so that the system could learn which features are associated to a specific individual, during a task that is known to induce the studied construct. Once the calibration is completed, the machine could then use this knowledge to gain insights about an unknown context, for example a new interaction technique that one would want to evaluate.
To calibrate workload and attention, we chose to use standard calibration tasks, validated by the literature, so that our findings could be easily reproduced. Moreover, as shown later in this paper, using a single of these tasks to calibrate each construct estimator was enough to obtain reliable estimations of such constructs during different and complex interaction tasks.
Concerning attention, we did not develop a dedicated task per se for its calibration. Since the audio probes were already integrated to our virtual environment, we simply used a specific level of our game.
Calibration of workload
We used the protocol known as the N-back task to induce 2 different workload levels and calibrate our workload estimator. The N-back task is a well-known task to induce workload by playing on memory load [25]. It showed promising results in [36] where it could be used to transfer calibration results to a 3D context.
In the N-back task, users watch a sequence of letters on screen, the letters being displayed one by one. For each letter the user had to indicate whether the displayed letter was identical or different to the letter displayed N letters before, using a left or right mouse click respectively. Hence, users have to remember n items at all times.
We implemented a version similar to [13], removing vowels to prevent chunking strategies based on phonemes. We used the same time constraint as in [36], i.e. letters appeared for 0.5s, with an inter-stimulus interval of 1.5s. Each user alternated between “easy” blocks with the 0-back task (the user had to identify whether the current letter was a randomly chosen target letter, e.g. ‘X’) and “difficult” blocks with the 2-back task (the user had to identify whether the current letter was the same letter as the one displayed 2 letters before), see Figure 3.
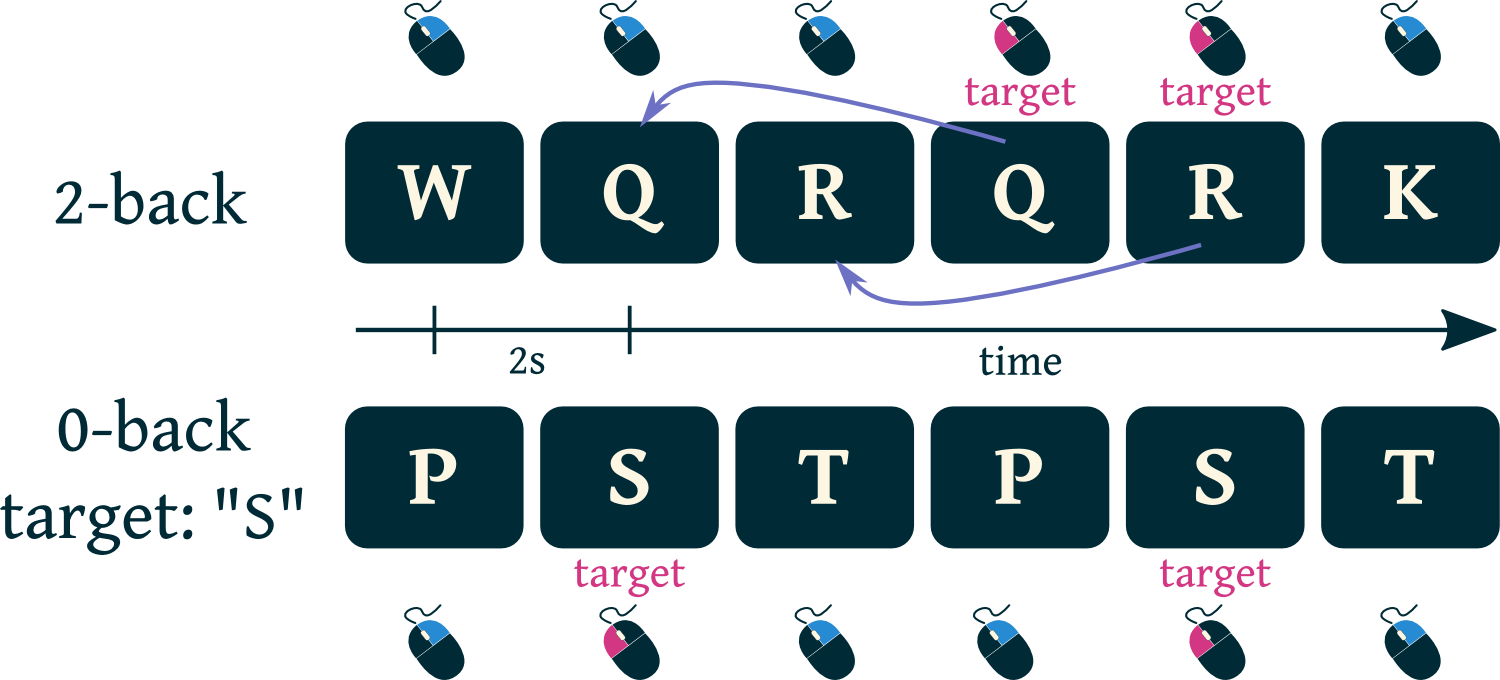
Each block contained 60 letters presentations. 4 letters were drawn at the beginning of a block so that the number of target letters accounted for 25% of the trials. Each participant completed 6 blocks, 3 blocks for each workload level (0-back vs 2-back). Therefore, 360 calibration trials (i.e. one trial being one letter presentation) were collected for each user, with 180 trials for each workload level (“low” vs “high”). This calibration phase takes approximately 12 minutes.
Calibration of error recognition
We replicated the standard protocol described in [10] to calibrate the system regarding error recognition. The task simulates a scenario in which users control the movements of a robot. The robot appears on screen and has to reach a target. At each turn users command the robot to go right or left in order to reach the target as fast as possible (with the least steps). However, the robot may understand badly the given command. This is simulated by some trials during which the command is (on purpose) erroneously interpreted; hence an interaction error happens. The ERP that can be seen in EEG following an interaction error is known as an “error related potential”, ErrP [10]. The calibration task is a simplified version of this scenario: the robot is pictured by a blue rectangle on screen that users control with the arrow keys, the target is represented by a blue outline. The robot is constrained to the X axis and along this axis there are only 7 different positions both for the robot and the target (see Figure 4).
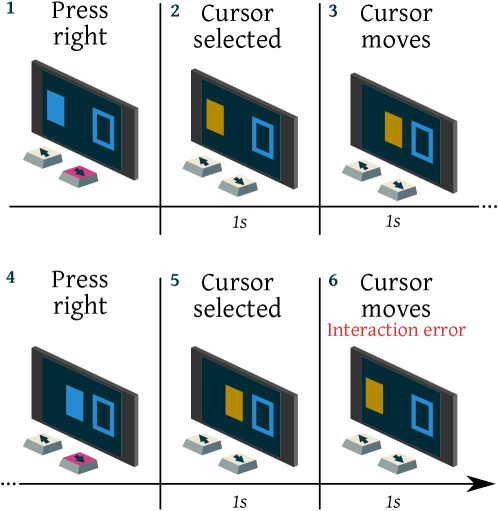
We choose a ratio for the occurrence of interaction errors that is consistent with the literature. 80% of the movements matched the actual key pressed and for the other 20% the “robot” moved in the opposite direction. It was necessary not to balance both events as too frequent errors may not be perceived as unexpected anymore, and thus may not lead to an ErrP. A timer was set to prevent the appearance of artifacts, such as muscle movements, within EEG recordings (see the Discussion section for further consideration for artifacts). The rectangle moves 1s after a key was pressed, and after movement completion users have to wait another 1s before they could press a key again. The rectangle turned yellow to tell users they could not control it during that second.
A trial is completed once the robot reaches the target. A trial fails if after 10 attempts the robot is not yet on target. At the beginning of each trial, the screen is reinitialized with a random new position for the robot and the target. The last trial occurred after 350 interactions were performed. On average this calibration phase lasted 15 minutes.
Calibration of attention
The calibration of attention occurred within a simplified version of the virtual environment. Users did not have to control the character during this special level, it was moving by itself through the maze. They were asked to watch the character and count in their head how many times they heard the “odd” sound, i.e., a high pitched bell lasting 200ms. The distractor was a low pitched beat of 70ms – we did not use pure tones to improve users experience. The pace of the game was adjusted so that a sound (target or distractor) was played every second. Since the probes for attention relies to the oddball paradigm, we chose a 20% likelihood of appearance for the target event. The calibration lasted about 7 minutes, after 350 sounds were played. Note that participants were instructed to count the “odd” events only during the calibration phase, and not during the completion of the 3D maze.
Main study: EEG as an evaluation method
The main study consisted in the evaluation of the game environment with two different types of interfaces using EEG recordings. As such we created a 4 (difficulty: EASY, MEDIUM, HARD, ULTRA) 2 (interaction: KEYBOARD vs TOUCH) within-subject experimental plan. Our hypotheses are:
-
1.
The workload index measured by EEG is higher in TOUCH and increases with the difficulty, reflecting NASA-TLX scores obtained during the pilot study.
-
2.
The attentional resources that participants assign to the sounds decrease as the difficulty increases.
-
3.
The TOUCH condition induces a higher number of interaction errors compared to the KEYBOARD condition.
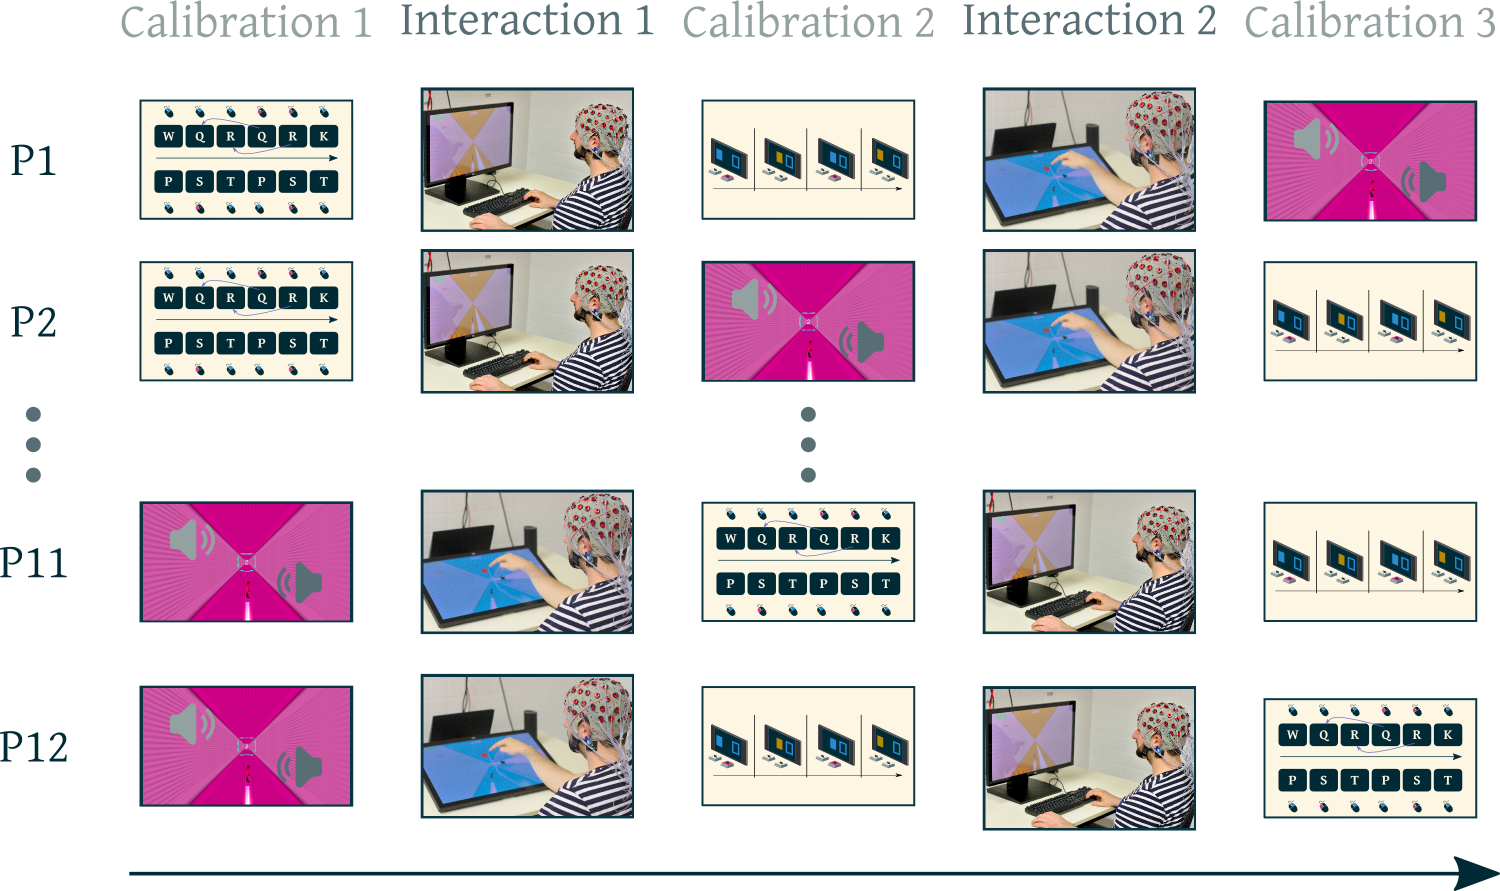
The gaming phase was split into two sequences, one for each interaction technique. To avoid a too tedious experiment, participants alternated between game sessions and the 3 calibration tasks (workload, attention and error recognition). Since the analysis were performed offline, there was no need to cluster all the calibrations at the beginning of the experiment.
The order of the gaming sessions and calibration phases was counter-balanced between participants following a latin square (see Figure 5). After the experiment, the signals gathered from the calibration tasks were processed in order to evaluate both the virtual environment (difficulty levels) and the chosen interaction techniques.
Apparatus
EEG signals were acquired at 512Hz with 2 g.tec g.USBamp amplifiers. We used 32 electrodes placed at the AF3, AFz, AF4, F7, F3, Fz, F4, F8, FC3, FCz, FC4, C5, C3, C1, Cz, C2, C4, C6, CP3, CPz, CP4, P7, P3, Pz, P4, P8, PO7, POz, PO8, O1, Oz and O2 sites.
12 participants took part in this study (3 females), mean age 26.25 (SD: 3.70). All of them reported a daily use of tactile interfaces. The experiment occurred in a quiet environment, isolated from the outside. There were two experimenters in the room and the procedure comprised the following steps:
-
1.
Participants entered the room, read and signed an informed consent form and filled a demographic questionnaire.
-
2.
While one of the experimenter installed an EEG cap onto participants’ heads, the other experimenter introduced participants to the virtual environment. They played 2 training levels and the 4 main levels in an increasing order of difficulty. They could redo some levels if they did not feel confident enough.
-
3.
One of the 3 calibration tasks occurred (workload, attention or error recognition).
-
4.
Participants played the game using one of the 2 interaction techniques (KEYBOARD or TOUCH). The four levels of difficulty (EASY, MEDIUM, HARD, ULTRA) appeared twice during the session, in a random order. For TOUCH, a dedicated training session occurred beforehand so that participant could get used to this interaction technique.
-
5.
Another calibration task occurred, different from step 3.
-
6.
Participants tested the second interaction technique. As in step 4, TOUCH was preceded by a training session, that lasted until participants felt confident enough to proceed to the main task.
-
7.
Participants performed the last remaining calibration task.
A game session (steps 4 and 6) took approximately 20 minutes and the whole experiment lasted 2 hours.
EEG Analyses
The calibration tasks were used to train a classifier specific to each of the studied construct. Classifiers were calibrated separately for each participant which ensured maximal EEG classification performances. We used EEGLAB 13.4.4b222http://sccn.ucsd.edu/eeglab/ and Matlab R2014a to process EEG signals offline. EEG features associated to workload relate to the frequency domain while the features associated to attention and error recognition relate to temporal information, as detailed below.
Processing workload
From the signals collected during the N-back tasks, we extracted EEG features from each 2s time window following a letter presentation. We used each of these time windows as an example to calibrate our classifier, whose objective was to learn whether these features represented a low workload level (induced by the 0-back task) or a high workload level (induced by the 2-back task). Once calibrated, this classifier can be used to estimate workload levels on new data, here while our users were interacting with the virtual environment.
As in [36], we filtered EEG signals in the delta (1-3 Hz), theta (4-6 Hz), alpha (7-13 Hz), beta (14-25 Hz) and gamma (26-40 Hz) bands. To reduce features dimensionality, we used for each band a set of Common Spatial Patterns (CSP) spatial filters. That way, we reduced the 32 original channels down to 6 “virtual” channels that maximize the differences between the two workload levels [31]. Since the calibration (N-back task) and use contexts (virtual environment) differs substantially, we used a regularized version of these filters called stationary subspace CSP (SSCSP) [36]. SSCSP filters are more robust to changes between contexts since they take into account the distributions of the EEG signals recorded during both the calibration and the use contexts (in an unsupervised way, i.e. without considering the expected workload levels) to estimate spatial filters whose resulting signals are stable across contexts (see [36] for details). Finally, for each frequency band and spatial filter, we used the average band power of the filtered EEG signals as feature. This resulted in 30 EEG features (5 bands 6 spatial filters per band).
Processing attention and error recognition
Since both attention and error recognition can be measured in ERPs, they share the same signal processing. We selected time windows of 1s, starting at the event of interest (i.e. sounds for attention, rectangle’s movements for error recognition). In order to utilize temporal information, feature extraction relied on regularized Eigen Fisher spatial filters (REFSF) method [17]. Thanks to this spatial filter, specifically designed for ERPs classification, the 32 EEG channels were reduced to a set of 5 channels. We then decimated the signal by a factor 32. The “decimate” function of Matlab, that applies a low-pass filter before decimation to prevent aliasing, was used. As a result, there was 80 features by epoch (5 channels 512Hz 1s / 32).
Classification
We used a shrinkage LDA (linear discriminant analysis) as a classifier since it is more efficient than the regular LDA with a high number of features [19].
For each construct there was two steps: first we used the data collected during the calibration tasks to estimate the performance of the classifiers. Second, we studied the output of the different classifiers to evaluate the virtual environment.
To assess the classifiers’ performance on the calibration data, we used 4-fold cross-validation (CV). More precisely, we split the collected data into 4 parts of equal size, selecting trials randomly, used 3 parts to calibrate the classifiers and tested the resulting classifiers on the unseen data from the remaining part. This process occurred 3 more times so that in the end, each part was used once as test data. Finally, we averaged the obtained classification performances. The performance was measured using the area under the receiver-operating characteristic curve (AUROCC). The AUROCC is a metric that is robust against unbalanced classes, as it is the case with attention and error recognition (20% of targets, 80% of distractors). A score of “1” means a perfect classification, a score of “0.5” is chance.
Once the classifiers were trained thanks to the calibrations tasks, we could use them on the EEG signals acquired while participants were interacting with the virtual environment, to estimate the different constructs values.
For workload, we used 2s long sliding time windows that were overlapping by 1s, to extract signals and feed the classifier. From the outputs that was produced by the LDA classifier for each participant (i.e., the distance to the separating hyperplane), we first removed outliers by iteratively removing one outlier at a time using a Grubb’s test with , until no more outlier was detected [14]. We then normalized the outlier-free scores between -1 and +1. As such, for all participants a workload index close to +1 represents the highest mental workload they had to endure while they were playing. It should come close to the 2-back condition of the calibration phase. On the opposite, a workload index close to -1 denotes the lowest workload, similar to the 0-back condition.
The process was similar for attention, but we only extracted epochs that corresponded to the target stimuli onset, i.e. when the high pitch sound was played. Note that contrary to [4], that studied the amplitudes of ERPs and did not use the data gathered during the calibration phase, here we kept the machine learning approach. As such, the resulting scores can be seen as a confidence index of the LDA classifier about whether participants noticed odd events while they were playing.
As for the classifier dedicated to error recognition, the processing differs. Indeed, we could not assume which interaction yielded or not an interaction error, i.e. if and when participants perceived a discrepancy between what they intended to do and what occurred. Consequently, we simply counted over an entire game session the number of times the classifier labelled an interaction as being erroneous in the eye of the participants.
Results
Unless otherwise noted, we tested for significance using repeated measures ANOVA. For significant main effects, we used post-hoc pairwise Student’s t-test with FDR correction.
| Construct | P1 | P2 | P3 | P4 | P5 | P6 | P7 | P8 | P9 | P10 | P11 | P12 | Average |
|---|---|---|---|---|---|---|---|---|---|---|---|---|---|
| Workload | 0.85 | 0.93 | 0.98 | 0.95 | 0.97 | 0.97 | 0.79 | 0.87 | 0.87 | 0.98 | 0.95 | 0.94 | 0.92 |
| Attention | 0.83 | 0.82 | 0.96 | 0.81 | 0.85 | 0.90 | 0.82 | 0.82 | 0.86 | 0.92 | 0.88 | 0.83 | 0.86 |
| Error recognition | 0.88 | 0.57 | 0.90 | 0.90 | 0.86 | 0.90 | 0.78 | 0.80 | 0.88 | 0.78 | 0.85 | 0.74 | 0.82 |
Workload
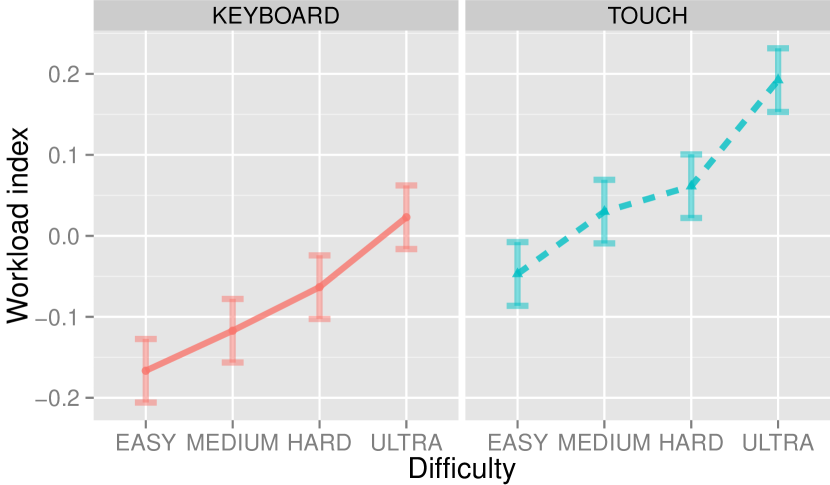
On average, the classifier AUROCC score during the training task was 0.92 (SD: 0.06) – see Table 2. Over the test set there were on average 2171 data points per subject across all condition (time windows). The statistical analysis of the classifier output during the game session showed a significant effect of the difficulty factor (p < 0.01); the workload index increasing along the difficulty of the levels (Figure 6a). The post-hoc analysis showed that all difficulty levels significantly differs one from the other with p < 0.01; except for the MEDIUM level, which differs from EASY with p < 0.05 and with HARD only by a margin (p = 0.11). There was a significant effect of the interaction factor as well (p < 0.01), the workload being higher on average during the TOUCH condition. There was no interaction between difficulty and interaction factors.
Attention
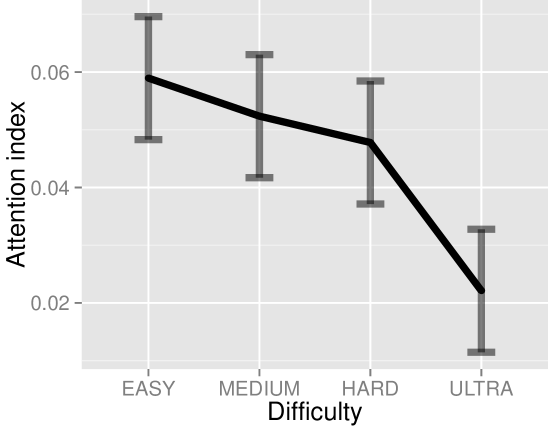
On average, the classifier AUROCC score during the training task was 0.86 (SD: 0.05) – see Table 2. Over the test set there were on average 497 data points per subject across all conditions (odd events). The statistical analysis of the classifier output during the game session showed a significant effect of the difficulty factor (p < 0.01) but not of the interaction factor. The attention index decreases as the difficulty increases (Figure 6b). The post-hoc analysis showed that the ULTRA level significantly differs from the others (p < 0.05).
Error recognition
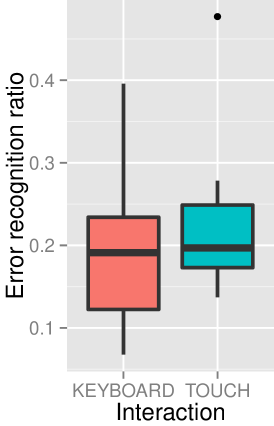
On average, the classifier AUROCC score during the training task was 0.82 (SD: 0.10) – see Table 2. Over the test set there were on average 388 data points per subject across all conditions (interactions). Due to the nature of the data (numbers of interaction errors across entire game sessions), we used a one-tailed Wilcoxon Signed Rank Test to stress our hypothesis. The number of interaction errors differs by a tendency (p = 0.08) between the KEYBOARD and the TOUCH conditions. 19% of the interactions (SD: 9%) were labelled as interaction errors by the classifier for KEYBOARD vs 22% (SD: 9%) for TOUCH (Figure 6c).
Behavioral measures
Besides EEG metrics, we had the opportunity to study participants’ reaction time and performance so as to get a clearer picture of their user experience.

Reaction time
There was a significant effect of both the difficulty and interaction factors, as well as an interaction effect between them (p < 0.01). Post-hoc tests showed that all difficulty levels differ from one another (p < 0.01), except for MEDIUM and HARD, which do not differ significantly (p = 0.91). The mean reaction times were respectively for EASY, MEDIUM, HARD and ULTRA: 0.78s (SD: 0.14), 0.97s (0.18), 0.98s (0.15) and 0.69s (0.06). The mean reaction time was 0.78 (0.12) for KEYBOARD and 0.93 (0.13) for TOUCH. See Figure 7a. Note that users had less time to respond during higher difficulty levels.
Performance
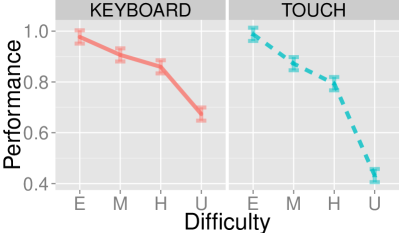
The performance was computed as the ratio between the number of correct selections and the total number of interactions. There was a significant effect of both the difficulty and interaction factors, as well as an interaction effect between them (p < 0.01). Post-hoc tests showed that all difficulty levels differ from one another (p < 0.01). The mean performance was respectively for EASY, MEDIUM, HARD and ULTRA: 98% (SD: 3), 89% (12), 83% (17) and 55% (21). The Mean performance was 85% (13) for KEYBOARD and 77% (13) for TOUCH. See Figure 7b.
Discussion
Most of the main hypotheses are verified. The workload index as computed with EEG showed significant differences that match the intended design of the difficulty levels. It was also shown that in the highest difficulty the attention level of participants toward external stimuli was significantly lower – i.e. inattentional blindness increased. Concerning the interaction techniques, the number of interaction errors as measured by EEG was higher with the TOUCH condition, but this is a tendency and not a significant effect. The workload index, on the other hand, was significantly higher in the TOUCH condition compared to the KEYBOARD condition.
Thanks to the ground truth obtained during the pilot study with the NASA-TLX questionnaire, these results validate the use of a workload index measured by EEG for HCI evaluation and set the path for two other constructs: attention and error recognition. Beside the evaluation of the content (i.e. difficulty levels) we were able to compare two interaction techniques. These are promising results for those who seek to assess how intuitive a UI is with exocentric measures [12].
In this study, we chose to use the particularity of the touch screen to make the task more difficult. Indeed, while we used a touch screen for its possibility of direct manipulation, we kept the character as a frame of reference, resulting in input commands that were (patently) not co-localized with output directions. Besides results denoting the differences between the conditions, participants also spontaneously reported how non intuitive this condition was. We wanted to investigate our evaluation method on a salient difference at first. Then our framework could well be employed to go further; for example seeking physiological differences between direct and indirect manipulation interfaces in more traditional tasks.
It is interesting to note how those EEG measures could be combined with existing methods to broaden the overall comprehension of the user experience. For instance, while we did show significant differences across difficulty levels and between interaction techniques with behavioral measures (reaction time and performance index), EEG measures could help to understand the underlying mechanisms. Because we have a more direct access to brain activity, we can make assumptions about the cause of observed behaviors. For example participants’ worse performance with TOUCH than with KEYBOARD could be due to the fact that they anticipate less the outcomes of their actions (more interaction errors); the higher reaction time may not only be caused by the interaction technique per se, but by a higher workload. And while participants manage to cope with the fast pace of the ULTRA level (the smallest reaction times), the increase in perceptual load lower their awareness to task-irrelevant stimuli.
Additionally, we can observe that the performances obtained at the EASY, MEDIUM and HARD levels are very similar with the keyboard and the touch screen (see Figure 7b). However, EEG analyses revealed that the workload was significantly higher in the TOUCH condition, meaning that users had to allocate significantly more cognitive resources to reach the same performance. This further highlights that EEG-based measures do bring additional information that can complement traditional evaluations such a behavioral measures.
Measuring users’ cognitive processes such as workload and attention may prove particularly useful to assess 3D user interfaces (3DUI), since they are known to be more cognitively demanding. They require users to perform 3D mental rotation tasks to successfully manipulate objects or to orientate themselves in the 3D environment. Moreover, the usual need for a mapping between the user inputs (with limited degrees-of-freedom – e.g., only 2 for a mouse) and the corresponding actions on 3D objects (with typically 6 degrees-of-freedom), makes 3DUI usually difficult to assess and design. We reproduced part of this problematic with our game environment and obtained coherent results from EEG measures.
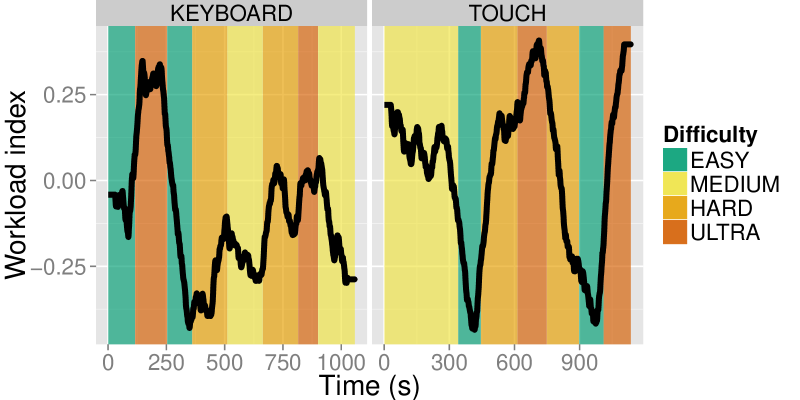
Above all, an evaluation method based on EEG enables a continuous monitoring of users. The intended use case of our framework is to enroll dedicated testers that would wear the EEG equipment and perform well during the calibration tasks. As a matter of fact, the best performer during workload calibration (participant 3 in Table 2) shows patterns that clearly meet the expectations concerning both difficulty levels and interactions, as pictured in Figure 8.
Limitations and future challenges
Although using EEG measures as an evaluation method for HCI was proven conclusive regarding workload – we obtained a continuous index on par with a ground truth based on traditional questionnaires – the two other constructs we studied could benefit from further improvements.
Despite the direct interaction (TOUCH) being more disorienting for users than the indirect one (KEYBOARD), the recognition of interaction errors differed only by a tendency. This could be explained by the fact that the calibration task was too dissimilar to the virtual environment. Notably, while there was few and slow paced events during the calibration, users were confronted to many stimuli while they were playing, hence overlapping ERPs must have appeared within EEG, which may have disturbed the classifier. A calibration task closer to real-life scenarios than the one described in [10] should be envisioned. Such task should remain generic in order to facilitate the dissemination of EEG as an evaluation method for HCI.
Signal processing could also facilitate the transfer of the classification between a standard task and the evaluated HCI. Indeed, if our results demonstrate that the EEG classification of workload could be transferred from the N-back tasks to a dissimilar virtual environment and user interface, we benefited from spatial filters that specifically take into account the variance between calibration contexts and use contexts – the stationary subspace CSP [36]. Since ERPs may also slightly differ in amplitudes and delays between calibration and use contexts, in the future, it would be worth designing similar approaches to optimize temporal or spatial filters for ERPs as well.
The reliability of mental states measures is strongly correlated to the quality of EEG signals. Interestingly enough, participants’ mindset during the recordings is one of the factors influencing EEG signals. Their awareness and involvement toward the tasks improve system accuracy. The form of the calibration tasks could be enhanced to engage more users, for example through gamification [11] – and our virtual environment proved to be suitable to do so. Whereas our participants were volunteers enrolled among students, in the end the outcome of an evaluation method based on EEG should be strengthened by recruiting dedicated testers, using as selection criteria how reliably the different constructs could be estimated from their EEG signals during calibration tasks.
Finally, one should acknowledge that when it comes to recordings as sensitive as EEG, artifacts such as the ones induced by muscular activity are of major concern. The way we prevented the appearance of such bias in the present study is threefold. 1) The hardware we used – active electrodes with Ag/AgCl coating – is robust to cable movements, see e.g., [35]. 2) The classifiers were trained on features not related to motion artifacts or motor cortex activation. 3) The position of the screen during the “touch” condition minimized participants’ motion, and gestures occurred mostly before the time window used for detecting interaction errors. These precautions are important for the technology to be correctly apprehended.
To further control for any bias in our protocol, we ran a batch of simulations where the labels of the calibration tasks had been randomly shuffled, similarly to the verification process described in [36]. Should artifacts bias our classifiers, differences would have appeared between the KEYBOARD and TOUCH conditions even with such random training. Among the 20 simulations that ran for each of the 3 constructs (workload, attention, error recognition), none yielded significant differences.
Conclusion
In this paper, we demonstrated how brain signals – recorded by means of electroencephalography – could be put into practice in order to obtain a continuous evaluation of different interaction techniques, for assessing their ergonomic pros and cons. In particular, we validated an EEG-based workload estimator that does not necessitate to modify the existing software. Furthermore, we showed how users’ attention level could be evaluated using background stimuli, such as sounds. Finally, we investigated how the recognition of interaction errors could help to determine the best user interface.
Being able to estimate these three constructs – workload, attention and error recognition – continuously during realistic and complex interaction tasks opened new possibilities. Notably, it enabled us to obtain additional and more objective metrics of user experience, based on the users’ cognitive processes. It also provided us with additional insights that traditional measures (e.g., behavioral measures) could not reveal. To sum up, this suggests that combined with existing evaluation methods, EEG-based evaluation tools such as the ones proposed here can help to understand better the overall user experience. We hope that the increasing availability of EEG devices will foster such approaches and benefit the HCI field.
References
- [1]
- [2] Chris Berka and DJ Levendowski. 2007. EEG correlates of task engagement and mental workload in vigilance, learning, and memory tasks. Aviat Space Environ Med. 78, 5 Suppl (May 2007), B231–44.
- [3] Benjamin Blankertz, Michael Tangermann, Carmen Vidaurre, Siamac Fazli, Claudia Sannelli, Stefan Haufe, Cecilia Maeder, Lenny Ramsey, Irene Sturm, Gabriel Curio, and Klaus-Robert Müller. 2010. The Berlin Brain-Computer Interface: Non-Medical Uses of BCI Technology. Front Neurosci 4 (Jan. 2010), 198.
- [4] Christopher G. Burns and Stephen H. Fairclough. 2015. Use of auditory event-related potentials to measure immersion during a computer game. International Journal of Human-Computer Studies 73 (2015), 107–114.
- [5] Ula Cartwright-Finch and Nilli Lavie. 2007. The role of perceptual load in inattentional blindness. Cognition 102, 3 (2007), 321–340.
- [6] J T Coull. 1998. Neural correlates of attention and arousal: insights from electrophysiology, functional neuroimaging and psychopharmacology. Progress in neurobiology 55, 4 (July 1998), 343–61.
- [7] Edward Cutrell and Desney Tan. 2008. BCI for passive input in HCI. CHI ’08 Workshops (2008), 1–3.
- [8] Sebastian Deterding, Dan Dixon, Rilla Khaled, and Lennart Nacke. 2011. From game design elements to gamefulness. In MindTrek ’11. 9.
- [9] Stephen H. Fairclough. 2009. Fundamentals of physiological computing. Interacting with Comp. 21, 1-2 (Jan. 2009), 133–145.
- [10] Pierre W Ferrez and José Del R Millan. 2008. Error-related EEG potentials generated during simulated brain-computer interaction. IEEE Trans. Biomed. Eng. 55, 3 (March 2008), 923–9.
- [11] David R. Flatla, Carl Gutwin, Lennart E. Nacke, Scott Bateman, and Regan L. Mandryk. 2011. Calibration games: making calibration tasks enjoyable by adding motivating game elements. UIST ’11 (2011), 403–412.
- [12] Jérémy Frey, Christian Mühl, Fabien Lotte, and Martin Hachet. 2014. Review of the use of electroencephalography as an evaluation method for human-computer interaction. In PhyCS ’14.
- [13] David Grimes, DS Tan, and SE Hudson. 2008. Feasibility and pragmatics of classifying working memory load with an electroencephalograph. CHI ’08 (2008), 835.
- [14] F.E. Grubbs. 1969. Procedures for Detecting Outlying Observations in Samples. Technometrics 11, 1 (1969), 1–21.
- [15] SG Hart and LE Staveland. 1988. Development of NASA-TLX (Task Load Index): Results of empirical and theoretical research. In Human mental workload.
- [16] Leanne M. Hirshfield, Erin Treacy Solovey, Audrey Girouard, James Kebinger, Robert J.K. Jacob, Angelo Sassaroli, and Sergio Fantini. 2009. Brain measurement for usability testing and adaptive interfaces. In CHI ’09. ACM Press, New York, New York, USA, 2185.
- [17] Ulrich Hoffmann, JM Vesin, and Touradj Ebrahimi. 2006. Spatial filters for the classification of event-related potentials. In ESANN ’06.
- [18] J. Matias Kivikangas, Inger Ekman, Guillaume Chanel, Simo Järvelä, Ben Cowley, Pentti Henttonen, and Niklas Ravaja. 2010. Review on psychophysiological methods in game research. Proc. of 1st Nordic DiGRA (2010).
- [19] Olivier Ledoit and Michael Wolf. 2004. A well-conditioned estimator for large-dimensional covariance matrices. J Multivar Anal (Feb. 2004).
- [20] A.John Maule and Anne C Edland. 1997. The effects of time pressure on human judgment and decision making. In Decision making: Cognitive models and Explanations.
- [21] Ranjana K Mehta and Raja Parasuraman. 2013. Neuroergonomics: a review of applications to physical and cognitive work. Frontiers in human neuroscience 7, December (Jan. 2013), 889.
- [22] Ernst Niedermeyer and FH Lopes da Silva. 2005. Electroencephalography: basic principles, clinical applications, and related fields. LWW.
- [23] S Nieuwenhuis, K R Ridderinkhof, J Blom, G P Band, and A Kok. 2001. Error-related brain potentials are differentially related to awareness of response errors: evidence from an antisaccade task. Psychophysiology 38, 5 (Sept. 2001), 752–60.
- [24] Richard E. Nisbett and Timothy DeCamp Wilson. 1977. Telling more than we can know: Verbal reports on mental processes. Psychological Review 84, 3 (1977), 231–260.
- [25] Adrian M. Owen, Kathryn M. McMillan, Angela R. Laird, and Ed Bullmore. 2005. N-back working memory paradigm: A meta-analysis of normative functional neuroimaging studies. Human Brain Mapping 25, 1 (2005), 46–59.
- [26] Evan M M. Peck, Beste F. Yuksel, Alvitta Ottley, Robert J.K. Jacob, and Remco Chang. 2013. Using fNIRS brain sensing to evaluate information visualization interfaces. CHI ’13 (2013), 473.
- [27] Rosalind W. Picard. 1995. Affective computing. Technical Report 321. MIT Media Laboratory.
- [28] Matthew Pike, ML Wilson, Anna Divoli, and Alyona Medelyan. 2012. CUES: Cognitive Usability Evaluation System. EuroHCIR ’12 (2012), 1–4.
- [29] G. Michael Poor, Guy Zimmerman, Dale S. Klopfer, Samuel D. Jaffee, Laura Marie Leventhal, and Julie Barnes. 2013. Mobility Matters: Identifying Cognitive Demands That Are Sensitive to Orientation. In Interact ’13, Vol. 8117 LNCS. 193–210.
- [30] Felix Putze, Christoph Amma, and Tanja Schultz. 2015. Design and Evaluation of a Self-Correcting Gesture Interface based on Error Potentials from EEG. In Proceedings of the 33rd Annual ACM Conference on Human Factors in Computing Systems. ACM, 3375–3384.
- [31] Herbert Ramoser, Johannes Müller-Gerking, and Gert Pfurtscheller. 2000. Optimal spatial filtering of single trial EEG during imagined hand movement. IEEE Trans Rehabil Eng 8, 4 (2000), 441–446.
- [32] S Sternberg. 1966. High-speed scanning in human memory. Science (New York, N.Y.) 153 (1966), 652–654.
- [33] Romain Trachel, Thomas Brochier, and Maureen Clerc. 2013. Enhancing visuospatial attention performance with brain-computer interfaces. CHI ’13 (2013), 1245.
- [34] Chi Vi and Sriram Subramanian. 2012. Detecting error-related negativity for interaction design. CHI ’12 (2012), 493.
- [35] J.A. Wilson, C. Guger, and G. Schalk. 2012. BCI hardware and software. In Brain-computer interfaces: principles and practice. 165–188.
- [36] Dennis Wobrock, Jérémy Frey, Delphine Graef, Jean-Baptiste de la Rivière, Julien Castet, and Fabien Lotte. 2015. Continuous Mental Effort Evaluation during 3D Object Manipulation Tasks based on Brain and Physiological Signals. In INTERACT ’15.