The Relation between Galaxy Structure and Spectral Type:
Implications for the Buildup of the Quiescent Galaxy Population at
Abstract
We present the relation between galaxy structure and spectral type, using a -selected galaxy sample at . Based on similarities between the UV-to-NIR spectral energy distributions, we classify galaxies into 32 spectral types. The different types span a wide range in evolutionary phases, and thus – in combination with available CANDELS/F160W imaging – are ideal to study the structural evolution of galaxies. Effective radii () and Sérsic parameters () have been measured for 572 individual galaxies, and for each type, we determine at fixed stellar mass by correcting for the mass-size relation. We use the rest-frame vs. diagram to investigate evolutionary trends. When moving into the direction perpendicular to the star-forming sequence, in which we see the H equivalent width and the specific star formation rate (sSFR) decrease, we find a decrease in and an increase in . On the quiescent sequence we find an opposite trend, with older redder galaxies being larger. When splitting the sample into redshift bins, we find that young post-starburst galaxies are most prevalent at and significantly smaller than all other galaxy types at the same redshift. This result suggests that the suppression of star formation may be associated with significant structural evolution at . At , galaxy types with intermediate sSFRs () do not have post-starburst SED shapes. These galaxies have similar sizes as older quiescent galaxies, implying that they can passively evolve onto the quiescent sequence, without increasing the average size of the quiescent galaxy population.
Subject headings:
galaxies: evolution — galaxies: structure1. INTRODUCTION
One of the most remarkable recent discoveries in extragalactic astronomy is the finding that galaxies were more compact and denser at earlier times (e.g., Williams et al., 2010; van der Wel et al., 2014). This effect is largest for quiescent galaxies, with a factor of 4-5 difference in size between similar-mass galaxies at and (e.g., Daddi et al., 2005; van Dokkum et al., 2008). This result poses a great challenge, as quiescent galaxies are presumably done forming new stars. Two popular competing theories explaining the size difference between the distant compact galaxies and the much larger present-day early-type galaxies are inside-out growth by minor mergers (e.g., Naab et al., 2009; Bezanson et al., 2009; Hopkins et al., 2009), and quenching of larger star-forming galaxies at later time (e.g., Carollo et al., 2013).
Yet another puzzling aspect of the population of compact quiescent galaxies is the nature of their star-forming progenitors. Theoretical studies predicting the evolutionary tracks of individual galaxies propose various mechanisms to form compact spheroids, ranging from gradual shrinking due to violent disk instabilities associated with intense gas in-streaming and wet minor mergers (e.g., Dekel & Burkert, 2014; Ceverino et al., 2015), centrally-concentrated starbursts triggered by gas-rich major mergers (e.g., Hopkins et al., 2008; Wellons et al., 2015), or early assembly in a much denser universe (e.g., Naab et al., 2009; Wellons et al., 2015). All of these processes predict different properties for the direct progenitors of compact quiescent galaxies, and thus it is not evident how they can be identified in observational studies (e.g., Barro et al., 2014; Nelson et al., 2014; Williams et al., 2014; van Dokkum et al., 2015).
To constrain the evolution of compact quiescent galaxies, and assess the different pathways to quiescence, we need to study how galaxy structures change with evolutionary phase. In most previous studies, galaxies were simply divided into broad groups, like star-forming and quiescent (e.g., Kriek et al., 2009a; van der Wel et al., 2014). Or, when following the evolution of galaxies at fixed number density, only the average properties of large samples were considered (e.g., van Dokkum et al., 2010). However, galaxies are much more diverse, and by averaging over large samples, or dividing into crude groups, important evolutionary phases may be missed.
In this Letter we use a new approach to study the structural evolution of galaxies. We have divided a -selected galaxy sample at into 32 different spectral types (Kriek et al., 2011), using broad and medium-band photometry from the NEWFIRM Medium-Band Survey (NMBS; Whitaker et al., 2011). Part of the NMBS is covered by CANDELS (Grogin et al., 2011; Koekemoer et al., 2011), and thus deep and high-resolution NIR imaging is available as well. The different SED types which span a wide range in evolutionary phases in combination with high-resolution rest-frame optical imaging are ideal for studying the structural evolution of galaxies.
Throughout this Letter we assume a CDM cosmology with , , and km s-1 Mpc-1.
2. DATA
We use the composite spectral energy distributions (SEDs) by Kriek et al. (2011), which were constructed from multi-wavelength photometry from the NMBS in the COSMOS field (Scoville et al., 2007). In summary, 3500 galaxies with a signal-to-noise ratio of 25 in the K-band were divided into 32 different spectral classes, based on similarities between their full rest-frame UV-to-NIR SEDs. For each spectral class we constructed a composite SED by de-redshifting and scaling the observed photometry of the individual galaxies. The resulting composite SEDs sample the full -selected galaxy distribution at , and each type presumably represents a different evolutionary phase.
In previous papers we used this spectral classification method and the resulting composite SEDs to study star formation and quenching timescales of galaxies (Kriek et al., 2011), to constrain the shape of the dust attenuation curve (Kriek & Conroy, 2013), to assess star formation rate (SFR) indicators (Utomo et al., 2014), and to study X-ray emission as a function of spectral type, stellar mass, and redshift (Jones et al., 2014). In this Letter we use the different spectral types to systematically study the structures of galaxies at .
572 galaxies in our sample are covered by deep Hubble Space Telescope/WFC3 imaging as part of CANDELS. For these galaxies we adopt the effective radii (; major axes) and Sérsic parameters (; Sersic, 1968) as measured by van der Wel et al. (2012, 2014) in the F160W photometric band using GalFit and Galapagos (Peng et al., 2002; Barden et al., 2012). The F160W filter covers rest-frame optical wavelengths for our full redshift regime. We do not circularize and thus the sizes for elliptical galaxies may be overestimated.
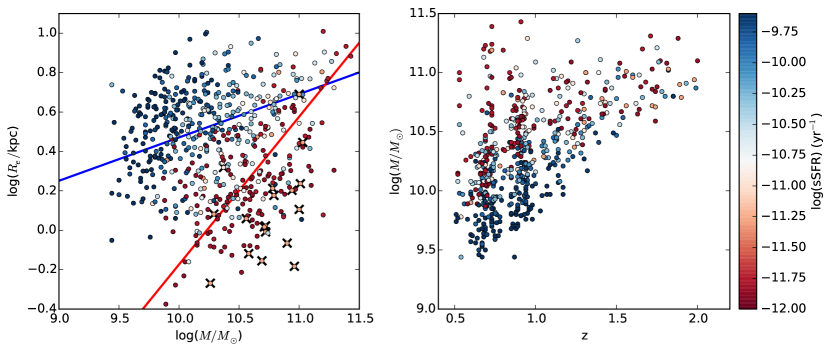
Figure 1 presents the sizes, stellar masses, redshifts, and sSFRs of all individual galaxies in our sample. The sSFRs are derived by fitting the rest-frame UV-to-MIR composite SEDs with stellar and dust models (Utomo et al., 2014), and thus are the same for all galaxies of a given spectral type. Redshifts and stellar masses are derived using EAzY (Brammer et al., 2008) and FAST (Kriek et al., 2009b), respectively, assuming the Bruzual & Charlot (2003) stellar population models, the Chabrier (2003) initial mass function, the Calzetti et al. (2000) dust attenuation law, and an exponentially declining star formation history. Figure 1 illustrates that the targeted mass range changes with redshift. Furthermore, stellar populations vary with both mass and redshift. As a consequence, the different sed types will contain galaxies of different masses and redshifts, and thus caution is required when interpreting the results.
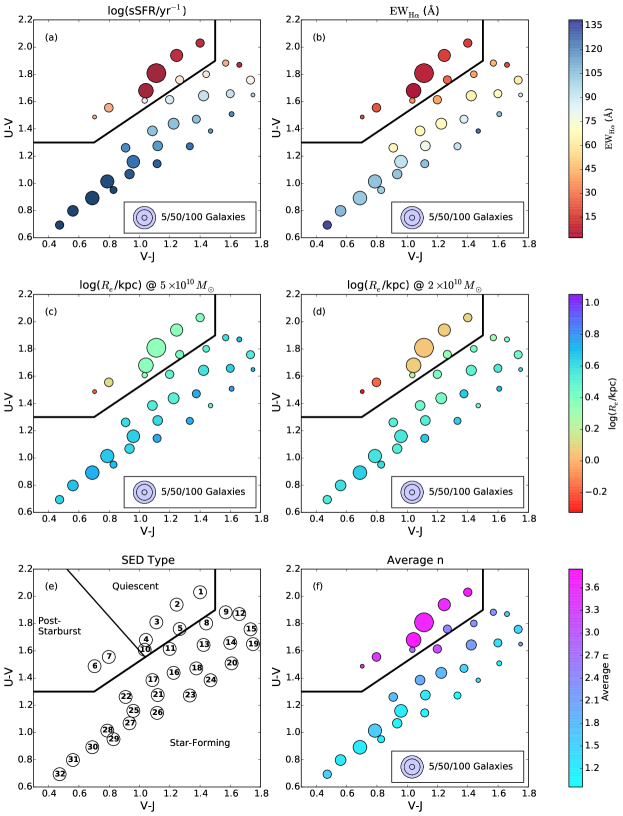
Figures 2a and b show the location of the composite SEDs in the rest-frame vs. (UVJ) diagram (Wuyts et al., 2007; Williams et al., 2009), color coded by sSFR and H equivalent width (), respectively. The rest-frame and colors and are directly measured from the composite SEDs111 includes contributions from the blended [N ii] and [S ii] emission lines (Kriek et al., 2011). Galaxies show a natural bimodality in the UVJ diagram out to at least (e.g., Muzzin et al., 2013), with quiescent and star-forming galaxies populating two different sequences. The quiescent sequence is primarily an age sequence (e.g., Whitaker et al., 2013), while the location of galaxies on the star-forming sequence reflects their dust content and sSFR. Figures 2a and b illustrate that the spectral types comprise quiescent, post-starburst, and star-forming galaxies, with a range of ages and sSFRs.
3. GALAXY STRUCTURE VS. SPECTRAL TYPES
We measure the typical size () for each spectral type at a fixed stellar mass (), by correcting for the relation using a least-squares fit. Due to incompleteness effects and the small sample size for some spectral types, we do not constrain the power-law slope, but fix it to the values found by van der Wel et al. (2014) for a much larger and complete sample of galaxies. For quiescent galaxies (sSFR ) we assume and for star-forming galaxies (sSFR ) we assume (see lines in Fig. 1). To facilitate comparison with van der Wel et al. (2014), we correct all sizes to a stellar mass of . To assess the effect of this mass choice, we also calculate the sizes for a stellar mass of . In Figure 2c and d we color code the UVJ diagram by at and , respectively.
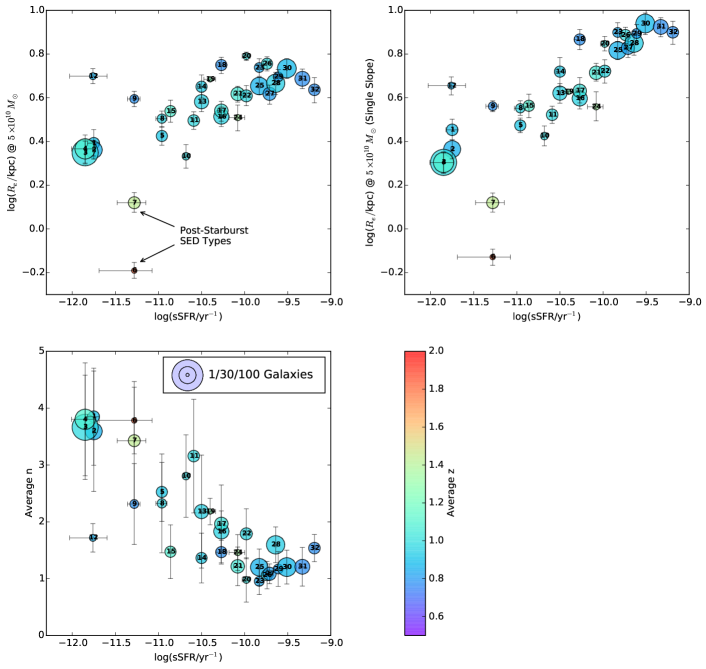
In the top-left panel of Figure 3 we show at for each SED type as a function of sSFR. The error bars on indicate the central 68% of values obtained through bootstrapping with 2000 iterations. As the slope for SED types with intermediate sSFRs () is arbitrarily defined, we also show at corrected using a single slope of in the top-right panel. Finally, we measure the average Sérsic parameter for each spectral type, which is presented in UVJ space in Figure 2f, and as a function of sSFR in Figure 3. The errors on present the median absolute deviation of the values in the sample.
Both figures clearly illustrate that, consistent with previous studies, star-forming galaxies are larger and have lower Sérsic indices than quiescent galaxies of similar mass. The structures of star-forming galaxies do not change much when we move up the star-forming sequence in the UVJ diagram. However, when moving into the direction perpendicular to the star-forming sequence, in which both and sSFR decrease, we see a decrease in and an increase in (see also Wuyts et al., 2011, Whitaker et al. 2015). These trends are also visible in the top panels in Figure 3. The slope of the -sSFR relation becomes steeper if we compare at lower stellar masses or using a single slope, but the general trends stay the same. Along the quiescent sequence we observe an increase in when going to redder colors and thus older ages, with post-starburst galaxies being the smallest. There is no obvious trend between and the location on the quiescent sequence.
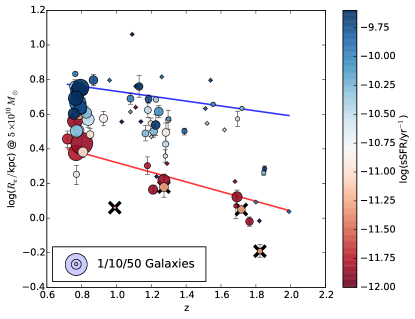
Our composite SEDs include galaxies over a large redshift range, and differences in the average redshift of the various spectral classes may contribute to the observed trends. The color coding by redshift in Figure 3 indeed indicates that SED type 6 has a higher average redshift compared to other SED types. To further unravel the correlation between and sSFR, we split each spectral class into three different redshift intervals in Figures 4 and 5.
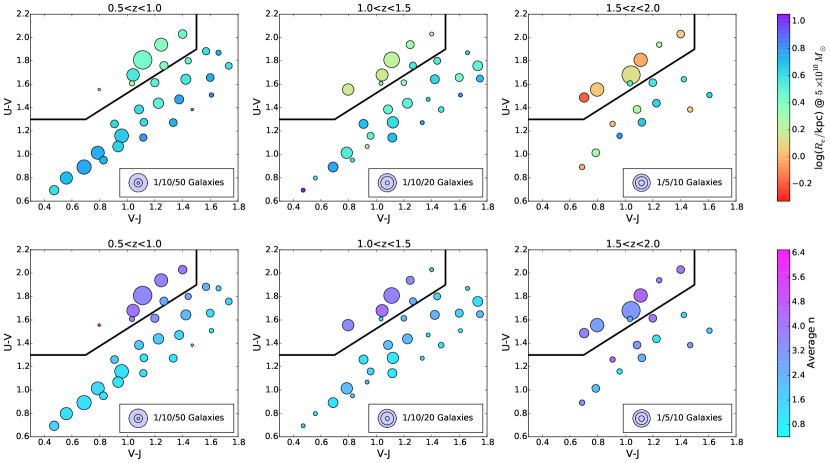
Consistent with previous studies, Figure 4 illustrates that both star-forming and quiescent galaxies were smaller at earlier times. The size difference between star-forming and quiescent galaxies of the same mass decreases with time and is only about 0.2 dex at . This trend was observed as well by van der Wel et al. (2014), as shown by the solid lines in Figure 4. There are small differences between the two studies, which could be explained by different mass limits of the galaxy samples, incompleteness effect of our sample (see Section 5), and the M/L ratio gradient corrections applied in van der Wel et al. (2014).
Figure 4 illustrates that the higher average redshift of post-starburst galaxies indeed contributes to the smaller size of this type in Figures 2 and 3. Nonetheless, Figure 5 shows that even in the high-redshift bin young post-starburst galaxies are significantly smaller than older quiescent galaxies. Our results support the findings by Whitaker et al. (2012) based on ground-based morphological measurements, that post-starburst galaxies have similar sizes, and perhaps are smaller than older quiescent galaxies at .
4. THE BUILDUP OF THE QUIESCENT SEQUENCE
In the previous section we found that young post-starburst galaxies are smaller than older quiescent types of similar mass at . Whitaker et al. (2012) used the finding that young quiescent galaxies are as small as older quiescent galaxies to argue that the addition of larger recently quenched galaxies cannot explain the size increase of the quiescent galaxy population. However, Belli et al. (2014) argue that there are multiple pathways to quench a galaxy, and not all quiescent galaxies go through the post-starburst phase, associated with a short star-formation timescale (see also Barro et al., 2013; Marchesini et al., 2014; Papovich et al., 2015). Figure 2 indeed shows that possible transitional galaxy types with intermediate sSFRs ( yr-1) exist either on the blue end of the quiescent sequence (types 6 and 7) or in between the star-forming and quiescent sequences (types 5, 8-12).
At , for which our selection targets galaxies , the majority of massive galaxies with intermediate sSFRs are post-starburst galaxies. In fact, all our young and small post-starburst galaxies (type 6) fall in this redshift range. When combined with the larger sizes of their older counterparts (type 7) and other intermediate galaxy types (type 10 and 11), the net size change due to the addition of new quiescent galaxies will presumably be small. At the intermediate types have similar or slightly larger sizes than the quiescent galaxies, possibly leading to a mild increase of the average size of quiescent galaxies. At there are no indications that intermediate SED types can further increase the average size of the quiescent galaxy population, as they have similar sizes. Post-starburst galaxies are extremely rare at these low redshifts.
Thus, consistent with the work by Belli et al. (2014), our results suggest that progenitor bias may contribute to the size evolution of quiescent galaxies at , but other mechanisms are needed as well. Inside-out growth by minor mergers is another popular explanation for the size growth of quiescent galaxies. We previously mentioned that there is a gradual size increase of quiescent galaxies along the quiescent sequence, and thus with age. This trend could be explained by minor mergers, as older galaxies, which are generally also the most massive (e.g., Thomas et al., 2005), may have experienced more minor mergers.
In addition to the size growth, our work also gives clues to the quenching mechanism of galaxies. The similar sizes and Sérsic indices of quiescent and intermediate galaxy types at low redshift suggest that the buildup of the quiescent sequence at is not associated with much structural change. At the post-starburst phase becomes more important to the build up of the quiescent sequence. The small sizes of the young post-starburst galaxies compared to similar mass galaxies with slightly higher sSFRs suggest significant structural evolution, which could either be explained by centrally-concentrated starbursts, possibly triggered by gas-rich major mergers, or by gradual shrinking due to violent disk instabilities. Hence, the small sizes of the young post-starburst galaxies seem inconsistent with the suggested “passive” evolutionary tracks by van Dokkum et al. (2015). However, we note that our galaxy sample in the higher redshift bin only consists of 46 galaxies, and thus larger galaxy samples are needed to confirm these results.
5. DISCUSSION
In this Letter we study the /F160W structures of galaxies as a function of SED type. We divided galaxies into different spectral types, based on their rest-frame UV-to-NIR SEDs. This approach has several advantages compared to previous studies. First, we probe a wide range of galaxy evolutionary phases, which allows us to isolate specific stages. For example, previous work based on ground-based data showed that young quiescent galaxies are as small as older quiescent galaxies (Whitaker et al., 2011). Our more detailed division shows that the youngest post-starburst galaxies are significantly smaller than older post-starburst and quiescent galaxies at . In addition, we also observe a trend along the quiescent sequence, with the oldest and reddest SED type being largest. A second advantage of the composite SEDs is that they are of much higher quality than individual SEDs, resulting in more accurate fundamental properties to characterize the evolutionary phase (i.e., and sSFR). Third, as galaxies are matched by their stellar continuum emission, we automatically exclude galaxies with significant contributions from active galactic nuclei to their rest-frame optical light, which could affect the structural measurements.
However, there are several caveats to our composite SED method as well. First, the K-band signal-to-noise limit used to select our sample may introduce a bias toward more compact galaxies. This bias will primarily affect bins with only few galaxies near the S/N limit and may explain the small sizes for some of the high-redshift star-forming bins that consist of only 1 or 2 compact star-forming galaxies (as the larger galaxies may have been missed). Second, this study suffers from incompleteness effects because of an evolving mass limit. We attempt to address the difference in mass by correcting for the relation. However, we adopt only two slopes, for quiescent and star-forming galaxies. Given that different types may have different slopes, this correction may bias our results. We assess this issue by assuming the same slope for all spectral types and find qualitatively similar results. Nonetheless, deeper galaxy samples are required to measure the relation for each type to the same mass limit and mitigate these issues.
Furthermore, we made two major assumptions, which will be addressed in future work. First, we have only considered F160W sizes, and assumed that there are no mass-to-light ratio gradients. Nonetheless, we know that this is incorrect, and that mass sizes are on average 25% smaller than rest-frame optical half-light radii (Szomoru et al., 2013). As this correction does not correlate with either stellar mass, sSFR, , or , this effect should not affect the large trends in this work. However, the scatter in the corrections are large, and systematic trends for specific types may exist. Second, we compare galaxies at fixed mass. In order to reconstruct the structural evolution of galaxies, in future studies we will use the mass profiles for each type, and connect the different types while taking into account mass growth across redshift.
Finally, as our sample relies on relatively shallow data from the NMBS in the CANDELS-COSMOS field, we only have few galaxies at higher redshift. With deeper medium-band photometry from ZFOURGE (I. Labbé et al., in preparation) in 3 CANDELS fields this project can be extended using larger samples, to higher redshift, and to lower masses.
References
- Barden et al. (2012) Barden, M., Häußler, B., Peng, C. Y., McIntosh, D. H., & Guo, Y. 2012, MNRAS, 422, 449
- Barro et al. (2013) Barro, G., Faber, S. M., Pérez-González, P. G., et al. 2013, ApJ, 765, 104
- Barro et al. (2014) Barro, G., Trump, J. R., Koo, D. C., et al. 2014, ApJ, 795, 145
- Belli et al. (2014) Belli, S., Newman, A. B., Ellis, R. S., & Konidaris, N. P. 2014, ApJ, 788, L29
- Bezanson et al. (2009) Bezanson, R., van Dokkum, P. G., Tal, T., et al. 2009, ApJ, 697, 1290
- Brammer et al. (2008) Brammer, G. B., van Dokkum, P. G., & Coppi, P. 2008, ApJ, 686, 1503
- Bruzual & Charlot (2003) Bruzual, G., & Charlot, S. 2003, MNRAS, 344, 1000
- Calzetti et al. (2000) Calzetti, D., Armus, L., Bohlin, R. C., et al. 2000, ApJ, 533, 682
- Carollo et al. (2013) Carollo, C. M., Bschorr, T. J., Renzini, A., et al. 2013, ApJ, 773, 112
- Ceverino et al. (2015) Ceverino, D., Dekel, A., Tweed, D., & Primack, J. 2015, MNRAS, 447, 3291
- Chabrier (2003) Chabrier, G. 2003, PASP, 115, 763
- Daddi et al. (2005) Daddi, E., Renzini, A., Pirzkal, N., et al. 2005, ApJ, 626, 680
- Dekel & Burkert (2014) Dekel, A., & Burkert, A. 2014, MNRAS, 438, 1870
- Grogin et al. (2011) Grogin, N. A., Kocevski, D. D., Faber, S. M., et al. 2011, ApJS, 197, 35
- Hopkins et al. (2009) Hopkins, P. F., Bundy, K., Murray, N., et al. 2009, MNRAS, 398, 898
- Hopkins et al. (2008) Hopkins, P. F., Hernquist, L., Cox, T. J., Dutta, S. N., & Rothberg, B. 2008, ApJ, 679, 156
- Jones et al. (2014) Jones, T. M., Kriek, M., van Dokkum, P. G., et al. 2014, ApJ, 783, 25
- Koekemoer et al. (2011) Koekemoer, A. M., Faber, S. M., Ferguson, H. C., et al. 2011, ApJS, 197, 36
- Kriek & Conroy (2013) Kriek, M., & Conroy, C. 2013, ApJ, 775, L16
- Kriek et al. (2009a) Kriek, M., van Dokkum, P. G., Franx, M., Illingworth, G. D., & Magee, D. K. 2009a, ApJ, 705, L71
- Kriek et al. (2009b) Kriek, M., van Dokkum, P. G., Labbé, I., et al. 2009b, ApJ, 700, 221
- Kriek et al. (2011) Kriek, M., van Dokkum, P. G., Whitaker, K. E., et al. 2011, ApJ, 743, 168
- Marchesini et al. (2014) Marchesini, D., Muzzin, A., Stefanon, M., et al. 2014, ApJ, 794, 65
- Muzzin et al. (2013) Muzzin, A., Marchesini, D., Stefanon, M., et al. 2013, ApJS, 206, 8
- Naab et al. (2009) Naab, T., Johansson, P. H., & Ostriker, J. P. 2009, ApJ, 699, L178
- Nelson et al. (2014) Nelson, E., van Dokkum, P., Franx, M., et al. 2014, Nature, 513, 394
- Papovich et al. (2015) Papovich, C., Labbé, I., Quadri, R., et al. 2015, ApJ, 803, 26
- Peng et al. (2002) Peng, C. Y., Ho, L. C., Impey, C. D., & Rix, H.-W. 2002, AJ, 124, 266
- Scoville et al. (2007) Scoville, N., Aussel, H., Brusa, M., et al. 2007, ApJS, 172, 1
- Sersic (1968) Sersic, J. L. 1968, Atlas de galaxias australes
- Szomoru et al. (2013) Szomoru, D., Franx, M., van Dokkum, P. G., et al. 2013, ApJ, 763, 73
- Thomas et al. (2005) Thomas, D., Maraston, C., Bender, R., & Mendes de Oliveira, C. 2005, ApJ, 621, 673
- Utomo et al. (2014) Utomo, D., Kriek, M., Labbé, I., Conroy, C., & Fumagalli, M. 2014, ApJ, 783, L30
- van der Wel et al. (2012) van der Wel, A., Bell, E. F., Häussler, B., et al. 2012, ApJS, 203, 24
- van der Wel et al. (2014) van der Wel, A., Franx, M., van Dokkum, P. G., et al. 2014, ApJ, 788, 28
- van Dokkum et al. (2008) van Dokkum, P. G., Franx, M., Kriek, M., et al. 2008, ApJ, 677, L5
- van Dokkum et al. (2010) van Dokkum, P. G., Whitaker, K. E., Brammer, G., et al. 2010, ApJ, 709, 1018
- van Dokkum et al. (2015) van Dokkum, P. G., Nelson, E. J., Franx, M., et al. 2015, ApJ, 813, 23
- Wellons et al. (2015) Wellons, S., Torrey, P., Ma, C.-P., et al. 2015, MNRAS, 449, 361
- Whitaker et al. (2012) Whitaker, K. E., Kriek, M., van Dokkum, P. G., et al. 2012, ApJ, 745, 179
- Whitaker et al. (2011) Whitaker, K. E., Labbé, I., van Dokkum, P. G., et al. 2011, ApJ, 735, 86
- Whitaker et al. (2013) Whitaker, K. E., van Dokkum, P. G., Brammer, G., et al. 2013, ApJ, 770, L39
- Williams et al. (2014) Williams, C. C., Giavalisco, M., Cassata, P., et al. 2014, ApJ, 780, 1
- Williams et al. (2009) Williams, R. J., Quadri, R. F., Franx, M., van Dokkum, P., & Labbé, I. 2009, ApJ, 691, 1879
- Williams et al. (2010) Williams, R. J., Quadri, R. F., Franx, M., et al. 2010, ApJ, 713, 738
- Wuyts et al. (2007) Wuyts, S., Labbé, I., Franx, M., et al. 2007, ApJ, 655, 51
- Wuyts et al. (2011) Wuyts, S., Förster Schreiber, N. M., van der Wel, A., et al. 2011, ApJ, 742, 96