The SLUGGS Survey: The Assembly Histories of Individual Early-type Galaxies
Abstract
Early-type (E and S0) galaxies may have assembled via a variety of different evolutionary pathways. Here we investigate these pathways by comparing the stellar kinematic properties of 24 early-type galaxies from the SLUGGS survey with the hydrodynamical simulations of Naab et al. (2014). In particular, we use the kinematics of starlight up to 4 effective radii (Re) as diagnostics of galaxy inner and outer regions, and assign each galaxy to one of six Naab et al. assembly classes.
The majority of our galaxies (14/24) have kinematic characteristics that indicate an assembly history dominated by gradual gas dissipation and accretion of many gas-rich minor mergers. Three galaxies, all S0s, indicate that they have experienced gas-rich major mergers in their more recent past. One additional elliptical galaxy is tentatively associated with a gas-rich merger which results in a remnant galaxy with low angular momentum. Pathways dominated by gas-poor (major or minor) mergers dominate the mass growth of six galaxies. Most SLUGGS galaxies appear to have grown in mass (and size) via the accretion of stars and gas from minor mergers, with late major mergers playing a much smaller role.
We find that the fraction of accreted stars correlates with the stellar mean age and metallicity gradient, but not with the slope of the total mass density profile. We briefly mention future observational and modelling approaches that will enhance our ability to accurately reconstruct the assembly histories of individual present day galaxies.
keywords:
galaxies: evolution – galaxies: kinematics and dynamics1 Introduction
Galactic archaeology is the detailed study of nearby galaxies that aims to reconstruct their evolutionary histories. A key, but often elusive, goal is to understand the assembly of an individual galaxy in terms of its initial formation and subsequent mass growth via mergers/accretion of stars and gas.
The formation of massive galaxies (which are predominately early-type) is often described in two stages or phases. In the first phase, it is thought that gas collapses via strong radial inflows, into a turbulent, clumpy rotating disc (Keres et al. 2005; Dekel et al. 2009; Ceverino et al. 2010; Zolotov et al. 2015). The vast bulk of the stars form in-situ within the central galaxy regions. In the second phase, mass growth occurs via stars that are formed ex-situ, i.e. within other galaxies that are later accreted/merge onto the host galaxy (Naab et al. 2007; Oser et al. 2010, 2012; Lackner et al. 2012; Dubois et al. 2013). In this picture, accretion may dominate the mass growth at low redshift, with more massive galaxies accreting a larger fraction of their mass (Khochfar et al. 2011).
Recently, Naab et al. (2014) presented detailed cosmological zoom simulations with hydrodynamics of 44 massive galaxies formed in two-phases as described above, while also placing them in the context of previous galaxy formation modelling. In particular, they modelled the shapes and kinematics of their present day simulated galaxies in two dimensions (2D) with a spatial resolution of 0.4 kpc (about 1/10 of the typical effective radius). This included 2D kinematics of velocity, velocity dispersion () and higher order moments h3 (which indicates the skewness of the velocity distribution) and h4 (which indicates the kurtosis, or peakiness, of the velocity distribution) similar to that provided by today’s integral field spectroscopy observations. Different mass assembly histories leave distinct imprints in the 2D kinematic maps and 1D kinematic profiles of the final galaxy. From these imprints 6 distinct evolutionary pathways were identified. These pathways involved different merger ratio contributions (minor or major), timescales (early or recent mergers) and gas contents (rich or poor). Although only a small sample, these represent possible pathways for the growth of massive galaxies in a cosmological context.
Using the same suite of models as Naab et al. (2014), Wu et al. (2014) showed that these different assembly pathways were also reflected in the outer kinematic radial profiles of present day simulated galaxies. The different assembly histories are also naturally associated with different mean fractions of stars formed in-situ and ex-situ (i.e. accreted). In particular, the fraction of stars formed ex-situ is predicted to correlate with galaxy stellar mass and mean stellar age (Naab et al. 2014). Using similar initial conditions to the Naab et al. (2014) models, Remus et al. (2013) and Hirschmann et al. (2015) showed that total mass density profiles and stellar metallicity outer gradients respectively, also correlate with the ex-situ fraction.
Using a semi analytic model approach, Khochfar et al. (2011) focused on the assembly history of centrally fast and slow rotators in a similar cosmology to Naab et al. (2014). They concluded that slow rotators accreted over 50-90% of their mass in 1-2 major mergers and a series of minor mergers. For fast rotators the accreted fraction is less than 50% and is dominated by minor mergers. This picture agrees in broad strokes with that of Naab et al. (2014), although the hydrodynamic simulations suggest that a fraction of slow rotators may have experienced only minor mergers. Moody et al. (2014) also focused on reproducing fast and slow rotators. In their controlled binary and multiple merger simulations, they found that binary mergers almost always result in a fast rotator while round, slow rotators as observed in nature require multiple mergers.
The first large 2D kinematic survey of early-type galaxies was the ATLAS3D survey (Cappellari et al. 2011). They found a variety of kinematic structures, including the prevalence of embedded kinematic discs. Based on this, they classified 86% of their 260 early-type galaxies to be centrally fast or regular rotators (i.e. disc-like kinematics with high angular momentum in the inner regions) and 12% to be slow rotators with low angular momentum. From the SLUGGS (SAGES Legacy Unifying Globulars and GalaxieS, http://sluggs.swin.edu.au) survey, Arnold et al. (2014) and Foster et al. (2015) found that centrally slow rotators maintain their slow rotation at larger radii, but centrally fast rotators show significant diversity. Their rotation may plateau, decline or steepen with increasing radius. Similar results were obtained from observations of PNe (Coccato et al. 2009; Cortesi et al. 2013). As well as SLUGGS, a number of other 2D integral field spectroscopy surveys are underway or near completion e.g. CALIFA, MASSIVE, SAMI, MaNGA (see Brodie et al. 2014 for a summary). Each has its own comparative advantages.
A number of previous studies have compared detailed observations with tailored models to infer the past history of individual galaxies. However, we are aware of only one independent study (Spiniello et al. 2015) that has directly compared their own 2D results with the simulations of Naab et al. (2014) and thus assigned an assembly class within the two-phase model of galaxy formation. The Spiniello et al. (2015) data reached out to 0.7 effective radii (Re) in NGC 4697 and confirmed the disc-like kinematics found by ATLAS3D and the SLUGGS surveys (Krajnovic et al. 2011; Arnold et al. 2014). They found its kinematic properties to be most consistent with class A, i.e. having undergone gas-rich minor mergers with gradual dissipation (however a recent gas-rich major merger may also be a possibility). From their stellar population analysis, they determined that the disk formed some 3 Gyr after the bulge.
Here we use the high S/N, large radial extent and excellent velocity resolution of the 2D kinematics from the SLUGGS survey of nearby early-type galaxies (Brodie et al. 2014) to compare their stellar properties with those of the simulated galaxies of Naab et al. (2014). Combining with the central (1 Re) kinematics from the ATLAS3D survey where available, we classify our galaxies into one of the six classes of assembly history. We then compare their V/ profiles with average values from the simulated galaxies of Wu et al. (2014), and the average ex-situ mass fractions of different assembly classes with mean stellar age, mass density profile slope and stellar metallicity gradients. Finally, we discuss the relative frequency of the different assembly classes for the SLUGGS galaxies and contrast them with model predictions.
2 Assembly class characteristics
Based on cosmological zoom simulations of 44 model galaxies, Naab et al. (2014; hereafter N14) defined 6 ‘assembly classes’ with distinct evolutionary pathways. The galaxies build up their mass via mergers and accretions, at different times, with variations in gas content. This gives rise to a range in the relative fraction of ex-situ formed stars to the total stellar mass. The present day total stellar masses of their galaxies span 2.6 M∗ 57 1010 M⊙, and lie within dark matter halos of mass 2.2 M∗ 370 1011 M⊙. The different pathways are encoded in the present day isophotal shapes and 2D kinematics of the galaxies. We note that the resolution and feedback of the models are limited and refer the reader to N14 for a see a discussion.
Below we briefly describe the key properties of each N14 assembly
class. We focus on 2D kinematics since the isophotal shape of galaxies
does not provide much leverage between the different classes (nor do
the models cover the full range of observed ellipticities). The 2D
kinematic properties are based on the appearance of the 2D velocity
and velocity dispersion maps out to 2 Re, and the distribution of
individual pixel values of the higher order moments h3 and h4 versus
V/ within 1 Re. A 1D property is also included by N14,
i.e. the shape of the profile (a proxy for projected
angular momentum) to 2 Re as defined by Emsellem et al. (2004).
| Class | Class | Central | Gas | Mins/M∗ | 2D map | h3, h4 | ||
|---|---|---|---|---|---|---|---|---|
| fraction | rotation | rich/poor | mean | range | profile | feature | trend | |
| (1) | (2) | (3) | (4) | (5) | (6) | (7) | (8) | (9) |
| A | 21% | Fast | Rich | 0.27 | 0.3–0.55 | peaked | dumbell | anti,V-shape |
| B | 16% | Fast | Rich | 0.29 | 0.3–0.55 | rising | V disc | anti, 0 |
| C | 16% | Slow | Rich | 0.24 | 0.2-0.4 | flat | dip | 0,0 |
| D | 11% | Fast | Poor | 0.11 | 0.3–0.5 | rising | featureless | 0,0 |
| E | 25% | Slow | Poor | 0.14 | 0.25–0.6 | rising | KDCs/twists | range, range |
| F | 11% | Slow | Poor | 0.13 | 0.15–0.4 | flat | featureless | range, range |
Notes: (1) Assembly class (2) Fraction of 44 simulated model galaxies; (3) Central rotator type; (4) Gas-rich or gas-poor merger history; (5) Mean in-situ to total stellar mass fraction since z = 2; (6) Range of edge-on ellipticity values at Re; (7) Shape of profile to 2Re; (8) Main 2D kinematic map feature; (9) h3 and h4 vs V/ behaviour (anti = anti-correlation, V-shape = V shaped distribution, 0 = h3 or h4 clustered around zero, range = large range in h3 or h4 values with V/ clustered around zero.).
Class A
Centrally fast, discy rotators that have undergone gas-rich minor ( 1:4) mergers
and no major ( 1:4) mergers in the last 8 Gyr. They reveal
a strong h3 vs V/ anti-correlation and
a V-shaped h4 vs V/ distribution.
The profile may show a peak and then
fall by 2 Re. Their 2D kinematic maps
often show a distinctive ‘dumbbell-like’
velocity dispersion
enhancement along the minor axes (i.e. perpendicular to the disc).
Class B
Fast, discy rotators that have experienced a gas-rich major merger since
z = 2. Like class A, they show
a strong h3 vs V/ anti-correlation but the h4 values are around zero (i.e. h4 is largely independent of V/).
Unlike class A, the profiles continue to rise beyond 1 Re. Their 2D kinematic maps
show a slight velocity dispersion dip at the centre but no strong enhancement along the minor axes. These galaxies
have the highest mean in-situ fraction in the last 10 Gyr
(and are therefore expected to have
steep total mass density profiles and
steep negative metallicity gradients; see Section 6).
Class C
Centrally slow rotators that have experienced a recent gas-rich major merger. There is little, or no,
correlation between h3 or h4 and V/. The profiles are flat. Their 2D kinematic maps show
a distinctive central velocity dispersion dip.
Class D
Fast rotators that have experienced a recent gas-poor major merger. Both h3 and h4 vs V/ distributions are clustered
around zero. They reveal a rising profile, with largely featureless kinematic maps. These galaxies have the lowest
in-situ fraction in the last 10 Gyr (and are
therefore expected to have shallow total mass density profiles
and shallow metallicity gradients).
Class E
Centrally slow rotators that have experienced a recent gas-poor major merger. Both h3 and h4
show a very weak anti-correlation and a large range of values, when compared to V/.
They show slowly rising profiles. Their 2D kinematic maps sometimes show kinematically distinct cores (KDCs) or kinematic twists.
They tend to be quite elongated galaxies with a mean ellipticity of 0.43.
Class F
Slow rotators that have undergone a gas-poor minor merger. Like class E, they show a very weak
anti-correlation of h3 and h4 with V/, and a large range of h3 and h4 values. They have low angular momentum with
flat profiles. Their 2D kinematic maps are largely featureless. They tend to be near-round galaxies with a mean ellipticity of 0.27.
The properties of the six N14 assembly classes are summarised in Table 1. Galaxies of classes D, E and F have experienced higher fractions of accreted stars compared to classes A, B and C. The former galaxies tend to have shallower metallicity gradients (Hirschmann et al. 2015), shallower total mass density profiles (Remus et al. 2013), and to be more massive on average. The fast rotator classes (i.e. A, B and D) have V/ values at 5 Re similar to those at 1 Re, whereas the slow rotators (C, E and F) have increased rotational support by 5 Re (Wu et al. 2014).
3 The SLUGGS sample
The SLUGGS survey (Brodie et al. 2014) investigates the spatial, kinematic and chemical properties of 25 nearby early-type galaxies. Using the DEIMOS spectrograph on the Keck telescope we obtain kinematics and metallicity information for the galaxy starlight out to 3 Re and for globular clusters out to 8 Re. Although only a small sample, it is chosen to be representative of the early-type galaxy population. Data collection for the SLUGGS survey is still underway in 2015, nevertheless we have obtained results for the bulk of the sample. Here we draw on the stellar kinematic measurements of Arnold et al. (2014) and Foster et al. (2015), stellar metallicity gradients from Pastorello et al. (2014) with updates (see Appendix B) and total mass density profile slopes from Cappellari et al. (2015).
| NGC | M∗ | Type | Age | ||
|---|---|---|---|---|---|
| (1010 M⊙) | (Gyr) | ||||
| (1) | (2) | (3) | (4) | (5) | (6) |
| 720 | 22.4 | E5 | 0.49 | – | – |
| 821 | 9.3 | E6 | 0.35 | -2.23 | 12.9 |
| 1023 | 9.5 | S0 | 0.63 | -2.20 | 13.5 |
| 1400 | 13.3 | E1/S0 | 0.13 | – | 13.8 |
| 1407 | 39.6 | E0 | 0.07 | – | 12.0 |
| 2768 | 18.9 | E6/S0 | 0.57 | -2.01 | 13.3 |
| 2974 | 6.5 | E4/S0 | 0.37 | -2.30 | 11.8 |
| 3115 | 9.4 | S0 | 0.66 | -2.37 | 9.0 |
| 3377 | 2.8 | E5-6 | 0.33 | -2.05 | 11.3 |
| 3608 | 6.7 | E1-2 | 0.20 | – | 13.0 |
| 4111 | 4.6 | S0 | 0.79 | -2.13 | 6.0 |
| 4278 | 7.6 | E1-2 | 0.09 | -2.29 | 13.7 |
| 4365 | 30.4 | E3 | 0.24 | – | 13.4 |
| 4374 | 28.6 | E1 | 0.05 | – | 13.7 |
| 4473 | 7.4 | E5 | 0.43 | -2.18 | 13.0 |
| 4494 | 10.5 | E1-2 | 0.14 | -2.26 | 11.0 |
| 4526 | 17.1 | S0 | 0.76 | -2.24 | 13.6 |
| 4564 | 3.8 | E6 | 0.53 | – | 13.3 |
| 4649 | 35.9 | E2/S0 | 0.16 | -2.19 | 13.2 |
| 4697 | 10.7 | E6 | 0.32 | -2.23 | 13.4 |
| 5846 | 25.2 | E0-1/S0 | 0.08 | – | 12.7 |
| 7457 | 1.9 | S0 | 0.47 | -2.23 | 6.1 |
| 3607 | 19.7 | S0 | 0.13 | – | 13.5 |
| 5866 | 9.4 | S0 | 0.58 | – | 8.4 |
Notes: (1) NGC name; (2) Total stellar mass (see text for details); (3) Morphological type; (4) Ellipticity for the outer isophotes from Brodie et al. (2014); (5) Total mass density slope from Cappellari et al. (2015); (6) Mass-weighted stellar age within 1 Re
from McDermid et al. (2015), Norris et al. (2006) for NGC 3115
and Spolaor et al. (2008) for NGC 1400 and NGC 1407. The last two galaxies in
the Table are SLUGGS bonus galaxies.
The properties of SLUGGS galaxies (and a few bonus galaxies observed in addition to the main survey) are summarised in Brodie et al. (2014). Here, in Table 2 we list some properties relevant for this work. In particular, we calculate the total stellar mass of each galaxy starting with the K-band luminosities listed in Brodie et al. (2014). This is corrected for missing flux using the formula given by Scott et al. (2013) and we apply M/LK = 1 (i.e. appropriate for old stellar populations with a Kroupa IMF). The range in stellar mass of SLUGGS galaxies is well matched to the 44 simulated galaxies of N14. We also list the total mass density slopes from 0.1 to 4 Re for the combined fitting of ATLAS3D data in the central regions and SLUGGS data further out for 14 galaxies (Cappellari et al. 2015). Stellar metallicity gradients to 2.5 Re, first presented in Pastorello et al. (2014), have been remeasured and are given in the Appendix B.
Central stellar ages for most SLUGGS galaxies are available from the ATLAS3D work of McDermid et al. (2015). Here we use the mass-weighted age within 1 Re. For NGC 1400 and NGC 1407, we use the luminosity-weighted ages from Spolaor et al. (2008), which reveal a constant age to 1 Re (i.e. half of the galaxy stellar mass). For NGC 3115 we use the average of the spheroid and disk age out to 1 Re from Norris et al. (2006).
4 Assembly classes of SLUGGS galaxies
4.1 h3 and h4 versus V/
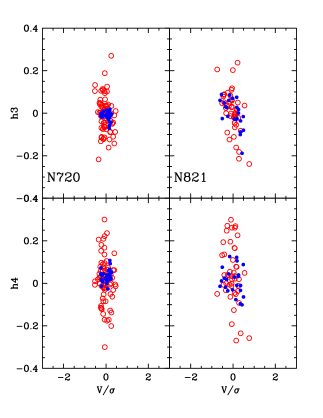
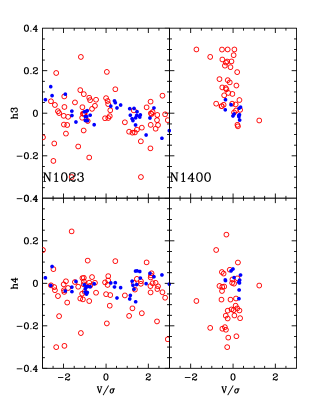
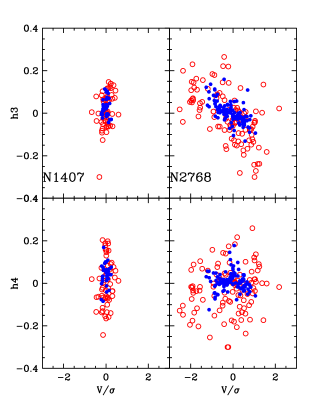
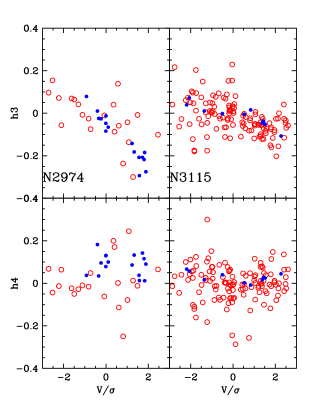
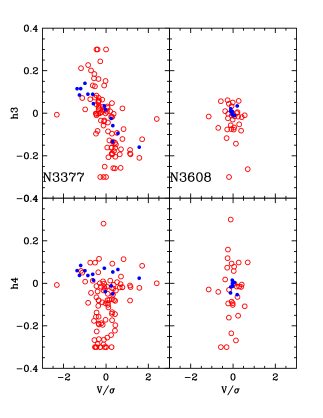
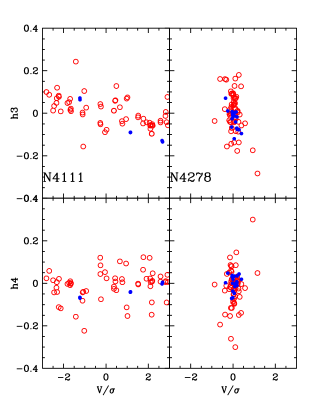
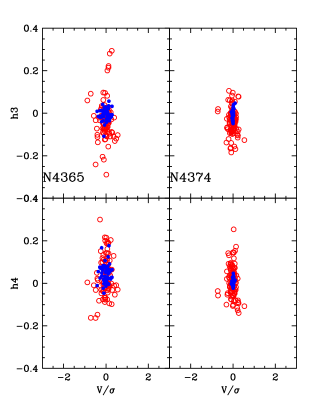
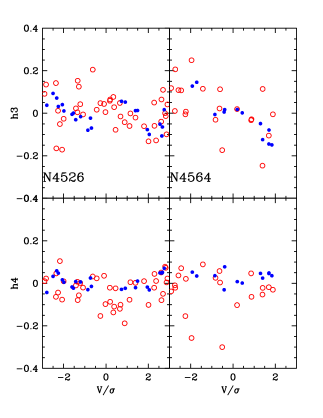
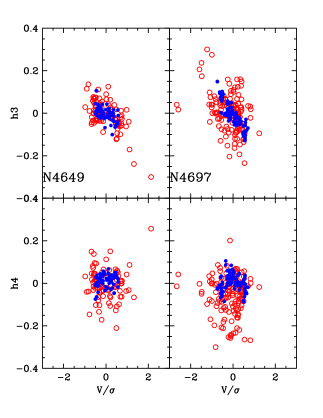
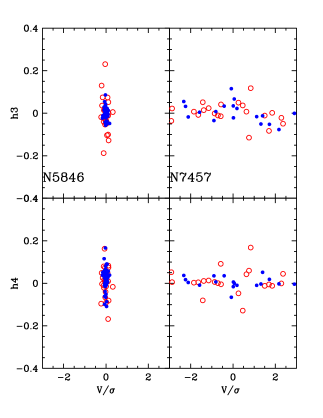
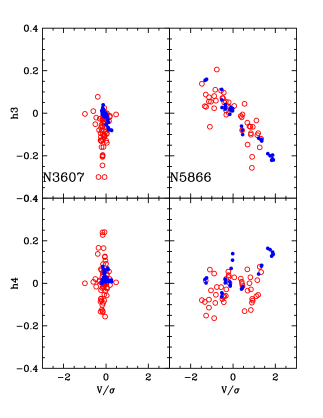
In Appendix A we show plots of the behaviour of the higher order velocity moments h3 and h4 against V/ for individual locations within each galaxy. The data, from the kinematic fitting of Foster et al. (2015), have been restricted to those points having S/N 10 (which corresponds to an uncertainty in h3 and h4 of about 0.15 and 0.1 in V/). These Figures can be compared to the N14 models shown in their figure 9, although those only showed the distribution of points within 1 Re. Our plots show the values within, and beyond, 1 Re using different symbols, where Re is taken from Brodie et al. (2014).
The distribution of h3 and h4 versus V/ at individual positions in a galaxy provide important diagnostics. The h3 term measures the skewness of the line-of-sight velocity distribution (LOSVD), and h4 measures the kurtosis or peakedness of the LOSVD. The V/ ratio is a good proxy for the ratio of ordered rotation to random motions. For example, an LOSVD with steep leading wings, indicative of a rotating disc, shows an anti-correlation of h3 versus V/.
In general, the datapoint trends within, and beyond, 1Re are very similar, with the 1 Re data points showing a larger range in values (which may be due to increased observational error). However, some exceptions exist. For example, for NGC 2974 the h4 values within 1 Re have a bias to positive h4 values, whereas beyond 1 Re the data scatter more evenly about zero. For NGC 3377, the h4 values are close to zero, indicative of disc-like kinematics, but scatter to larger/smaller h4 values beyond 1 Re. This behaviour is consistent with the 2D kinematic map which reveals an inner fast rotating disc surrounded by a slow pressure-supported halo (see Arnold et al. 2014; Foster et al. 2015 for details).
The h3 and h4 distributions show a variety of patterns similar to those shown in figure 9 of N14, e.g. the anti-correlated h3 and V/ characteristic of class A (e.g. NGC 3377), the V-shaped h4 distribution of class B (e.g. NGC 4526), the large range in h3 and h4 and small range in V/ of classes C, E and F (e.g. NGC 5846). Class D, with a small range in both h3 and h4, is tentatively assigned to only one galaxy (NGC 4649). We find some galaxies to have ‘flat’ distributions, i.e. both h3 and h4 have values close to zero while there is a large range in V/ (e.g. NGC 7457). This behaviour is not clearly seen in the N14 models, however it may be related to classes A and B (due to a very weak anti-correlation of h3 vs V/).
On the basis of a qualitative comparison with figure 9 of N14 we assign assembly classes, and list them in Table 3. We could not classify the h3 and h4 distribution of one galaxy (NGC 1400). In some cases, one assembly class clearly best resembles our data; in others several assembly classes may be compatible.
| NGC | h3, h4 | 2D map | Class | |
|---|---|---|---|---|
| (1) | (2) | (3) | (4) | (5) |
| 720 | EF | BDEF | ABDE | A? (E) |
| 821 | ACEF | A | ABDE | A (E) |
| 1023 | AB | B | BD | B (A) |
| 1400 | – | ABDE | AE | A (E) |
| 1407 | CEF | BD | CD | C? (D) |
| 2768 | AB | BD | ABCD | B (A) |
| 2974 | AB | AB | AB | A (B) |
| 3115 | AB | AB | AB | A (B) |
| 3377 | A | A | AB | A |
| 3608 | CDEF | BDE | E | E (D) |
| 4111 | AB | A | AB | A (B) |
| 4278 | CDEF | A | ABE | A (E) |
| 4365 | CDEF | DE | E | E (D) |
| 4374 | CEF | CEF | EF | F (E) |
| 4473 | CEF | ACEF | AE | E (A) |
| 4494 | ABD | AB | AC | A (B) |
| 4526 | B | B | AB | B (A) |
| 4564 | AB | A | AB | A (B) |
| 4649 | ABD | BD | BCD | D? (B) |
| 4697 | A | A | A | A |
| 5846 | CEF | CF | CEF | F? (C) |
| 7457 | B | AB | AB | A? (B) |
| 3607 | CD | CF | ABCE | A? (C) |
| 5866 | AB | BD | AC | A (B) |
Notes: (1) NGC name; (2) h3 and h4 vs V/ behaviour; (3) Shape of profile; (4) 2D kinematic map features; (5) Final assembly class assignment (see Section 4.3 for details).
4.2 2D kinematic maps and 1D profiles
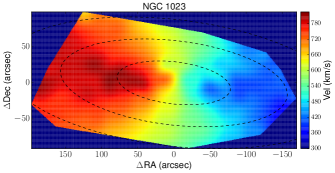
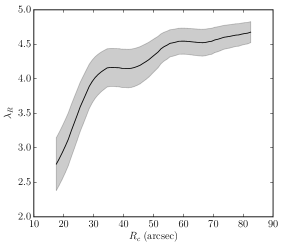
2D kinematic maps of velocity, velocity dispersion, h3 and h4 have been published in Arnold et al. (2014) and Foster et al. (2015), along with local profiles. In Figures 1 and 2 we show an example of a 2D velocity map and 1D profile for NGC 1023. The 2D maps and 1D profiles typically reach at least 2 Re and in some cases 4 Re and beyond. We also use the 2D maps of the ATLAS3D survey which has superior sampling in the central regions of galaxies (and use Cappellari et al. 2007 for NGC 720 which is not part of the ATLAS3D survey but was observed with the SAURON instrument). We note that the profiles published in the ATLAS3D survey are cumulative, i.e. they are luminosity-weighted and so the profiles are dominated by the central region properties. To probe the radial angular momentum in the SLUGGS galaxies we focus on our own local profiles.
After visually examining the 2D maps and the 1D profiles we assign assembly classes based on their characteristics as described by N14. As with the h3 and h4 distributions, 2D maps and profiles are often consistent with more than one assembly class and we list them all in Table 3.
The PNe study of Coccato et al. (2009) included nine SLUGGS galaxies. In particular, they examined the cumulative 1D profiles to 7 Re based on PNe kinematics. Most galaxies show good agreement with our stellar light local profiles, including the peaked and then falling profile of NGC 3377 (Foster et al. 2015). However, a couple of exceptions exist. For NGC 4494 our profile continues to rise out to 3 Re whereas the PNe-based profile falls by 1 Re. Differences could be due to the complex halo kinematics of NGC 4494 (Foster et al. 2011). In the case of NGC 1023, the profiles agree to 3 Re (i.e. the outermost starlight point) but beyond that the PNe indicate a falling profile.
4.3 Final assignment of assembly class
We have qualitatively assigned assembly classes to each SLUGGS galaxy based on its 1D local profile, h3 and h4 versus V/ behaviour and 2D kinematic map features, independently. These are listed in columns 2, 3 and 4 of Table 3. There is some variation in the assigned class(es) depending on the diagnostic used. This is to be expected as some diagnostics do not discriminate well between different assembly classes. For example, the h3 and h4 distributions of class E and F are almost identical. In assigning the final assembly class we have given more weight to the 2D map than to the other diagnostics. In column 5 of Table 3 we list the class that best represents the galaxy. In a few cases, the class assignment is tentative (denoted by a ?) and for most galaxies we give an alternative class (denoted in parentheses). An important caveat when comparing observations to simulations is that the observed galaxies have a range of (largely random) inclinations, while simulations can be projected along chosen sight lines. An illustration of inclination effects on cumulative profiles is shown by Wu et al. (2014) in their figure 12. They showed that face-on profiles have less diversity and overall lower absolute values than galaxies viewed edge-on. Inclination effects will be at least as strong for local and V/ profiles that we use in this study.
We find that several galaxies reveal inner disc-like kinematics on varying scales of effective radii. These discs then give way to a more slowly rotating outer region. Following N14, we assign these galaxies to class A. We note that NGC 720 was observed by Cappellari et al. (2007), who found it to have kinematics borderline between fast and slow rotators. We find it shows weak central disc-like kinematics and give it a tentative assignment of class A?. We assign 14 galaxies to class A or A?, 3 galaxies to class B, 1 to C?, 1 to D?, 3 to class E, and 2 to class F or F?.
Most of the alternatives listed for class A are class B, which is also a fast disky rotator but with an increased role for major, rather than minor, mergers. Five galaxies have class E listed as their alternative, compared to only 3 as the primary choice. If these E class alternatives are correct, it suggests that gas-poor major mergers are the second most frequent assembly pathway for our sample.
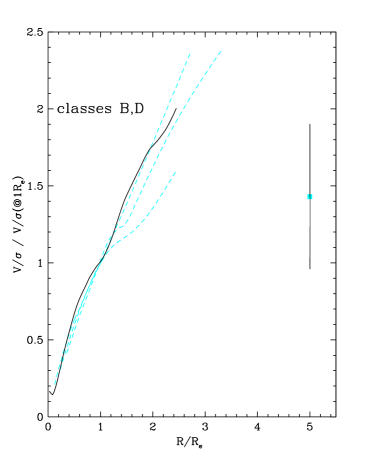
5 V/ profiles
Wu et al. (2014) examined the kinematic profiles for 42 model galaxies from the same suite of zoom simulations as N14. As well as showing cumulative and Vrms profiles, they plotted local V/ profiles for edge-on model galaxies and tabulated their values at 5 Re relative to 1 Re (values for Vrms were not given).
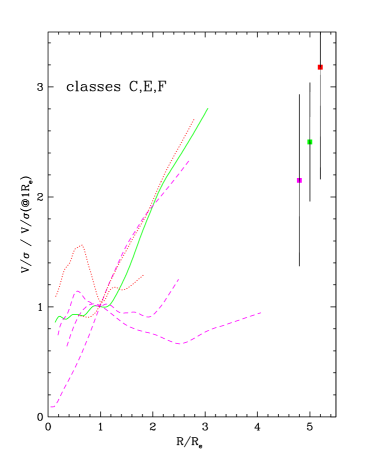
Using data from Foster et al. (2015) we plot the local V/ profiles for the SLUGGS galaxies, normalised at 1 Re. In Figure 3 we show the galaxies that we have classified as slow rotators (classes C, E and F). The slow rotators all have rising profiles indicating relatively more rotational support at larger radii. Although they only reach to 3 Re, the profiles appear consistent with the average values of V/ at 5 Re/1 Re for the 18 zoom models with slow rotator assembly classes in Wu et al. (2014).
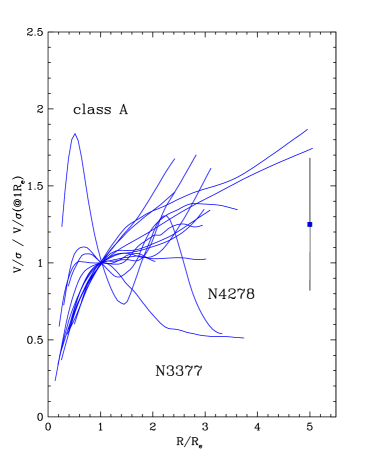
Galaxies classified as class A (i.e. disc-like kinematics as the result of gas-rich minor mergers) reveal relatively gently rising profiles (Fig. 4). This can be understood since several minor mergers will tend to randomise and reduce the net velocities of halo stars (Di Matteo et al. 2009). In the case of NGC 3377 and NGC 4278, the fast rotating disc is confined to the very central regions and a more slowly rotating spheroid occurs beyond 1 Re. Our class A galaxy V/ profiles are generally consistent with the Wu et al. (2014) predictions for their simulated class A galaxies.
The other fast rotators (classes B and D) are shown in Fig. 5. Major mergers are expected to spin up the remnant galaxy (Di Matteo et al. 2009). Indeed, the galaxies we have classified as B or D? show uniformly rapidly rising profiles. They exceed, even at 3 Re, the Wu et al. (2014) mean V/ predictions at 5 Re for classes B and D.
We find that the slow rotators (classes C, E and F), and class A galaxies have local V/ profiles that appear consistent with the expectations of their respective assembly class from Wu et al. (2014). In the case of class B galaxies, the simulations may under-predict their rotational support. We note that the predictions depend on the nature of the feedback incorporated in the models, and we remind the reader that the Wu et al. simulations do not include AGN feedback. However, Dubois et al. (2013) have showed that AGN feedback tends to reduce the predicted V/ even further.
Although Coccato et al. (2009) did not publish V/ profiles from their PNe, they did calculate the average V/ for all PNe over their field-of-view and compared this value to an average for the starlight component in the inner regions. They classified galaxies in one of three profile types, i.e. high and rising V/ profiles (NGC 1023 and 4564), relatively flat profiles (NGC 821, 3377, 4494, 4697), low V/ in the inner regions and either flat or rising values beyond (NGC 3608, 4374 and 5846). In section 4, we assigned NGC 821, 3377, 4494 and 4697 all to class A, and NGC 3608, 4374 and 5846 to the slow rotator classes E and F. Although NGC 1023 and NGC 4564 both have rising profiles they were assigned to class B (alternative A) and class A (alternative B) respectively. Thus our V/ profiles are in excellent agreement with the PNe profiles of Coccato et al. (2009).
6 Trends with Ex-situ fraction
The fraction of stars formed externally and later accreted in minor or major mergers is predicted to correlate with the mean age of the stellar population, the total mass density slope and the metallicity gradient. Below we investigate whether measurements of these properties for our sample reveal a trend with the mean ex-situ fraction for the assembly class that we have assigned to each galaxy. We also examine the trend with galaxy stellar mass, which is expected to show a weak dependence on ex-situ fraction. An important caveat to note is that the ex-situ fractions that we use from N14 are likely to be over-estimated due to the lack of realistic feedback (e.g. see Dubois et al. 2013 for the effects of incorporating AGN feedback).
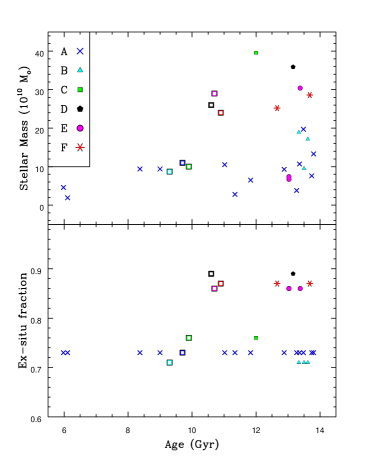
6.1 Mean stellar ages
The N14 simulations predict a strong dependence on the fraction of ex-situ formed stars with galaxy age, i.e. the galaxies that have accreted a larger fraction of their stars (classes D, E and F) tend to have, on average, older stars. These classes have experienced dry mergers with less gas dissipation than classes A, B and C. Although classes A, B and C have lower ex-situ fractions, they have nonetheless formed some new stars in recent gas-rich mergers and, hence, they tend to display younger average ages.
Stellar ages averaged over all radii for each SLUGGS galaxy are not available but as a proxy we use the mass-weighted stellar age within 1 Re as measured by McDermid et al. (2015). We supplement this with luminosity-weighted ages for NGC 3115 (9.0 Gyr) from Norris et al. (2006), and NGC 1400 (13.8 Gyr) and NGC 1407 (12.0 Gyr) from Spolaor et al. (2008).
In Fig. 6 we plot the stellar age of SLUGGS galaxies against their stellar mass and their inferred fraction of stars formed externally and later accreted (i.e. ex-situ fraction). The trend of age with galaxy mass is similar to those seen in larger samples (e.g. Denicolo et al. 2005; McDermid et al. 2015) with high mass galaxies being very old, and lower mass galaxies showing a large range of ages. When coded by assembly class (we follow the same colour scheme as N14, except yellow is replaced by black for the print version of the journal), the plot shows that class A galaxies tend to be of lower mass. young/intermediate aged galaxies are exclusively of class A. location of the data points in this plot do not depend on the assembly class that we have assigned to SLUGGS galaxies in this work.
N14 did not list the stellar ages for individual galaxies, only a mean value for each class. In Fig. 6 we show the mean values of the zoom simulations for the six assembly classes. We find that the 6 SLUGGS galaxies of classes D, E and F, with high ex-situ fractions, are “consistently old” as predicted by N14. Galaxies of classes A, B and C, with lower ex-situ fractions, are well described by the statement in N14 that classes A, B and C “are younger and show a larger spread in age (some have ages similar to classes D, E and F, some are as young as 8.5 Gyr).” The young/intermediate aged SLUGGS galaxies are exclusively of class A. There appear to be no SLUGGS galaxies that contain a significant young stellar population as the result of recent gas-rich merger. The average ages of the simulated galaxies are generally younger than the observed mass-weighted ages of the SLUGGS galaxies. The introduction of AGN feedback into the models, and the associated suppression of in-situ star formation, would be expected to lead to systematically older model ages (and lower stellar masses). Overall the assembly classes for the SLUGGS galaxies are consistent with the relative trends of stellar mass and ex-situ fraction with age from the N14 simulations..
6.2 Total mass density slopes
Remus et al. (2013) investigated the total mass (i.e. stellar plus dark matter) density profile for a subset of the N14 models that were re-simulated at two different spatial resolutions. The slope of this profile () has been measured observationally in massive early-type galaxies using strong lensing (Auger et al. 2010), weak lensing (Gavazzi et al. 2007) and from the combination of ATLAS3D and SLUGGS 2D kinematics (Cappellari et al. 2015). These studies all found to be close to -2 (i.e. an isothermal profile) over a wide range of galactocentric radii. Remus et al. examined, among other quantities, how depends on the host galaxy stellar mass and on the fraction of ex-situ formed stars.
In Fig. 7 we show the total mass density slope of the simulated galaxies from Remus et al. versus their stellar mass and ex-situ fraction since z = 2 taken from table 1 of N14. A clear trend is seen for the simulated galaxies in both plots with more massive galaxies, and those that have accreted a larger fraction of their total mass, having slightly shallower total mass density profiles.
In the top panel we overplot the results from Cappellari et al. (2015) for 14 fast, regular rotators. Our galaxies tend to be of lower mass on average than the simulated ones, and there is no clear indication of a stellar mass trend with .
In the lower panel we overplot the SLUGGS galaxies from this work, again using from Cappellari et al. and the mean ex-situ fraction of stars associated with each assembly class. N14 uses a fiducial value of 0.18 in-situ fraction, or 0.82 ex-situ fraction, to differentiate the assembly classes of A, B and C from D, E and F. The simulated galaxies of Remus et al. are mostly the slow rotator classes E and F with high ex-situ fractions. In contrast, we have classified most SLUGGS galaxies to be of class A or B which have low ex-situ fractions on average. There is no clear trend for the ex-situ fraction to vary with total mass density slope for SLUGGS galaxies.
It is difficult to draw strong conclusions given the small samples of both observed and simulated galaxies, and that they probe different mass ranges, assembly histories and ex-situ fractions. However, this initial investigation suggests that the simulations do not yet capture the degree to which the total mass density slope is independent of the present day galaxy mass and its assembly history. This suggests some missing physics. Indeed, the addition of feedback from AGN and winds appears to weaken the dependence of on stellar mass (Remus et al., in prep.). With larger samples of observed galaxies, one can also test the prediction that galaxies dominated by minor merger mass growth (i.e. classes A and F) should experience halo expansion and lower central dark matter densities (Johansson et al. 2009).
6.3 Metallicity gradients
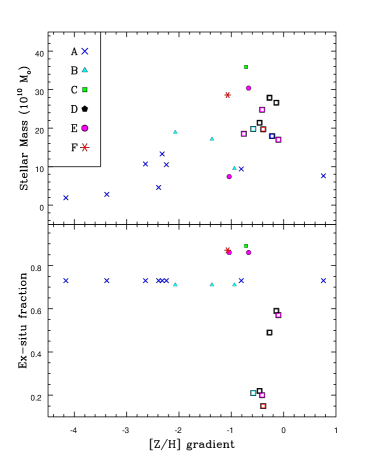
Stellar metallicity gradients for a subsample of massive galaxies from the zoom simulations of Hirschmann et al. (2013), which are based on the same initial conditions as N14, were in investigated by Hirschmann et al. (2015). Despite not including AGN feedback, they found that feedback in the form of momentum-driven winds provided a good match to the colour profiles of nearby galaxies. The predicted metallicity profiles fell steeply in the inner regions and flattened out to a near constant metallicity at large radii. This feedback has the effect of increasing the in-situ fractions, and hence stellar masses, relative to the original N14 simulations. In Figure 8 we plot the Hirschmann et al. (2015) values for the ex-situ fraction and stellar mass versus their metallicity gradients between 2 and 6 Re. flat to a gradient of about -1 dex per dex. As shown in Figure 7, The metallicity gradient correlates with the relative fraction of accreted stars, so that galaxies with a large ex-situ fraction have mildly shallower gradients on average. The simulated galaxies are colour-coded by their N14 assembly class. The introduction of feedback significantly reduces the fraction of ex-situ formed stars, and affects the merger history (e.g. reducing the number of minor mergers.)
The stellar metallicity gradients of SLUGGS galaxies have been measured by Pastorello et al. (2014) and are updated here using new data with an improved method for measuring the gradients and their errors (see Appendix B). Inner (0.32 to 1 Re) and outer (1 to 2.5 Re) gradients are measured. It is not possible to compare to stellar metallicity gradients to 6 Re as done in the simulations of Hirschmann et al. (but see Pastorello et al. 2015 for globular cluster metallicity gradients to comparable effective radii). The gradients measured for the SLUGGS galaxies to 2.5 Re are generally much steeper than the values quoted in Hirschmann et al. (2015) as they are measuring gradients at much larger radii where the metallicity profiles have flattened off to a relatively constant metallicity. Nevertheless, in Fig. 8 we compare the outer gradients of the SLUGGS galaxies (Table B1) with those from the Wind Model (WM) of present day galaxies by Hirschmann et al.
Fig. 8 shows that both datasets reveal a weak trend of metallicity gradient with stellar mass, i.e. steeper gradients tend to be found in lower mass galaxies. A similar trend was found by Spolaor et al. (2010) for the inner 1 Re metallicity gradients in a sample of early-type galaxies. The steepest gradients tend to be found in class A SLUGGS galaxies. We also show the metallicity gradient against ex-situ fraction. For the SLUGGS galaxies, the ex-situ fraction is the mean value corresponding to the assigned assembly class. The plot indicates that the galaxies with a high fraction of ex-situ formed stars tend to have relatively shallow metallicity gradients. Galaxies with lower ex-situ fractions reveal a large range of metallicity gradient.
7 Discussion
We find that the bulk of the SLUGGS galaxies (14 out of 24) can be classified as assembly class A. These are centrally fast rotators with an embedded disc, which often gives way to a slower rotating spheroid component. Three galaxies are classified as class B, which also contain discs but continue to rotate rapidly at large radii. One galaxy is tentatively assigned to fast rotator class D. The remaining six galaxies are all slow rotators (classes C, E and F).
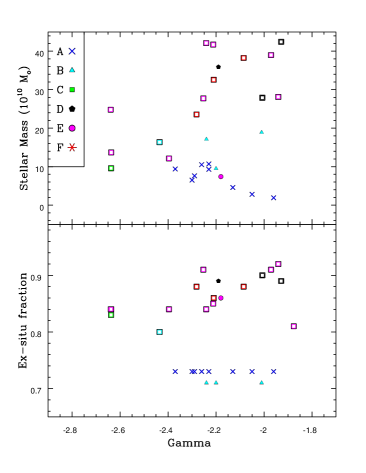
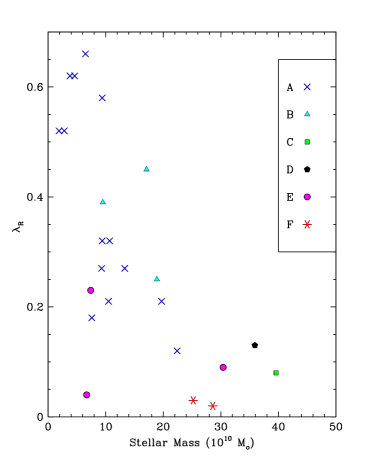
Before discussing our results further we present a summary plot in Fig. 9 which shows the distribution of assembly classes as a function of stellar mass and . Here is the average value measured within 1 Re from Emsellem et al. (2011) and supplemented by Arnold et al. (2014) for those SLUGGS galaxies not in the ATLAS3D survey. It is a proxy for the angular momentum in galaxies, separating centrally fast and slow rotators. Figure 9 can be compared with figure 6 from N14, which uses a similar colour scheme for the different assembly classes, bearing in mind that both samples have small numbers.
As with N14, we find that low mass galaxies with high central rotation tend to be of class A or B, and higher mass galaxies tend to be slowly rotating ones of class E and F. However, some interesting differences are also present. We find many more class A galaxies (58%) compared to the frequency in N14 (21%). Furthermore, class A is also more common than class B, particularly for the fast central rotators. If our small sample of 24 galaxies is representative of normal 1011 M⊙ early-type galaxies in the local Universe, then most galaxies have grown in mass and size by the accretion of stars and gas (and globular clusters) from smaller galaxies, with major mergers playing a lesser role.
In the N14 simulations most class C galaxies are of low mass. We have none, with the only tentative class C galaxy being the high mass NGC 1407 (and alternative class of D). Similarly, in the simulations 50% of the galaxies have experienced gas-poor mergers (i.e. classes D, E and F.). This is in stark contrast to the SLUGGS galaxies with only 25% assigned to these 3 dry merger assembly classes.
The main caveat about the relative frequency of the different assembly classes noted by N14 is that their sample is small and therefore not statistically representative of the galaxy population. However, another key limitation is the correct handling of feedback which affects essentially all of the properties discussed in this paper at some level. It is thus useful to compare our results with the observations of the ATLAS3D survey of 260 early-type galaxies. We find that 75% of our galaxies are classified as fast rotators (i.e. classes A, B and D), which is comparable to the 86% of the ATLAS3D survey classified as centrally fast rotators (Emsellem et al. 2011).
As noted in the Introduction, we are only aware of one independent study that has previously assigned an N14 assembly class, i.e. class A to NGC 4697 by Spiniello et al. 2015). In this work, we find it shows clear characteristics of class A. And we also note that their age for the bulge component (13.5 1.4 Gyr) agrees well with the age derived by McDermid et al. (2015) of 13.4 Gyr. Here we tentatively assign the same class D to NGC 4649 as Pota et al. (2015) using SLUGGS data.
With over half of our sample assigned to class A it appears that the most frequent assembly pathway for early-type galaxies of mass 1011 M⊙ is one of many gas-rich minor mergers since z = 2 (i.e. in the last 10 Gyr) and a significant fraction of in-situ star formation. These minor mergers tend to reduce the angular momentum in the outer regions so that the and V/ profiles may peak for the central disc and then decline in the halo. We note that most class A galaxies have very old ( 10 Gyr) mass-weighted stellar ages, suggesting that the gas content of the minor mergers did not lead to significant star formation.
Three galaxies (NGC 1023, 2768 and 4526), which have all been classified as S0 galaxies, have been assigned to class B. These galaxies have central disc-like kinematics and similarly high in-situ fractions (0.29) as class A, however the mass growth is dominated by gas-rich major mergers. These mergers tend to transfer angular momentum to the halo, spinning-up the final remnant which results in rising radial and V/ profiles. Again, the gas content has not resulted in significant recent star formation as all four galaxies contain very old stars.
We tentatively assign class D to NGC 4649 (M60), with class B as the alternative. It is a fast rotator like class B galaxies, but the evidence for a central kinematic disk is weaker. Class D, as the result of a gas-poor major merger, is in line with its old stellar age that indicates no recent central star formation.
Three galaxies (NGC 3608, 4365 and 4473) have been assigned class E. The mass growth of class E galaxies is expected to be dominated by recent gas-poor major mergers, although minor mergers also contribute. They should contain predominately old stars with little, or no, younger stars. This class of slow rotators includes simulated galaxies that reveal kinematic twists, minor axis rotation, KDCs and the rare 2- galaxies. Indeed, NGC 3608 and NGC 4365 are known to harbour KDCs, and NGC 4473 is one of only 4% of galaxies in the ATLAS3D sample to reveal a double peak in the 2D velocity dispersion map (i.e. a 2- galaxy). All three have old mass-weighted ages (McDermid et al. 2015). The kinematics of the stars and globular clusters in NGC 4473 reveal mild rotation in the very central regions, which gives way to a complex largely non-rotating halo (Foster et al. 2013; Alabi et al. 2015). NGC 4365 reveals minor axis rotation (i.e. the galaxy rolls rather than spins) beyond its central KDC region (Arnold et al. 2014). The globular cluster system of NGC 4365 indicates an ongoing interaction with a smaller galaxy in the group (Blom et al. 2012). NGC 3608 is a rare example of a non-regular rotator in the ATLAS3D survey (Krajnovic et al. 2011). We note that the simulations of Hoffman et al. (2009, 2010) suggested an alternative means of forming central KDCs, i.e. gas-rich binary mergers. However, both NGC 3608 and NGC 4365 have very old mean stellar ages ( 13 Gyr) along with h3 and h4 vs V/ distributions (see Figures A5 and A7) that resemble class E (gas-poor mergers) rather than the distributions predicted by Hoffman et al. (2009).
NGC 5846 is a very slowly rotating massive galaxy at the centre of its group. As is common with other slow rotators, it is found in a high density environment (Fogarty et al. 2014). We tentatively assign it class F?. We also assign class F to NGC 4374 (M84). The mass growth of such galaxies is almost exclusively via the accretion of gas-poor minor mergers with very little in-situ star formation. The repeated minor mergers decrease the angular momentum of the galaxy over time. Galaxies of this class tend to be very round and host an old stellar population – NGC 5846 has an ellipticity of 0.08 and mass weighted stellar age of 12.7 Gyr, while NGC 4374 has ellipticity 0.05 and age 13.7 Gyr.
NGC 1407 is also a massive galaxy at the centre of its group. Its 2D velocity map reveals more net rotation than NGC 5846, however we tentatively classify it as a slow rotator of class C? (and alternative class D). Its 2D velocity dispersion map (and 2D metallicity map) shows a lot of substructure, which may be indicative of a gas-rich major merger (Schauer et al. 2014). The mass growth of a class C galaxy is dominated by a recent ( 10 Gyr ago) gas-rich major merger. In this case, the major merger has led to a spin-down of the remnant so that it has little angular momentum today. We note that the galaxy has a uniformly old age of 12 Gyr within 1 Re (Spolaor et al. 2008), suggesting that if a recent gaseous merger has occured it has not led to significant star formation in the galaxy inner regions.
Simulated present day galaxies with high fractions of externally formed stars are expected to have older ages (N14), shallower total mass density profiles (Remus et al. 2013) and shallower metallicity gradients (Hirschmann et al. 2015). Such galaxies also tend to be more massive on average. With the caveat that there can be quite a spread in the ex-situ fraction within a given assembly class, which can reduce any trend compared to expectations, we have investigated the predicted trends of age, mass density slope and metallicity gradient with both the mean ex-situ fraction and galaxy stellar mass. We find that the high ex-situ fraction galaxies, in general, have old ages and shallow metallicity gradients as predicted (Figures 6 and 8). However, our sample galaxies do not show any evidence for shallower total mass density slopes (Figure 7), contrary to predictions. The zoom simulations need to probe galaxies of lower mass and include more that have assembly pathways with lower ex-situ fractions (i.e. classes A, B and C) before strong conclusions can be drawn.
8 Conclusions and Future Work
Using stellar kinematic data from the SLUGGS survey we compare the properties of 24 massive (M∗ 1011 M⊙) early-type galaxies with the predictions from the hydrodynamical zoom simulations of 44 galaxies by Naab et al. (2014). In particular, we assign each SLUGGS galaxy into one of six Naab et al. assembly classes (i.e. evolutionary pathways) based on three diagnostics: the behaviour of the higher order moments h3 and h4 versus V/, their 1D local profile, and their 2D kinematic map. We assign an assembly class that best represents the kinematic characteristics of each galaxy as defined in Naab et al. We also check the normalised V/ profile for each galaxy with that expected for the mean value of its assembly class from Wu et al. (2014).
Of the 24 galaxies examined, we assign 14 to class A. This class reveals inner regions with disc-like kinematics and outer regions that rotate slowly, if at all. Such galaxies are thought to have experienced gradual gas dissipation and multiple gas-rich minor mergers in the last 8 Gyr. Three galaxies, all S0s, are assigned to class B. These reveal strong inner rotation which continues into the outer halo. Gas-rich major mergers, which spin up the outer regions, are thought to contribute significantly for this class of galaxy. Their old stellar ages indicate that any merger-induced star formation happened some time ago. We tentatively assign one galaxy, NGC 1407, to class C. If correct, this slow rotator has a significant fraction of its stars formed in-situ and experienced a gas-rich major merger which has led to a net spin-down of the galaxy with little or no recent star formation. We tentatively assign one galaxy, NGC 4649, to class D, which are fast rotators that have experienced a gas-poor major merger. We have assigned 3 galaxies to class E. The simulated galaxies of class E often show kinematic twists, decoupled cores and other kinematic features as a result of gas-poor major mergers. Two galaxies assigned to this class (NGC 3608 and NGC 4365) are known to host kinematically decoupled cores, while the third NGC 4473 is a rare 2- galaxy (showing double peaks in its 2D velocity dispersion map). Two slow rotators are assigned to class F (i.e. NGC 4374 and NGC 5846). Both are massive, round ellipticals. For this class, multiple gas-poor minor mergers have contributed significant mass growth in the last 10 Gyr and lead to a spin-down of the final remnant galaxy. We conclude that most SLUGGS galaxies have assembly pathways indicating mass and size growth has occurred via the accretion of stars and gas (and globular clusters) from minor ( 1:4) rather than major ( 1:4) mergers. This is in contrast to Naab et al. (2014) in which most of their simulated galaxies have undergone a major merger.
As predicted in the simulations, we find that the fraction of accreted stars in the last 10 Gyr (from the mean value of each assembly class) correlates with the observed stellar age and metallicity gradient for SLUGGS galaxies. However, unlike the prediction of Remus et al. (2013), the observed total mass density slope does not appear to correlate with the fraction of accreted stars. Confirmation of this result requires simulations with a better match in stellar mass and assembly histories to the SLUGGS survey galaxies.
Future work should include an analysis of the remaining 3 SLUGGS galaxies (i.e. NGC 4459, 4474, 4486). We also aim to examine the Vrms profiles of SLUGGS galaxies and to compare with them Remus et al. (2013). They predicted that the radial profiles will be very flat and largely independent of mass, environment and assembly history.
The simulated galaxies of Hirschmann et al. (2015) reveal a correlation of stellar metallicity gradient from 2–6 Re with the fraction of accreted stars. However, measuring such a radial range from integrated starlight is extremely difficult due to the very low surface brightness in these halo galaxy regions. A more promising observational approach is to obtain the metallicities of large numbers of halo globular clusters (see Pastorello et al. 2015).
The spatial resolution of the Naab et al. (2014) and Wu et al. (2014) simulations was around 0.4 kpc. This limits details of the stellar kinematics to be greater than 0.2 Re and may restrict the ability of the simulations to produce thin and elongated disks (as observed in nature) and to properly resolve KDCs. Future simulations at much higher resolution may reveal variations in the predicted kinematic properties of the current 6 assembly classes and perhaps even reveal additional assembly pathways (see Moody et al. 2014). A more detailed investigation of inclination effects on the various kinematic parameters is also needed. Finally, a key limitation of the Naab et al. (2014) models and related works used in this paper, is the lack of AGN and strong stellar feedback. Such feedback needs to be incorporated into the next generation of models.
The combination of detailed observations in the outer halo regions of early-type galaxies with high resolution hydrodynamical simulations holds much promise in enabling us to reconstruct the evolutionary histories of individual galaxies.
9 Acknowledgements
We thank R.-S. Remus for a helpful discussion. We thank the staff of the W. M. Keck Observatory for their support. Some the data presented herein were obtained at the W.M. Keck Observatory, which is operated as a scientific partnership among the California Institute of Technology, the University of California and the National Aeronautics and Space Administration. DAF thanks the ARC for financial support via DP130100388. This research was in part supported by NSF grant AST-1211995.
10 References
Alabi A. B., et al., 2015, MNRAS, 452, 2208
Arnold J. A., et al., 2014, ApJ, 791, 80
Auger M. W., Treu T., Bolton A. S., Gavazzi R., Koopmans L. V. E., Marshall
P. J., Moustakas L. A., Burles S., 2010, ApJ, 724, 511
Blom C., Forbes D. A., Brodie J. P., Foster C., Romanowsky A. J., Spitler
L. R., Strader J., 2012, MNRAS, 426, 1959
Brodie J. P., et al., 2014, ApJ, 796, 52
Cappellari M., et al., 2011, MNRAS, 413, 813
Cappellari M., et al., 2015, ApJ, 804, L21
Ceverino D., Dekel A., Bournaud F., 2010, MNRAS, 404, 2151
Coccato L., et al., 2009, MNRAS, 394, 1249
Cortesi A., et al., 2013, MNRAS, 432, 1010
Dekel A., Sari R., Ceverino D., 2009, ApJ, 703, 785
Denicoló G., Terlevich R., Terlevich
E., Forbes D. A., Terlevich A., 2005, MNRAS, 358, 813
Di Matteo P., Pipino A., Lehnert M. D., Combes F., Semelin B., 2009, A&A, 499, 427
Dubois Y., Gavazzi R., Peirani S., Silk J., 2013, MNRAS, 433, 3297
Emsellem E., et al., 2004, MNRAS, 352, 721
Emsellem E., et al., 2011, MNRAS, 414, 888
Fogarty L. M. R., et al., 2014, MNRAS,
443, 485
Foster C., et al., 2011, MNRAS, 415, 3393
Foster C., Arnold J. A., Forbes D. A., Pastorello N., Romanowsky A. J.,
Spitler L. R., Strader J., Brodie J. P., 2013, MNRAS, 435, 3587
Foster, C. et al. 2015, MNRAS, submitted
Gavazzi R., Treu T., Rhodes J. D.,
Koopmans L. V. E., Bolton A. S., Burles S., Massey R. J., Moustakas L. A.,
2007, ApJ, 667, 176
Hirschmann M., et al., 2013, MNRAS, 436, 2929
Hirschmann M., Naab T., Ostriker J. P.,
Forbes D. A., Duc P.-A., Davé R., Oser L., Karabal E., 2015, MNRAS,
449, 528
Hoffman L., Cox T. J., Dutta S., Hernquist
L., 2009, ApJ, 705, 920
Hoffman L., Cox T. J., Dutta S., Hernquist
L., 2010, ApJ, 723, 818
Johansson P. H., Naab T., Ostriker J. P., 2009, ApJ, 697, L38
Kereš D., Katz N., Weinberg D. H., Davé R., 2005, MNRAS, 363, 2
Khochfar S., et al., 2011, MNRAS, 417, 845
Krajnović D., et al., 2011, MNRAS,
414, 2923
Lackner C. N., Cen R., Ostriker J. P., Joung M. R., 2012, MNRAS, 425, 641
McDermid R. M., et al., 2015, MNRAS, 448,
3484
Moody C. E., Romanowsky A. J., Cox T. J., Novak G. S., Primack J. R., 2014,
MNRAS, 444, 1475
Norris M. A., Sharples R. M., Kuntschner H., 2006, MNRAS, 367, 815
Naab T., Johansson P. H., Ostriker J. P., Efstathiou G., 2007, ApJ, 658, 710
Naab T., et al., 2014, MNRAS, 444, 3357
Oser L., Ostriker J. P., Naab T., Johansson P. H., Burkert A., 2010, ApJ,
725, 2312
Oser L., Naab T., Ostriker J. P., Johansson P. H., 2012, ApJ, 744, 63
Pastorello N., Forbes D. A., Foster C.,
Brodie J. P., Usher C., Romanowsky A. J., Strader J., Arnold J. A., 2014,
MNRAS, 442, 1003
Pota, V., et al., 2015, MNRAS, 450, 3345
Remus R.-S., Burkert A., Dolag K., Johansson P. H., Naab T., Oser L.,
Thomas J., 2013, ApJ, 766, 71
Schauer A. T. P., Remus R.-S., Burkert A.,
Johansson P. H., 2014, ApJ, 783, L32
Scott N., Graham A. W., Schombert J., 2013, ApJ, 768, 76
Spiniello C., Napolitano N. R., Coccato
L., Pota V., Romanowsky A. J., Tortora C., Covone G., Capaccioli M., 2015,
MNRAS, 452, 99
Spolaor M., Forbes D. A., Proctor R. N.,
Hau G. K. T., Brough S., 2008, MNRAS, 385, 675
Spolaor M., Kobayashi C., Forbes D. A.,
Couch W. J., Hau G. K. T., 2010, MNRAS, 408, 272
Wu X., Gerhard O., Naab T., Oser L., Martinez-Valpuesta I., Hilz M., Churazov
E., Lyskova N., 2014, MNRAS, 438, 2701
Zolotov A., et al., 2015, MNRAS, 450, 2327
Appendix A h3 and h4 vs V/ diagnostic plots
In Figures A1 to A12 we show h3 and h4 against V/ for the SLUGGS galaxies. Blue filled symbols indicate slit locations that are within 1 Re of the galaxy centre, while red open symbols show those slit locations beyond 1 Re from SLUGGS data only. Class A galaxies have anti-correlated h3 and V-shaped h4 with V/; class B have anti-correlated h3 and h4 clustered around zero; class C and D have both h3 and h4 clustered around zero; class E and F show a large range in h3 and h4 values with V/ clustered around zero. These Figures can be compared with figure 9 from N14.
Appendix B SLUGGS galaxies metallicity gradients
In Pastorello et al. (2014) we presented stellar metallicity 2D maps and radial profiles for 22 SLUGGS galaxies. Since then we have obtained new data for NGC 2768 and NGC 3115. Here we take the opportunity to update our analysis methodology and remeasure metallicity gradients.
The initial datasets from which we obtain the 2D metallicity maps are now cleaned from outliers in a more homogeneous fashion. Firstly, we remove duplicates (datapoints observed multiple times), averaging their metallicity values by weighting on the relative errors. Secondly, we exclude all the points with , errors on [Z/H] 0.5 dex, CaT index 2 and CaT index 9. Thirdly, we remove all the points at galactocentric radii , since they are likely not associated with the galaxies under study. Finally, all the remaining data points are checked by eye. This process allows us to retrieve an outer metallicity gradient for one additional galaxy (NGC 4494) but excludes one galaxy (NGC 3607) listed in Pastorello et al. (2014).
Another important change concerns the kriging parameters used to make the 2D maps. In particular, we now fit the semivariogram of all the galaxies with a third degree polynomial using ranges that better match the spatial sampling, i.e. the range for all the galaxies except NGC 5846 (range ) and NGC 7457 (range ). This results in smoother 2D maps.
The radial metallicity profiles are extracted from the kriged 2D maps as in Pastorello et al. (2014). However, the metallicity gradients extracted from the radial profiles are now measured in a more robust way. The metallicity radial profile uncertainties are obtained with both Monte Carlo simulations and bootstrapping. In the former case, we build 1000 kriged 2D maps from datasets with the same number of data points and the same spatial position, but different associated metallicity values. These metallicities are randomly extracted from a two-sided Gaussian distribution in order to obtain positive and negative metallicity uncertainties for each measured datapoint. In the latter case, we also build 1000 kriged 2D maps from datasets obtained by replacement sampling of the original dataset. From these approaches we generate 1D profiles and measure the standard deviation of the metallicity values in each radial bin. In this way we obtain separate Monte Carlo and boostrapping confidence limits for the observed radial metallicity profile, which we combine in quadrature to obtain the final estimate of the total uncertainty. We obtain a 1D metallicity profile from each kriged 2D map. From these sets of profiles, we obtain a median value and a distribution of metallicity values in each radial bin from which we measure the standard deviation as the metallicity uncertainty.
The final updated gradients are now obtained by fitting the metallicity profiles in equally spaced logarithmic bins with weights that are inversely proportional to both the uncertainty and the number of distributions from which such uncertainties are obtained. In Table B1 we list the updated inner (i.e. ) and outer (i.e. ) metallicity gradients and their uncertainties.
The main conclusion of Pastorello et al. (2014) that outer metallicity gradients are steeper in lower mass galaxies is unchanged.
| NGC | inner [Z/H] grad. | outer [Z/H] grad. |
|---|---|---|
| (1) | (2) | (3) |
| NGC 1023 | -0.28 | -0.94 |
| NGC 1400 | -0.50 | -2.32 |
| NGC 2768 | -0.64 | -2.07 |
| NGC 3115 | -0.09 | -0.81 |
| NGC 3377 | -0.87 | -3.38 |
| NGC 4111 | -0.48 | -2.39 |
| NGC 4278 | -0.07 | 0.76 |
| NGC 4365 | -0.08 | -0.67 |
| NGC 4374 | -0.42 | -1.07 |
| NGC 4473 | -0.24 | -1.04 |
| NGC 4494 | -0.19 | -2.24 |
| NGC 4526 | -0.42 | -1.37 |
| NGC 4649 | -0.27 | -0.72 |
| NGC 4697 | -0.66 | -2.64 |
| NGC 5846 | -0.68 | – |
| NGC 7457 | -0.95 | -4.16 |
Notes: The inner metallicity gradients (second column) are measured in the radial region , while the outer metallicity gradients (third column) are measured in the radial region . In the cases where the 2D maps do not extend to , the radial profile is extrapolated from the available points outside .