Atom-pair kinetics with strong electric-dipole interactions
Abstract
Rydberg-atom ensembles are switched from a weakly- into a strongly-interacting regime via adiabatic transformation of the atoms from an approximately non-polar into a highly dipolar quantum state. The resultant electric dipole-dipole forces are probed using a device akin to a field ion microscope. Ion imaging and pair-correlation analysis reveal the kinetics of the interacting atoms. Dumbbell-shaped pair correlation images demonstrate the anisotropy of the binary dipolar force. The dipolar coefficient, derived from the time dependence of the images, agrees with the value calculated from the permanent electric-dipole moment of the atoms. The results indicate many-body dynamics akin to disorder-induced heating in strongly coupled particle systems.
pacs:
32.80.Ee, 34.20.CfDipolar and van der Waals interactions between atoms and molecules affect the properties of matter on microscopic and macroscopic scales. On the quantum level, the distinctions between van der Waals and electric dipole-dipole interactions are in the overall interaction strength, the scaling with the internuclear separation, and the (an)isotropy behavior. Highly excited Rydberg atoms present an ideal platform to study these interactions in binary and few-body quantum systems because Rydberg-atom interactions are generally strong and widely tunable between dipole-dipole, van der Waals and other types. The electric dipole-dipole (van Ditzhuijzen et al., 2008; Altiere et al., 2011; Ravets et al., 2015) and van der Waals (Reinhard et al., 2008; Béguin et al., 2013) interactions between Rydberg atoms have previously been studied using spectroscopic measurements of level shifts. Methods from optical and electron microscopy have been adapted to image Rydberg-atom systems with single-particle spatial resolution, revealing many-body quantum structures such as Rydberg-atom crystals (Pohl et al., 2010; Bijnen et al., 2011; Schauß et al., 2015) and enabling advanced studies of the Rydberg excitation blockade (Lukin et al., 2001; Urban et al., 2009; Weber et al., 2015).
In our work we employ an adiabatic quantum-state preparation method and a modified field ion microscope (Müller and Bahadur, 1956; Müller, 1965; Ullrich et al., 2003) with single-atom resolution to measure the atom kinetics that result from the dipolar force. We overcome the density limit imposed by the excitation blockade by initially preparing Rydberg atoms under conditions where they are only subject to weak van der Waals interactions. This allows us to prepare Rydberg atom samples with relatively small interatomic separations. In order to switch on strong dipole-dipole interactions, the atoms are subsequently transferred into a highly dipolar state via a Landau-Zener adiabatic passage through an avoided crossing (Rubbmark et al., 1981; Wang et al., 2015). After the adiabatic state transformation, the direction of the permanent atomic dipoles is locked to the direction of an external electric field. After initialization, the atoms move under the influence of the strong dipolar forces for a variable interaction time. The center-of-mass positions of the Rydberg atoms are then detected by field ionization (Gallagher, 2005) and ion imaging (Schwarzkopf et al., 2011). From the recorded images, we calculate the spatial pair correlation functions between the Rydberg atoms (Schwarzkopf et al., 2013), which directly show the anisotropic character of the dipolar force between two atoms and allow us to measure the dipole-dipole interaction strength parameter. The experiment is performed under two conditions, one in which the direction of the atomic dipoles is transverse and another in which it is perpendicular to the observation plane.
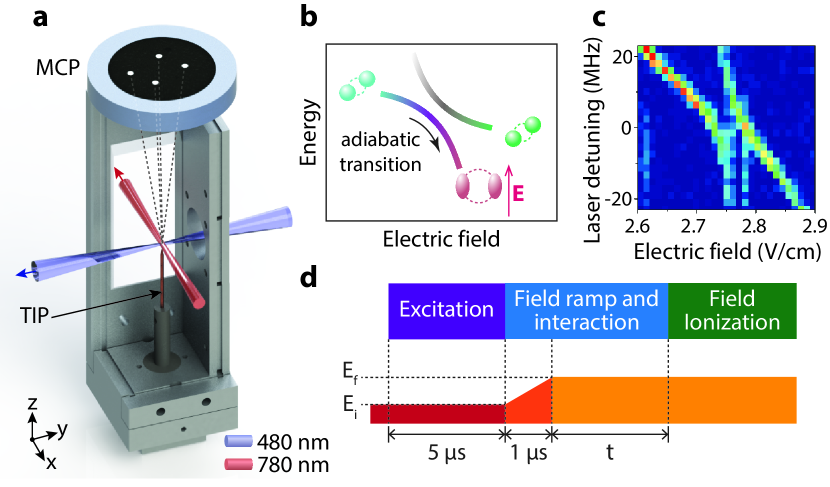
The experimental setup is shown in Fig. 1(a). Cold 85Rb atoms in the state undergo two-photon Rydberg excitation into the state by simultaneously applying 780- and 480-nm laser pulses with 5 s duration and 1 GHz red-detuning from the 5 intermediate state. The 780-nm beam propagates along the -direction (coordinate frame defined in Fig. 1(a)) and has a Gaussian beam parameter of m. The 480-nm beam propagates in the plane, forms an angle of approximately 70∘ with the 780 nm beam, and has m. Therefore, the excitation volume is cylindrical and aligned approximately along the -direction. The number of Rydberg excitations in each sample is on the order of ten.
After excitation into the state, the atoms are adiabatically transferred into a linear Stark state by sweeping the applied electric field through the avoided crossing between those two states (Rubbmark et al., 1981; Wang et al., 2015). The permanent electric dipole moment of the Stark state is about 16 times larger than that of the initial (perturbed) state, leading to much stronger, longer-range and anisotropic interactions, as sketched in Fig. 1(b). We perform the experiment at the 6th avoided crossing (counted from zero applied field) of rubidium with the manifold of hydrogen-like dipolar states, located at a calculated electric-field value of 2.762 V/cm. We use Stark spectroscopy to verify the position of this avoided crossing, as shown in Fig. 1(c). This particular avoided crossing is chosen because its gap size is large enough that we are able to experimentally resolve it in the Stark spectra, and it is large enough to ensure near-perfect adiabatic passage behavior.
The timing sequence of the experiment is shown in Fig. 1(d). The -like atoms, prepared at 0.1 V/cm below the avoided crossing, have a small electric dipole moment of Cm. They are adiabatically transferred into the dipolar target state by linearly increasing the electric field by 0.2 V/cm within 1 s. The dipolar state has a dipole moment of Cm, corresponding to an increase of the dipolar interaction strength by a factor of 250. The sweep duration is slow enough that the adiabatic transfer from the -like into the dipolar state has an efficiency very close to unity (met, ). The sweep duration is also short enough that during the adiabatic transfer the atoms do not move significantly. Hence, the state switching is practically instantaneous with respect to the center-of-mass motion of the atoms. After the switch, the electric field is kept constant for the duration of the interaction time, . We study the atom kinetics that follow from the dipolar force as a function of .
To perform atom imaging, Rydberg atoms are ionized by sudden application of a positive high voltage to a tip imaging probe (TIP). Ions are accelerated by the TIP electric field towards a microchannel plate (MCP). Every detected ion results in a blip produced by the MCP-phosphor detector assembly, which reveals the center-of-mass position of its parent Rydberg atom at the time of ionization. The excitation region (object plane) is about 300 m above the TIP. For this distance, the magnification is calibrated to be (met, ). We take 10 000 images in each data set. Using a peak-detection algorithm (Schwarzkopf et al., 2013), the images are processed into a data structure in which each record contains the total number of detected ions and the ion impact positions in an individual image. The 5000 records with the highest ion numbers are processed into a sample-averaged pair correlation image, which is normalized such that at large distances it approaches the value of one. The average pair correlation images yield the information on the atom-pair kinetics.
For two identical dipoles pointing along the same direction, given by the direction of the applied electric field, the dipolar force has radial and polar components
| (1) |
where is the angle between the internuclear separation vector, , and the dipole vectors, .
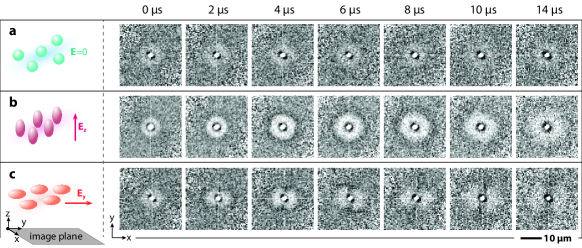
When the applied electric field is perpendicular to the detection () plane, the atomic dipoles point in the -direction. Since the excitation blockade radius is on the order of the diameter of the 480-nm excitation beam, for most dipole-dipole-interacting atom pairs the angle in Eq. 1 is . Hence, for the vast majority of atom pairs the dipole force is repulsive, with , and azimuthally symmetric about the line of sight. The pair correlation images at different interaction times, presented in Fig. 2(b), are azimuthally symmetric at all times. With increasing interaction time, the (projected) radius of the region that is largely devoid of pair-correlation events increases, reflecting an increase of the interatomic separation due to repulsive dipole-dipole interactions. We also find that the pair correlation is enhanced at a certain radius that increases in time; this radius approximately doubles over a time of 14 s.
The expansion in Fig. 2(b), which is due to dipole-dipole interaction, is considerably faster than that due to repulsive van der Waals interactions between atoms at zero electric field, shown in Fig. 2(a). The van der Waals interaction does not cause any significant expansion over the time scale in Fig. 2. In previous work (Thaicharoen et al., 2015) it was found that even Rb Rydberg atoms, which interact about 50 times more strongly than Rb Rydberg atoms (present case), exhibit significant repulsion effects only after about s. Hence, a cursory comparison of the pair correlation data in Figs. 2(a) and 2(b) already shows that the interaction between the dipolar atoms must be one to two orders of magnitude stronger than the interaction between the non-polar, van der Waals-interacting atoms.
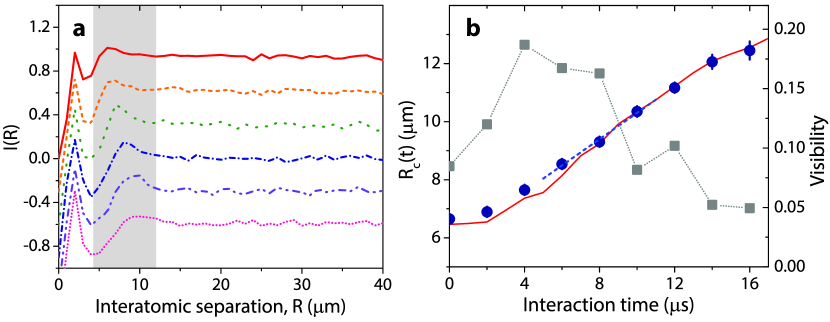
The angular integrals of the pair correlation images from Fig. 2(b) are shown in Fig. 3(a). The most probable separation between Rydberg-atom pairs, , is determined by local parabolic fits to in the vicinity of the peaks found within the shaded region in Fig. 3(a). The blue circles in Fig. 3(b) show the resulting values that represent the most probable radial atom-pair trajectory projected into the -plane. It is seen that atom pairs are initially prepared at a preferential separation m, controlled by the excitation-laser detuning and the atomic interaction strength before the adiabatic state transformation (Schwarzkopf et al., 2013). The large positive acceleration observed subsequent to the state transformation is due to the strong repulsive dipole-dipole interaction that occurs for angles near . The acceleration apparently diminishes and changes sign from positive to negative at an interaction time near 8 s, where .
To verify that the observed rapid expansion in the -plane is consistent with the known permanent electric dipole moment of the atoms after adiabatic transformation, we extract the coefficient using conservation of energy between interaction times of and ,
| (2) |
There, and are the reduced mass of a pair of 85Rb atoms and the relative pair velocity, respectively. We choose s because at that time the atom pairs have an approximately constant velocity, which can be extracted well from a local linear fit within the range s 10 s, indicated by the blue dashed line in Fig. 3(b). We obtain s m/s and sm, where the uncertainties include the statistical fit uncertainty and the magnification uncertainty. With m from above, the resulting value becomes . This value agrees with the calculated value, . This agreement also implies that the interacting entities are individual atoms and not superatoms, as has been predicted in (M’́obius et al., 2013) and experimentally observed for van-der-Waals-interacting Rydberg excitations in (Thaicharoen et al., 2015).
In Fig. 3(b) it is evident from the experimental data (circles) and the result of a semi-classical simulation (met, ) (red line) that the acceleration is negative for s. The late-time deceleration appears to be due to repulsion from initially farther-away atoms, indicating many-body dynamics that involve more than two atoms. A related conclusion can be drawn from considering the visibility of the pair-correlation enhancement as a function of time, calculated from the curves in Fig. 3(a) as , where the asymptotic values are obtained by averaging curves over the range m. The visibility values are shown as gray squares in Fig. 3(b). The visibility rapidly increases at early times, s, and passes through a broad maximum between 4 and 8 s. Hence, the significance of the pair correlation enhancement at , equivalent to the degree of short-range order, and the kinetic energy in the sample, equivalent to the slope in , both become maximal approximately at the same time. These evidences are reminiscent of those in disorder-induced heating, which has been observed in the strongly-coupled ion component of an ultracold plasma (Killian et al., 2007). In both cases, particles initially repel each other due to dominant nearest-neighbor forces, before encountering repulsive forces from initially more distant particles. At wait times s the correlation enhancement disappears, which is in part due to the initial thermal atom velocity (the magneto-optical trap has an atom temperature of K). The “coupling parameter” of the dipolar system can be defined as the ratio between the initial dipole-dipole interaction energy and the thermal energy at K. This ratio is , which is sufficiently large that the system should indeed develop (transient) short-range order.
When the electric field is applied along , the atomic permanent electric dipole moments are oriented along . In that case, the angular dependence of the dipole force can be observed within the plane, encompassing maximally-repulsive interactions () and maximally-attractive interactions (), as well as all intermediate cases. The interaction then leads to the characteristic anisotropic patterns in the pair correlation images shown in Fig. 2(c).
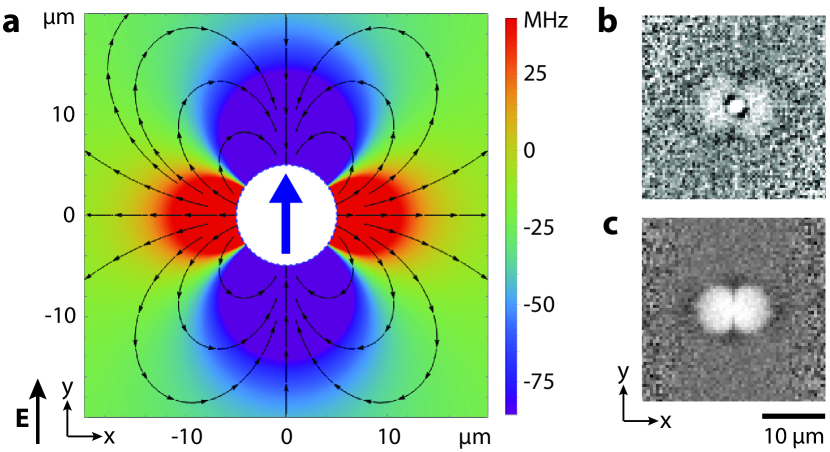
The angular force in Eq. 1 is maximal at and , zero at , and , and it always points towards the “poles” (see Fig. 4(a)). Hence, the angular force leads to an accumulation of atom pairs lined up close to the electric-field direction (the same direction as ). These atom pairs then become pulled close to each other due to the radial component of the force, which is attractive for and . These atom pairs form the prominent vertical dark strip across the center of the images at interaction times s in Fig. 2(c). Conversely, atom pairs initially positioned at will keep repelling each other, while being diverted towards the poles by the angular force (see Fig. 4(a)). Within the experimental uncertainty, the most probable pair separations in Fig. 2(b), along any direction in the plane, and in Fig. 2(c), along the direction, are the same. This is expected because all these cases correspond to in Eq. 1. The “funneling effect” pointing towards the poles eventually leads to dumbbell-shaped pair correlation images that are void of signal in a volume extending along and that possess enhanced signals along . These characteristics are seen in the experiment (Fig. 2(c) and Fig. 4(b)) and in our simulations (Fig. 4(c)). The small deviation of the enhancement cones in Fig. 2(c) from the -direction is attributed to a slight deviation of the electrode arrangement from perfect symmetry.
Atoms pulled close to each other along the polar direction () will likely undergo Penning-ionizing collisions (Robicheaux, 2005), when the interatomic separation drops below about 0.5 m in our case. This distance is below the image resolution and is not directly observed in the experiment. It is, however, noticed that the amount of signal within the enhancement cones near and in Fig. 2(c) plateaus at s and eventually drops. This observation is consistent with atom-pair loss within the polar cones due to Penning ionization.
In summary, we have employed an adiabatic state transformation method to prepare dense samples of about ten Rydberg atoms with large permanent electric dipole moments. We have determined the dipolar dispersion coefficient, . The measured pair correlation images portray the anisotropic character of dipolar atom-pair kinetics in a forceful, intuitive manner. Results of a semi-classical trajectory model agree well with our experimental observations. We have observed dynamics reminiscent of disorder-induced heating, as found elsewhere in strongly-coupled plasmas. Further insight may be gained by varying the ratio between the time scales governing the atoms’ center-of-mass motion and the dipolarization (the ramp speed used during adiabatic passage). This may lead into a new approach for the formation of ordered quantum matter, such as crystalline states of Rydberg atoms.
Acknowledgements.
This work was supported by NSF Grant No. 1205559 and 1506093, and AFOSR Grant No. FA9550-10-1-0453. N.T. acknowledges support from DPST of Thailand. L.F.G. acknowledges support from FAPESP Grant No. 2014/09369-0.References
- van Ditzhuijzen et al. (2008) C. S. E. van Ditzhuijzen, A. F. Koenderink, J. V. Hernández, F. Robicheaux, L. D. Noordam, and H. B. van Linden van den Heuvell, Phys. Rev. Lett. 100, 243201 (2008).
- Altiere et al. (2011) E. Altiere, D. P. Fahey, M. W. Noel, R. J. Smith, and T. J. Carroll, Phys. Rev. A 84, 053431 (2011).
- Ravets et al. (2015) S. Ravets, H. Labuhn, D. Barredo, T. Lahaye, and A. Browaeys, Phys. Rev. A 92, 020701 (2015).
- Reinhard et al. (2008) A. Reinhard, K. C. Younge, T. C. Liebisch, B. Knuffman, P. R. Berman, and G. Raithel, Phys. Rev. Lett. 100, 233201 (2008).
- Béguin et al. (2013) L. Béguin, A. Vernier, R. Chicireanu, T. Lahaye, and A. Browaeys, Phys. Rev. Lett. 110, 263201 (2013).
- Pohl et al. (2010) T. Pohl, E. Demler, and M. D. Lukin, Phys. Rev. Lett. 104, 043002 (2010).
- Bijnen et al. (2011) R. M. W. v. Bijnen, S. Smit, K. A. H. v. Leeuwen, E. J. D. Vredenbregt, and S. J. J. M. F. Kokkelmans, J. Phys. B: At. Mol. Opt. Phys. 44, 184008 (2011).
- Schauß et al. (2015) P. Schauß, J. Zeiher, T. Fukuhara, S. Hild, M. Cheneau, T. Macrì, T. Pohl, I. Bloch, and C. Gross, Science 347, 1455 (2015).
- Lukin et al. (2001) M. D. Lukin, M. Fleischhauer, R. Cote, L. M. Duan, D. Jaksch, J. I. Cirac, and P. Zoller, Phys. Rev. Lett. 87, 037901 (2001).
- Urban et al. (2009) E. Urban, T. A. Johnson, T. Henage, L. Isenhower, D. D. Yavuz, T. G. Walker, and M. Saffman, Nat Phys 5, 110 (2009).
- Weber et al. (2015) T. M. Weber, M. Höning, T. Niederprüm, T. Manthey, O. Thomas, V. Guarrera, M. Fleischhauer, G. Barontini, and H. Ott, Nat Phys 11, 157 (2015).
- Müller and Bahadur (1956) E. W. Müller and K. Bahadur, Phys. Rev. 102, 624 (1956).
- Müller (1965) E. W. Müller, Science 149, 591 (1965).
- Ullrich et al. (2003) J. Ullrich, R. Moshammer, A. Dorn, R. Dörner, L. P. H. Schmidt, and H. Schmidt-Böcking, Rep. Prog. Phys. 66, 1463 (2003).
- Rubbmark et al. (1981) J. R. Rubbmark, M. M. Kash, M. G. Littman, and D. Kleppner, Phys. Rev. A 23, 3107 (1981).
- Wang et al. (2015) L. Wang, H. Zhang, L. Zhang, C. Li, Y. Yang, J. Zhao, G. Raithel, and S. Jia, New J. Phys. 17, 063011 (2015).
- Gallagher (2005) T. F. Gallagher, Rydberg Atoms, Cambridge Monographs on Atomic, Molecular and Chemical Physics (Cambridge University Press, 2005).
- Schwarzkopf et al. (2011) A. Schwarzkopf, R. E. Sapiro, and G. Raithel, Phys. Rev. Lett. 107, 103001 (2011).
- Schwarzkopf et al. (2013) A. Schwarzkopf, D. A. Anderson, N. Thaicharoen, and G. Raithel, Phys. Rev. A 88, 061406 (2013).
- (20) See Supplemental Material at [URL will be inserted by publisher].
- Thaicharoen et al. (2015) N. Thaicharoen, A. Schwarzkopf, and G. Raithel, Phys. Rev. A 92, 040701 (2015).
- M’́obius et al. (2013) S. Möbius, M. Genkin, S. Wüster, A. Eisfeld, and J. M. Rost, Phys. Rev. A 88, 012716 (2013).
- Killian et al. (2007) T. C. Killian, T. Pattard, T. Pohl, and J. M. Rost, Physics Reports 449, 77 (2007).
- Robicheaux (2005) F. Robicheaux, J. Phys. B: At. Mol. Opt. Phys. 38, S333 (2005).