Nereid from space: Rotation, size and shape analysis from Kepler/K2, Herschel and Spitzer observations
Abstract
In this paper we present an analysis of Kepler K2 mission Campaign 3 observations of the irregular Neptune satellite, Nereid. We determined a rotation period of P = 11.5940.017 h and amplitude of m = 0032800018, confirming previous short rotation periods obtained in ground based observations. The similarities of light curve amplitudes between 2001 and 2015 show that Nereid is in a low-amplitude rotation state nowadays and it could have been in a high-amplitude rotation state in the mid 1960’s. Another high-amplitude period is expected in about 30 years. Based on the light curve amplitudes observed in the last 15 years we could constrain the shape of Nereid and obtained a maximum : axis ratio of 1.3:1. This excludes the previously suggested very elongated shape of : 1.9:1 and clearly shows that Nereid’s spin axis cannot be in forced precession due to tidal forces. Thermal emission data from the Spitzer Space Telescope and the Herschel Space Observatory indicate that Nereid’s shape is actually close to the : axis ratio limit of 1.3:1 we obtained, and it has a very rough, highly cratered surface.
keywords:
methods: observational — techniques: photometric — astrometry — planets and satellites: individual: Neptune II Nereid1 Introduction
Nereid is a large, 350 km sized, irregular satellite orbiting Neptune in a very eccentric and inclined orbit (Dobrovolskis, 1995; Jacobson, 2009). Although its orbital characteristics are well known, there is still a mistery related to its shape, orientation and rotation rate. There have been several papers reporting on unusual, in some cases large amplitude brightness variations of Nereid on different timescales, from night-to-night variations to changes on annual scales. These investigations are nicely summarised and discussed in Schaefer et al. (2008). In this paper the authors’ preferred solution that could explain the photometric variability was that year-to-year variations are caused by Nereid’s pole precessing, in some years Nereid’s pole pointing towards Earth while in other years nearly perpendicular to the line of sight. Physically this could be explained by forced precession, due to Neptune’s tidal torque on a non-spherical Nereid. This would require high, 1.9:1 or greater axis ratios.
Hesselbrock et al. (2013) attempted to model the rotation of Nereid in a way similar to Schaefer et al. (2008), but also considering the effect of smaller bodies in addition to the Sun and Neptune, especially that of Triton. Their "best estimate" solution is a triaxial ellipsoid with semiaxis ratios of c/a0.5, b/a0.6, an inital obliquity of 60° and an initial rotation period of 144 h. Their model predicts "active" and "inactive" periods, depending on the actual direction of the main spin axis (c-axis aspect angles of 90° and 0°, respectively), matching the photometry data collected in Schaefer et al. (2008) qualitatively, however, with some differences in the predicted brightness levels compared with the observed ones. They explain this latter discrepancy by an additional effect of a non-uniform albedo distribution. Their model predicts a 15-year time between the two extreme orientations.
While the shape of Nereid would be essential for the rotation evolution models, this is not known. Thomas et al. (1991) derived a size of 35050 km from Voyager-2 flyby observations in which Nereid was resolved to some level, but the quality of the data was not good enough to constrain the shape (see also Schaefer et al., 2008, for a discussion).
Based on observations in August 2001 and August 2002 Grav, Holman & Kavelaars (2003) derived a short rotation period of P = 1152 for Nereid with a small peak-to-peak light curve amplitude of 00290.003. This rotation period was later questionned by Schaefer et al. (2008) due to the relatively poor sampling of the rotation curve, and has not been included in the analysis by Hesselbrock et al. (2013) either. Terai & Itoh (2013) obtained a very similar light curve (m = 00310001, P = 1150010) based on observations in 2008, but their light curve was sparsely sampled in terms of rotational phase.
As shown above, ground based observations have not placed a strong constraint on the rotation of Nereid. However, as it has been demonstrated in some recent papers (Pál et al., 2015a, b), data from the extended Kepler mission (K2, Howell et al., 2014) can be very effectively used to obtain rotational light curves of distant Solar System bodies due to uninterrupted photometric time series of several tens of days in length. Given that Neptune, and therefore Nereid as well, was included in the Campaign 3 observations of the K2 mission, we attempted to obtain the light curve of Nereid from these observations. In addition to the light curve data, we collected archival Spitzer Space Telescope and Herschel Space Observatory data to detect the thermal emission of Nereid in the mid- and far-infrared (24–160 m) wavelength ranges. In this paper, with the synergy of the light curve information and thermal emission data, we put important constraints on the rotational state, shape, as well as on other physical properties of Nereid.
2 The Kepler K2 light curve
2.1 K2 observations
Kepler observed Nereid during the third campaign of the extended mission, named K2 (Howell et al., 2014). In this K2 mission, Kepler targets fields near the Ecliptic, observing each field for approximately three months. This quarterly schedule allows the continuous observations of Solar System bodies if sufficiently large arcs are allocated in the CCD mosaic of the Kepler space telescope. Main-belt asteroids have a large apparent motion (comparable to or even larger than the total field-of-view of the space telescope). In addition, main-belt asteroids have a non-negligible noise source on the photometry of stellar targets (Szabó et al., 2015). However, minor bodies outside the main-belt – such as Centaurs and trans-Neptunian objects – can be observed with a relatively low pixel budget. In addition, the pixel budget can even be minimized around the stationary point, where masks with a size of pixels can be sufficient to follow trans-Neptunian objects up to days (Pál et al., 2015a).

In the case of Nereid, a nearly parallelogram-shaped field was allocated for Kepler/K2 observations. This field includes the apparent track of both Neptune and Nereid and has a size of pixels. This field is located on Kepler module #13 and read out by its output amplifier #2 (i.e. channel #42 considering the full mosaic array). In order to analyze the field, we retrieved the individual data frames corresponding to the columns of this parallelogram-shaped CCD area. Thereafter, we built the individual image frames on a rectangular area having a size of . This area safely covers the parallelogram and includes some additional rows and columns in order to have same extra space for frame registration. In total, the corresponding data series contains individual and useable long-cadence frames. The total number of frames for Campaign 3 were , but frames had to be dropped due to lack of data or inappropriate tracking during the exposure.
Due to the lack of a third active reaction wheel, the positioning jitter of Kepler/K2 is significantly larger than what it had been during the main mission. Therefore, the frames have to be analyzed independently in order to retrieve the proper astrometric solution as well as to perform an image registration needed by the subsequent steps of differential photometry. To accomplish this astrometry, we selected nearly a dozen reference stars distributed uniformly in the field. Due to the large size of the field, we did not include additional stamps for this purpose (see e.g. the case of 2007 OR10, Pál et al., 2015b). These stars were used to perform both the differential astrometry (i.e. the frame registration) and the absolute astrometry (i.e. finding the plate solution w.r.t. the J2000 system). The absolute plate solution has been derived by cross-matching the pixel coordinates of the selected reference stars with the USNO-B catalogue (Monet et al., 2003). These stars were also used to transform Kepler/K2 photometry to USNO-B1 R system. The USNO magnitudes of these star cover the range of , nearly homogeneously. Since an unfiltered CCD efficiency curve can be considered as a “wide R” band, the comparison of the USNO magnitudes with the instrumental ones yielded a fit residual of magnitudes. Therefore, we can state that the accuracy of this transformation is in this range.
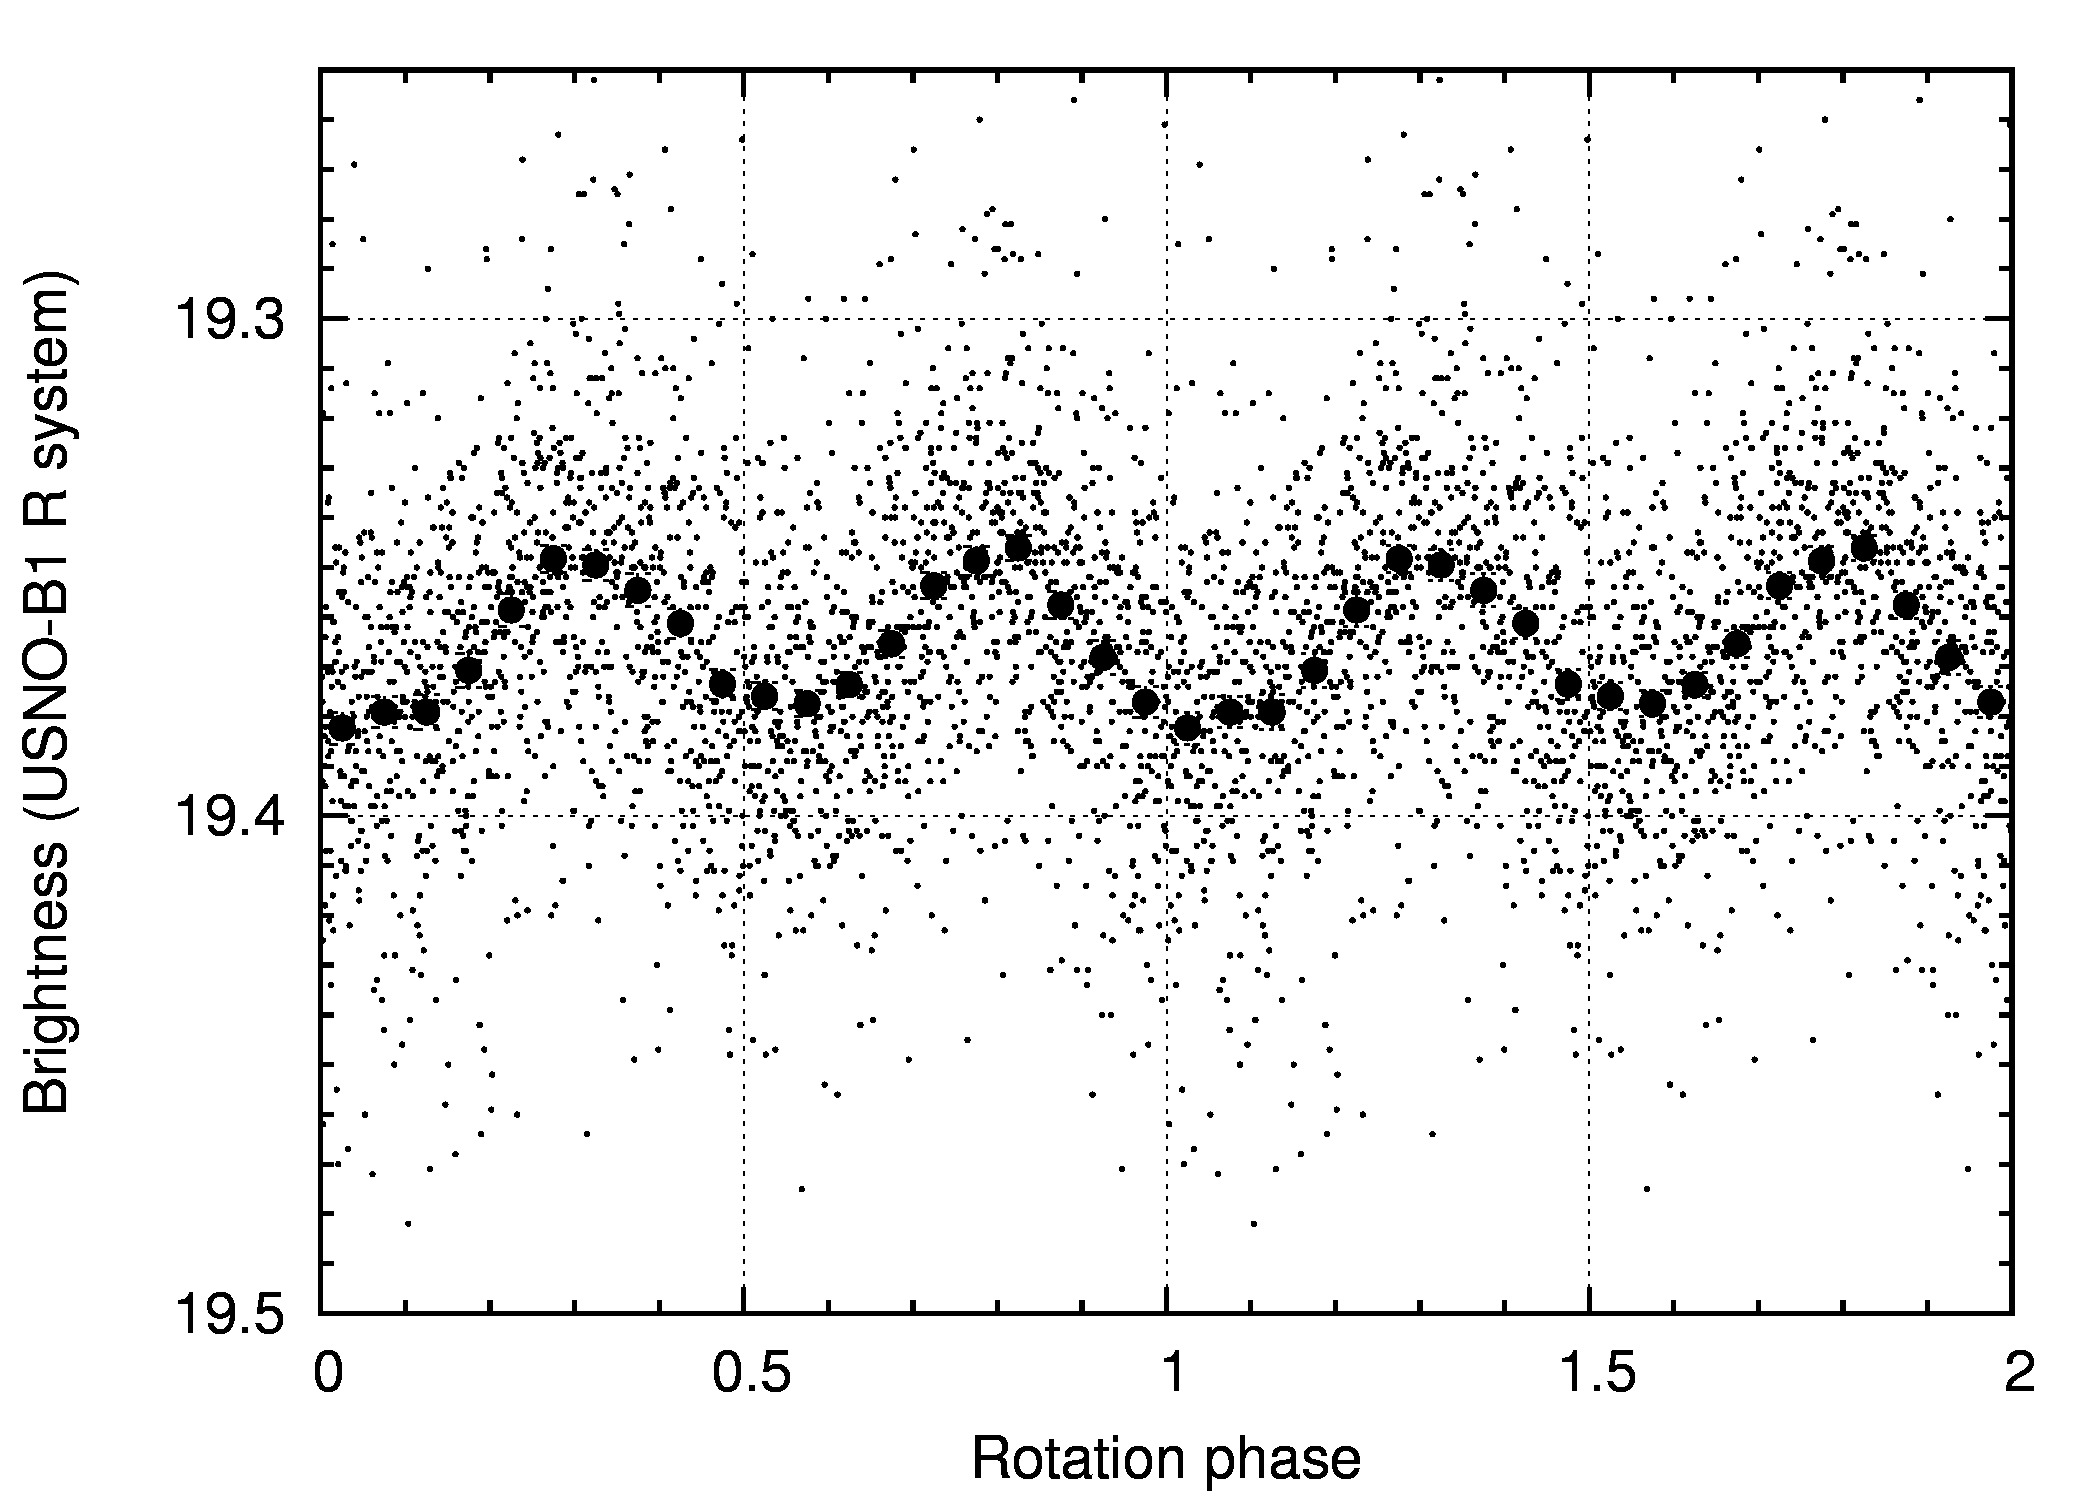
In all other aspects, the data reduction and photometry were conducted in a similar manner as it was described in Pál et al. (2015a) or Pál et al. (2015b). Our photometric pipeline used for Kepler frame reconstruction, source extraction, astrometry and cross-matching, image registration and differential photometry are based on the various tasks of the FITSH package (Pál, 2012). The folded light curve (with the period of , see Sect. 2.2) of Nereid is shown in Fig. 2. We note here that the formal photometric uncertainities on the individual frames increased from up to throughout this days long campaign. This increment is due to the gradually increasing level of zodiacal light as the elongation of Nereid decreased from down to . This instrumental uncertainity can be compared with the statistical one computed from the root mean square deviation of the photometric data points on each of the bins on the binned light curve. This latter method gives us an estimation of error for each frame, i.e. slightly larger than the instrumental estimate.
2.2 Light curve analysis
Based on previous studies in the literature, the expected amplitude of the light curve variations are relatively small. Therefore, periodicity in the light curve has been searched by assuming a sinusoidal function coadded to a linear function representing the gradual fading of the object (due to phase angle and distance variations). This function was defined as
| (1) |
where is the suspected rotational frequency and is the time after (chosen in order to minimize the rounding errors and numerical artifacts). The unknown parameters , , and can then be derived using linear regression. The parameter space in is then scanned in the physically relevant domain with a stepsize comparable to one tenth of the reciprocal timespan of the observations (i.e. ). A prominent peak has been detected in the fit residuals at , as it can also be well seen in Fig. 2b. The corresponding values for the four coefficients at this peak was found to be , , and . The hypotenuse of and , i.e. gives us an estimation for the total amplitude which is then . The residual of the fit was found to be magnitudes. Due to the significance of this peak, we conclude that the rotation period is either or its double, , assuming a double-peaked solution. The amplitude of the light curve is 0016400008 (0032800018 peak-to-peak). To correct for phase angle effects, a phase constant of k = 0.1230.005 mag deg-1 was also derived from our K2 data (Nereid was seen at phase angles of 12 19 during the K2 observations).
The light curve we found is very similar to those obtained by Grav, Holman & Kavelaars (2003) and Terai & Itoh (2013), both in rotation period (1152014 and 1150010), and amplitude (00290003 and 00310001). In Sect. 2.3 we analyse in detail the consequences of the similarities of these light curves obtained over a 15-year period.

2.3 Spin axis constraints
The similarity of the 2001, 2008 and 2015 light curves puts constraints on the actual spin axis orientation. First, due to the short rotation period with respect to the orbital period (360 days) the precession time of the spin axis is long, at least a few hundred years, even if very elongated body and/or high original obliquity are assumed (Dobrovolskis, 1995). This suggests that the spin axis of Nereid remained in approximately the same direction in the last 15 years. However, Neptune (and hence Nereid) moved on its orbit about 30° along the ecliptic in the last 15 years, and therefore the aspect angle of the spin axis should have changed with respect to the observer even if it was otherwise pointing in the same direction in space in this period. The position angle depends on the ecliptic coordinates of the target (, ) as well as on that of the spin axis’ direction (, ):
| (2) |
If we assume that the shape of Nereid is a triaxial ellipsoid with semi-axes of then the object seen at a spin axis aspect angle will show a light curve with an amplitude of:
| (3) |
Here we assumed that the light curve is solely caused by shape effects and there are no albedo variegations on the surface. Due to the small phase angles the phase angle correction of the light curve amplitude is negligible. We characterise the semi-axis ratios of the triaxial ellipsiod by an axis ratio parameter . With this parameter the semi-axes of the ellipsoid are:
| (4) |
and the body rotates around its shortest () axis.
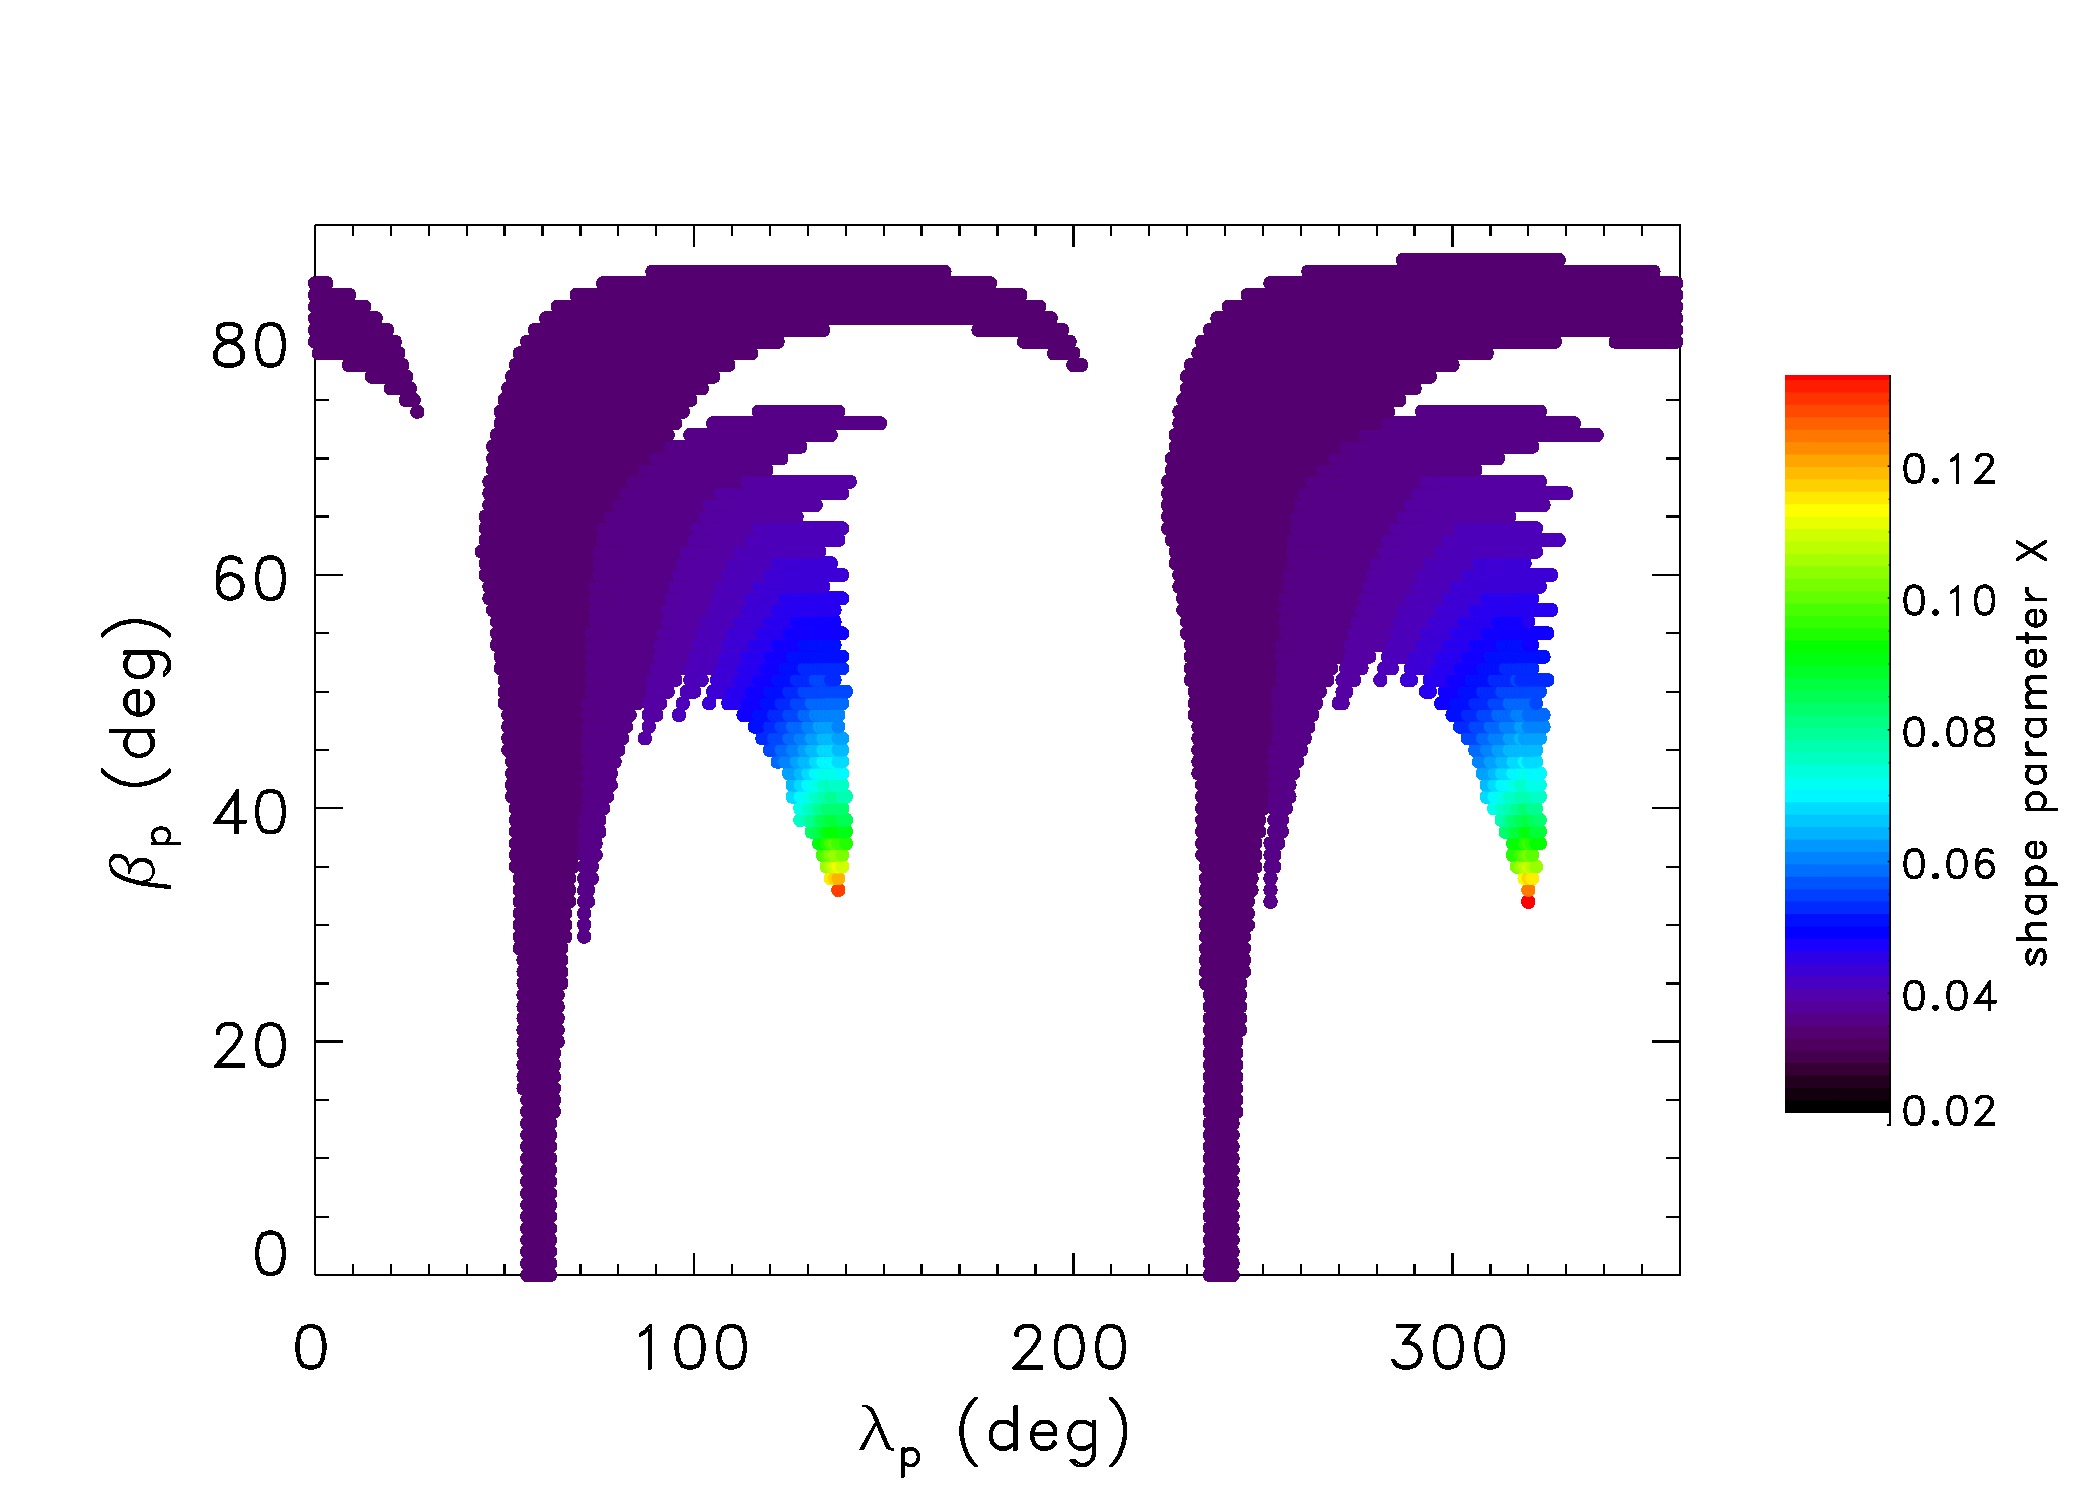
With this assumption, and using the equations above, we calculated those {} combinations for which corresponds to the observed light curve amplitues by Grav, Holman & Kavelaars (2003) in 2001-2002 ( = 00290003), Terai & Itoh (2013) in 2008 ( = 00310001) and by us in 2015 ( = 0032800018) within the given uncertainties. In the case of the Terai & Itoh (2013) data we found the originally quoted uncertainties to be too optimistic. Our analysis of their photometry gives an amplitude uncertainty of 00026. We used this latter value in the spin axis orientation analysis.
We originally assumed X in the 0.03 – 0.34 range. The lowest value of X corresponds to the smallest possible X value that could produce a light curve compatible with the observations if = 90°, while the highest value corresponds to a 2:1 : axis ratio, suggested e.g. by Hesselbrock et al. (2013). The results are plotted in Fig. 3 where the different colours mark the different axis ratio parameter values. Most of the allowed {} pairs belong to a small X value, i.e. to a slightly elongated shape with an axis ratio of : 1.06:1. The largest possible axis ratio parameter value we obtained is X = 0.133. Larger X values are not allowed by the amplitude constraints and hence more elongated shapes (X 0.133) are excluded.
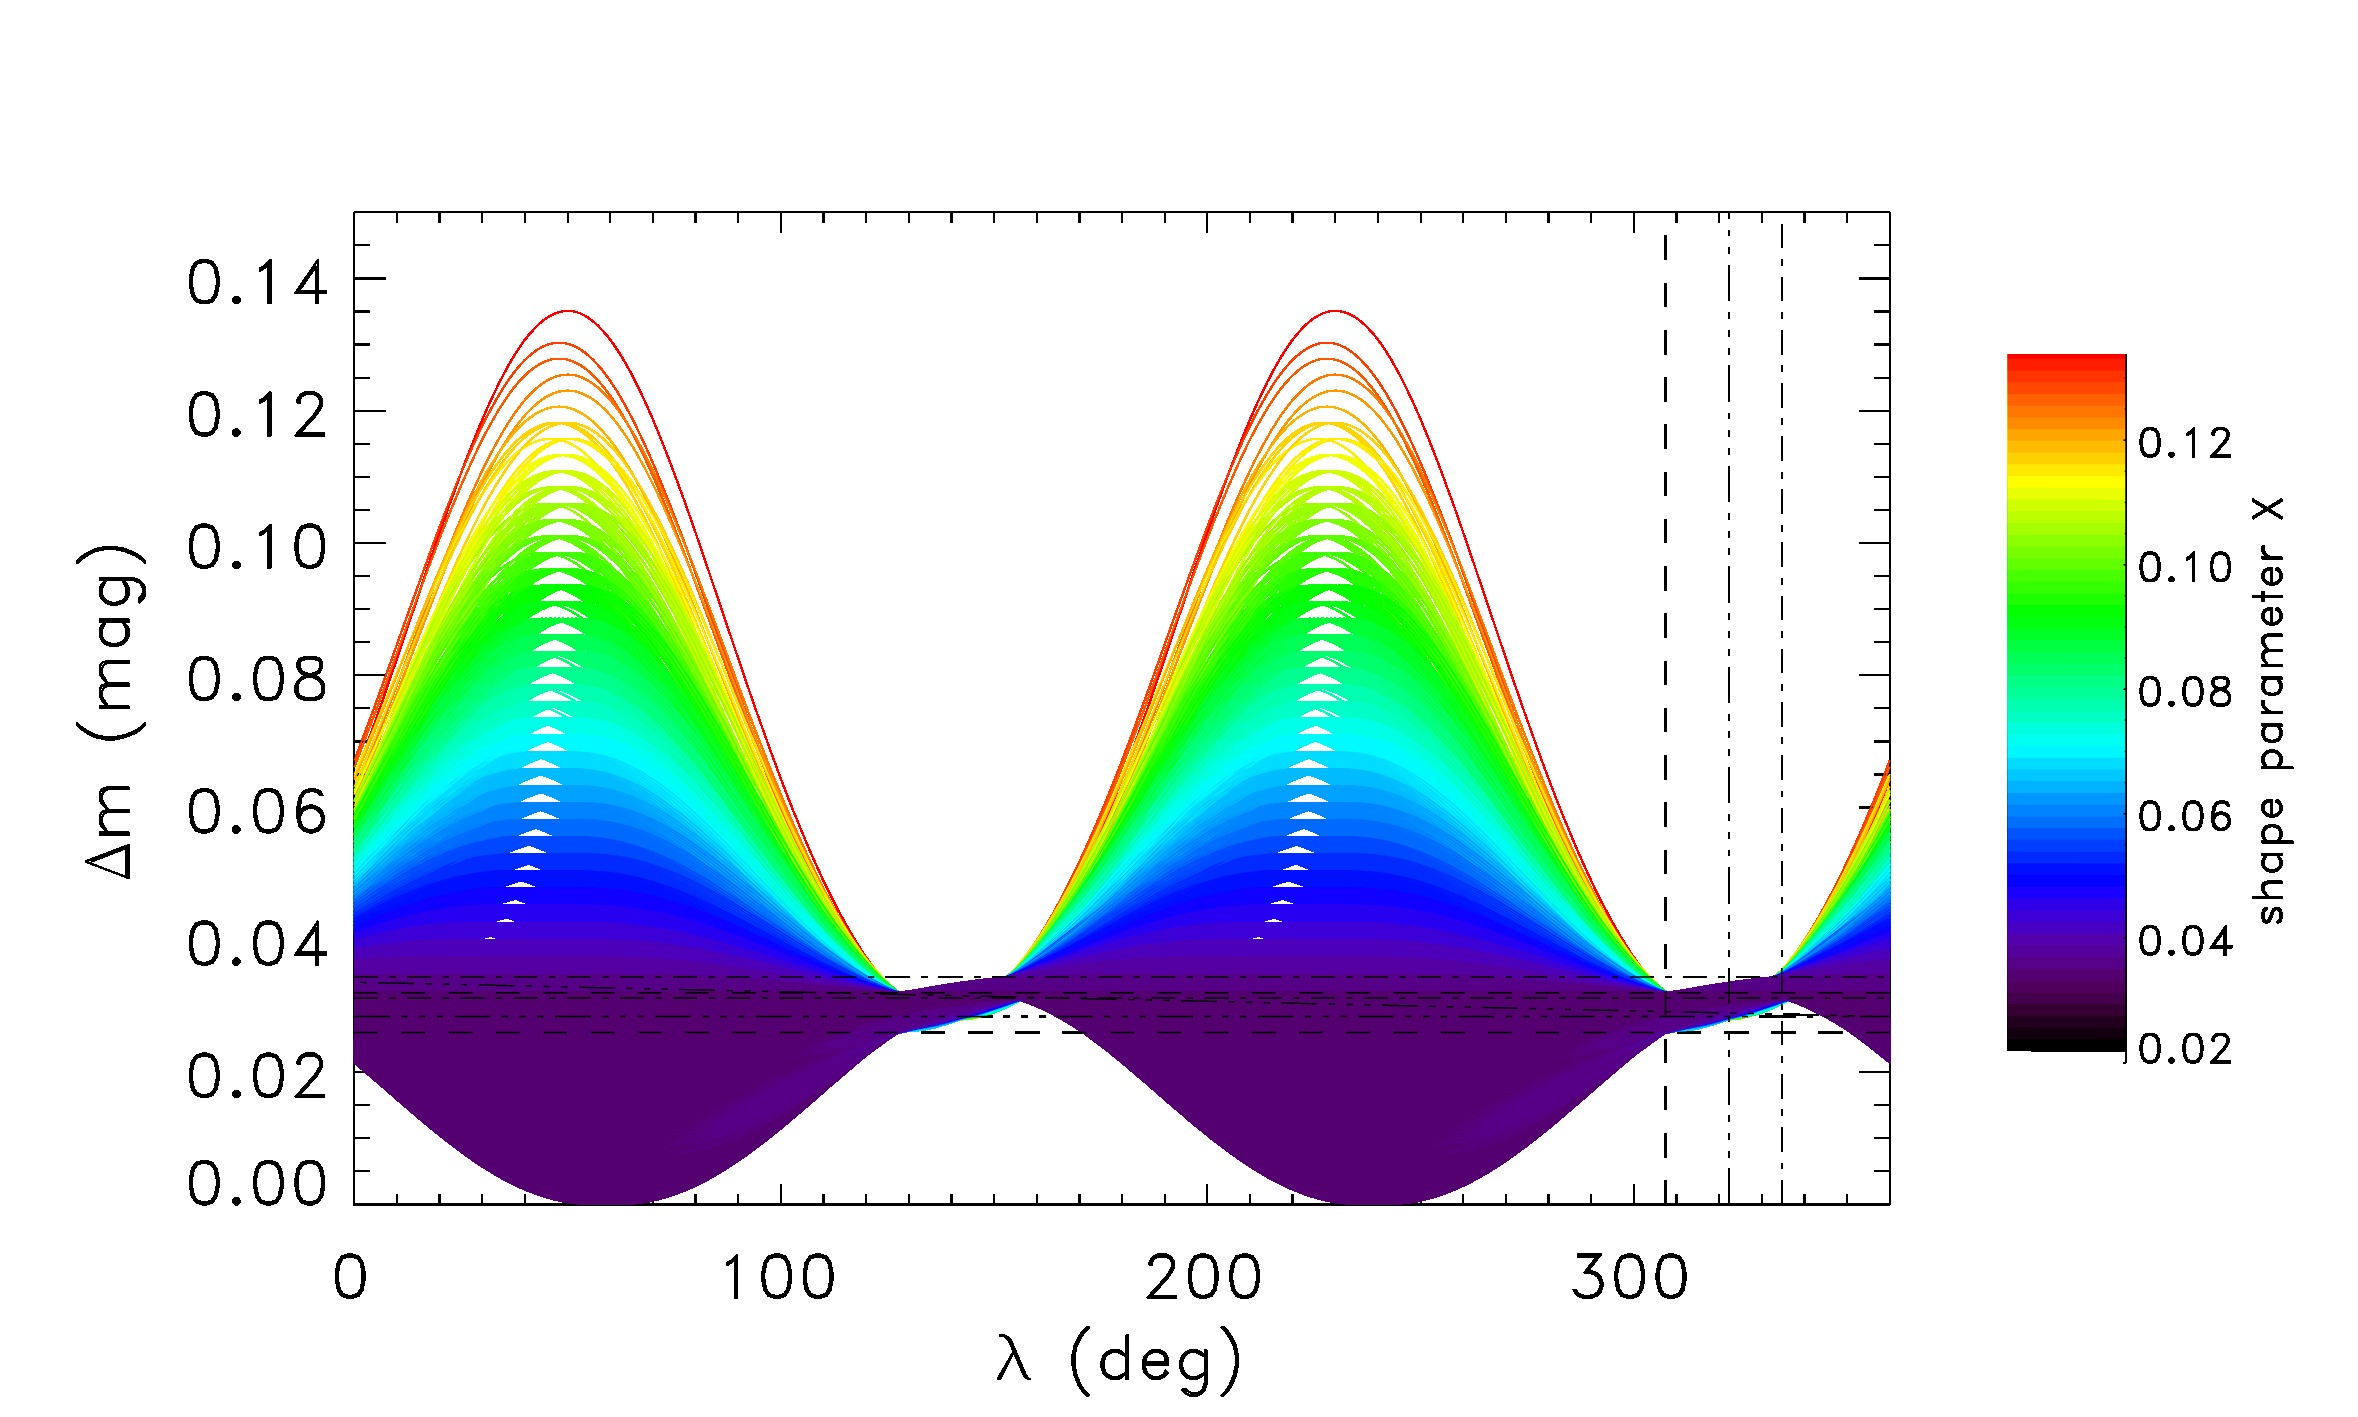
We checked how the light curve amplitude evolves in the different cases allowed by the 2001, 2008 and 2015 light curve amplitude constraints. In Fig. 3b we present the light curve amplitude variation as a function of ecliptic longitude. At the observation epochs between 2001 and 2015 (ecliptic coordinates marked by vertical lines in the figure) the light curve amplitude does not change notably and remains low, irrespective of the shape of Nereid. While there are many solutions in which the amplitude remains low (slightly non-spherical cases, purple curves) along the solar orbit of the Neptune-Nereid system, there are also cases when Nereid appears notably elongated and the light curve amplitude changes remarkably with the orbital phase around the Sun (cases marked with green to red). In these latter cases Nereid could have had its highest amplitude period in the 1960’s, and still could have notably higher amplitudes in the 1980’s than what we can see today. Another peak in the light curve amplitude would be expected in 30 years. The maximum possible light curve amplitude is = 013.
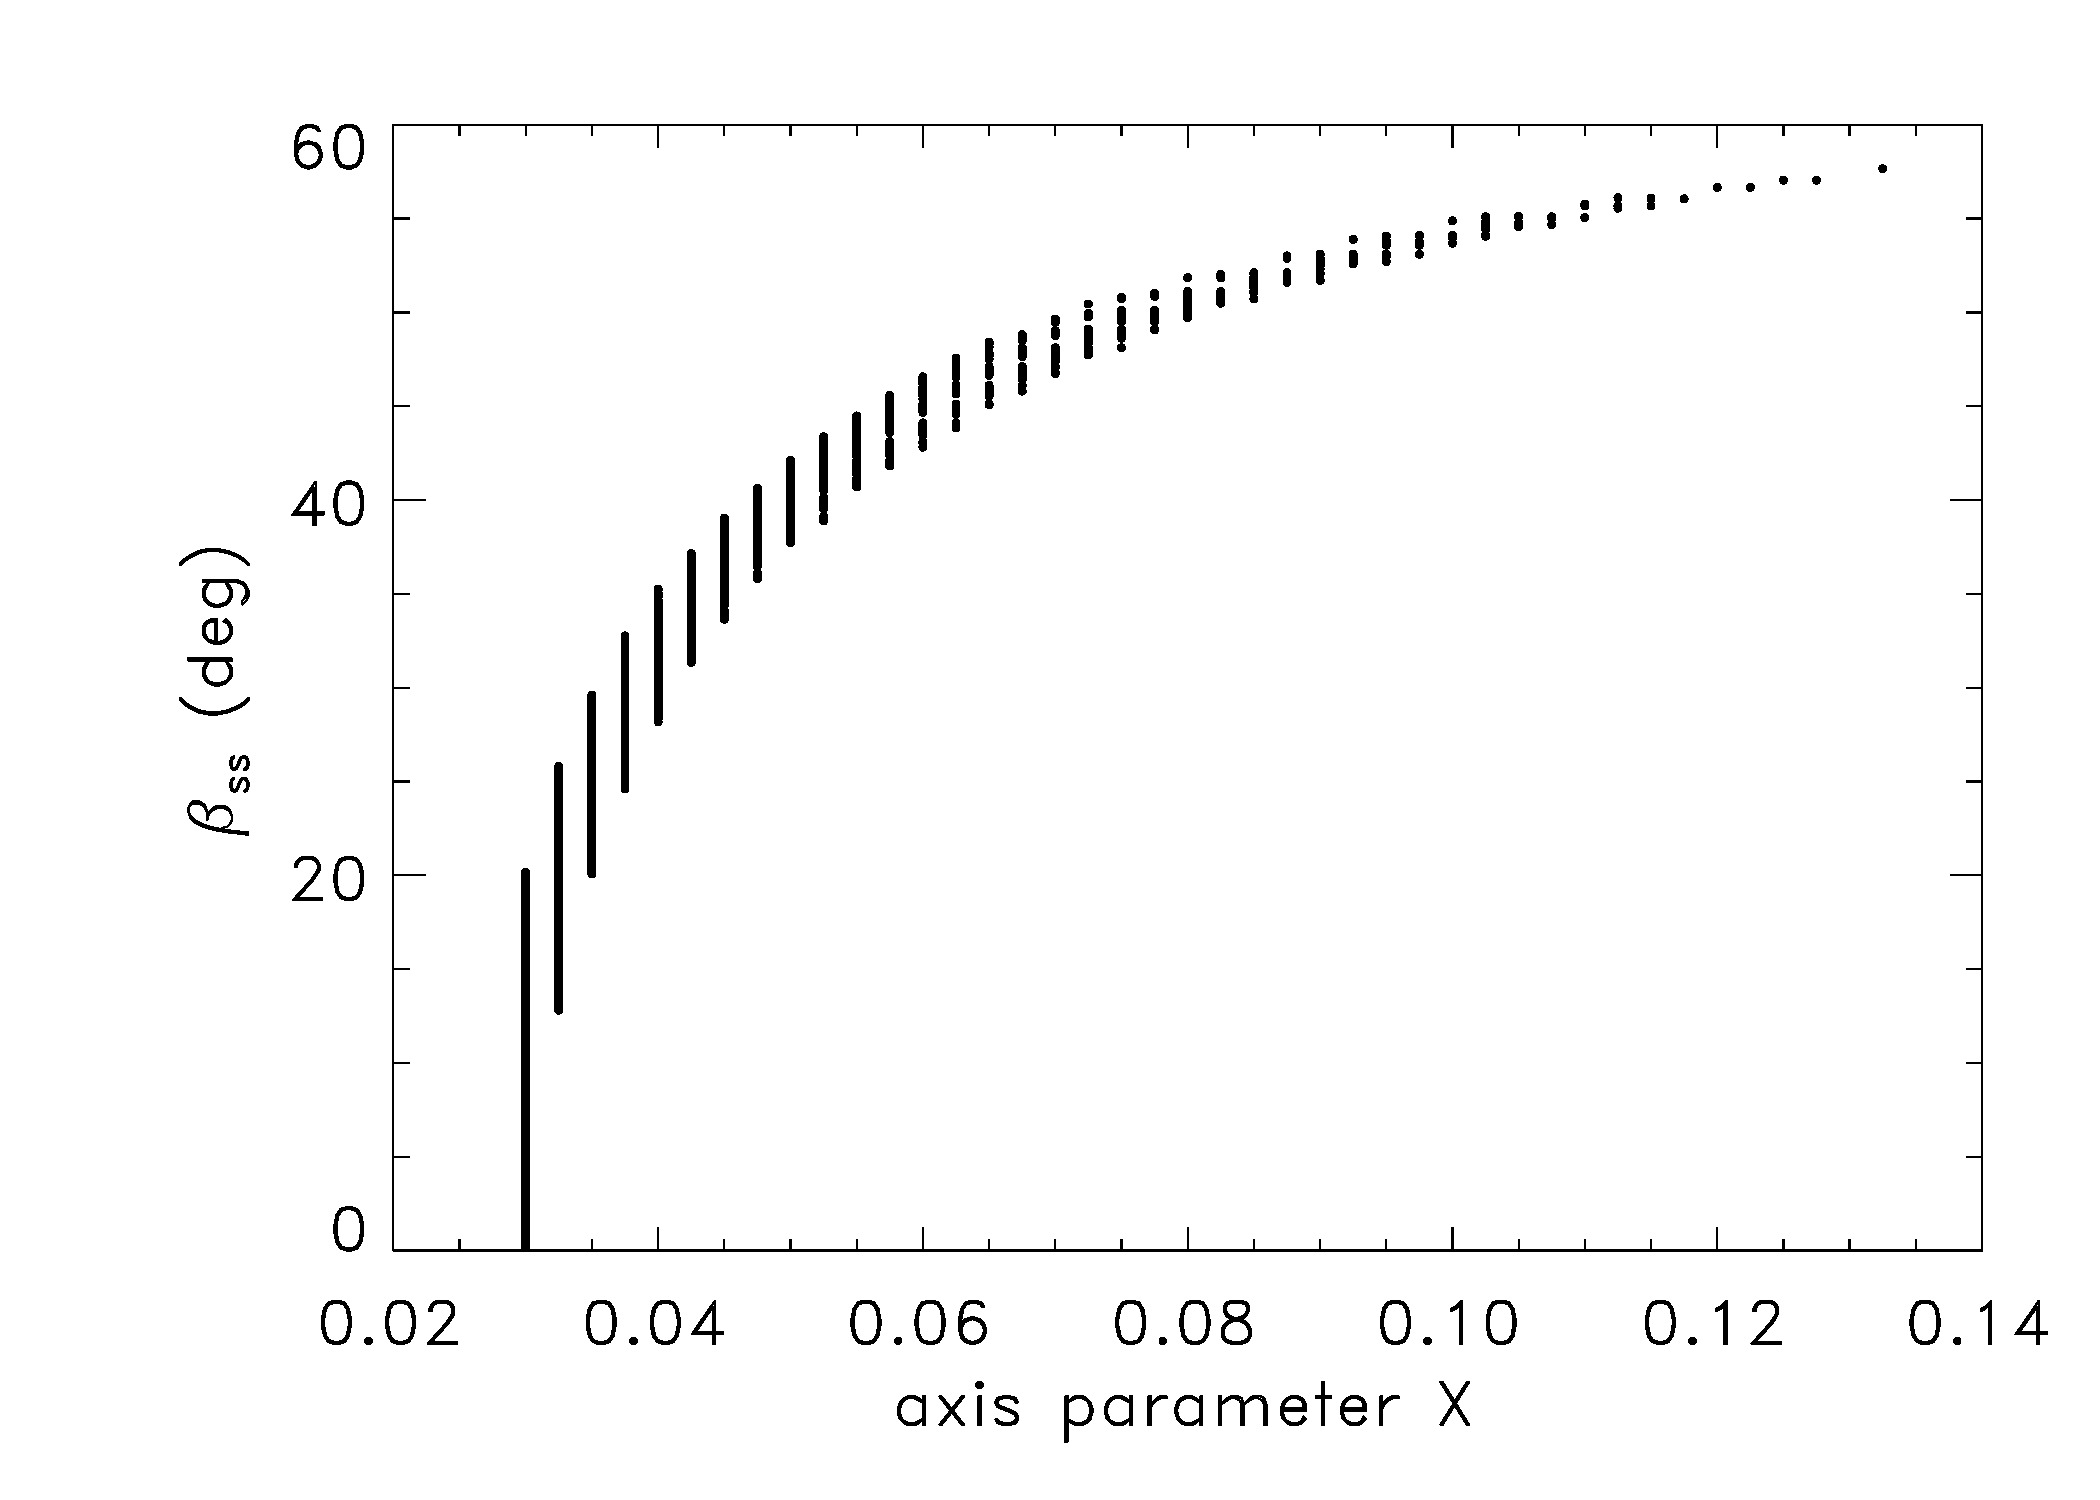
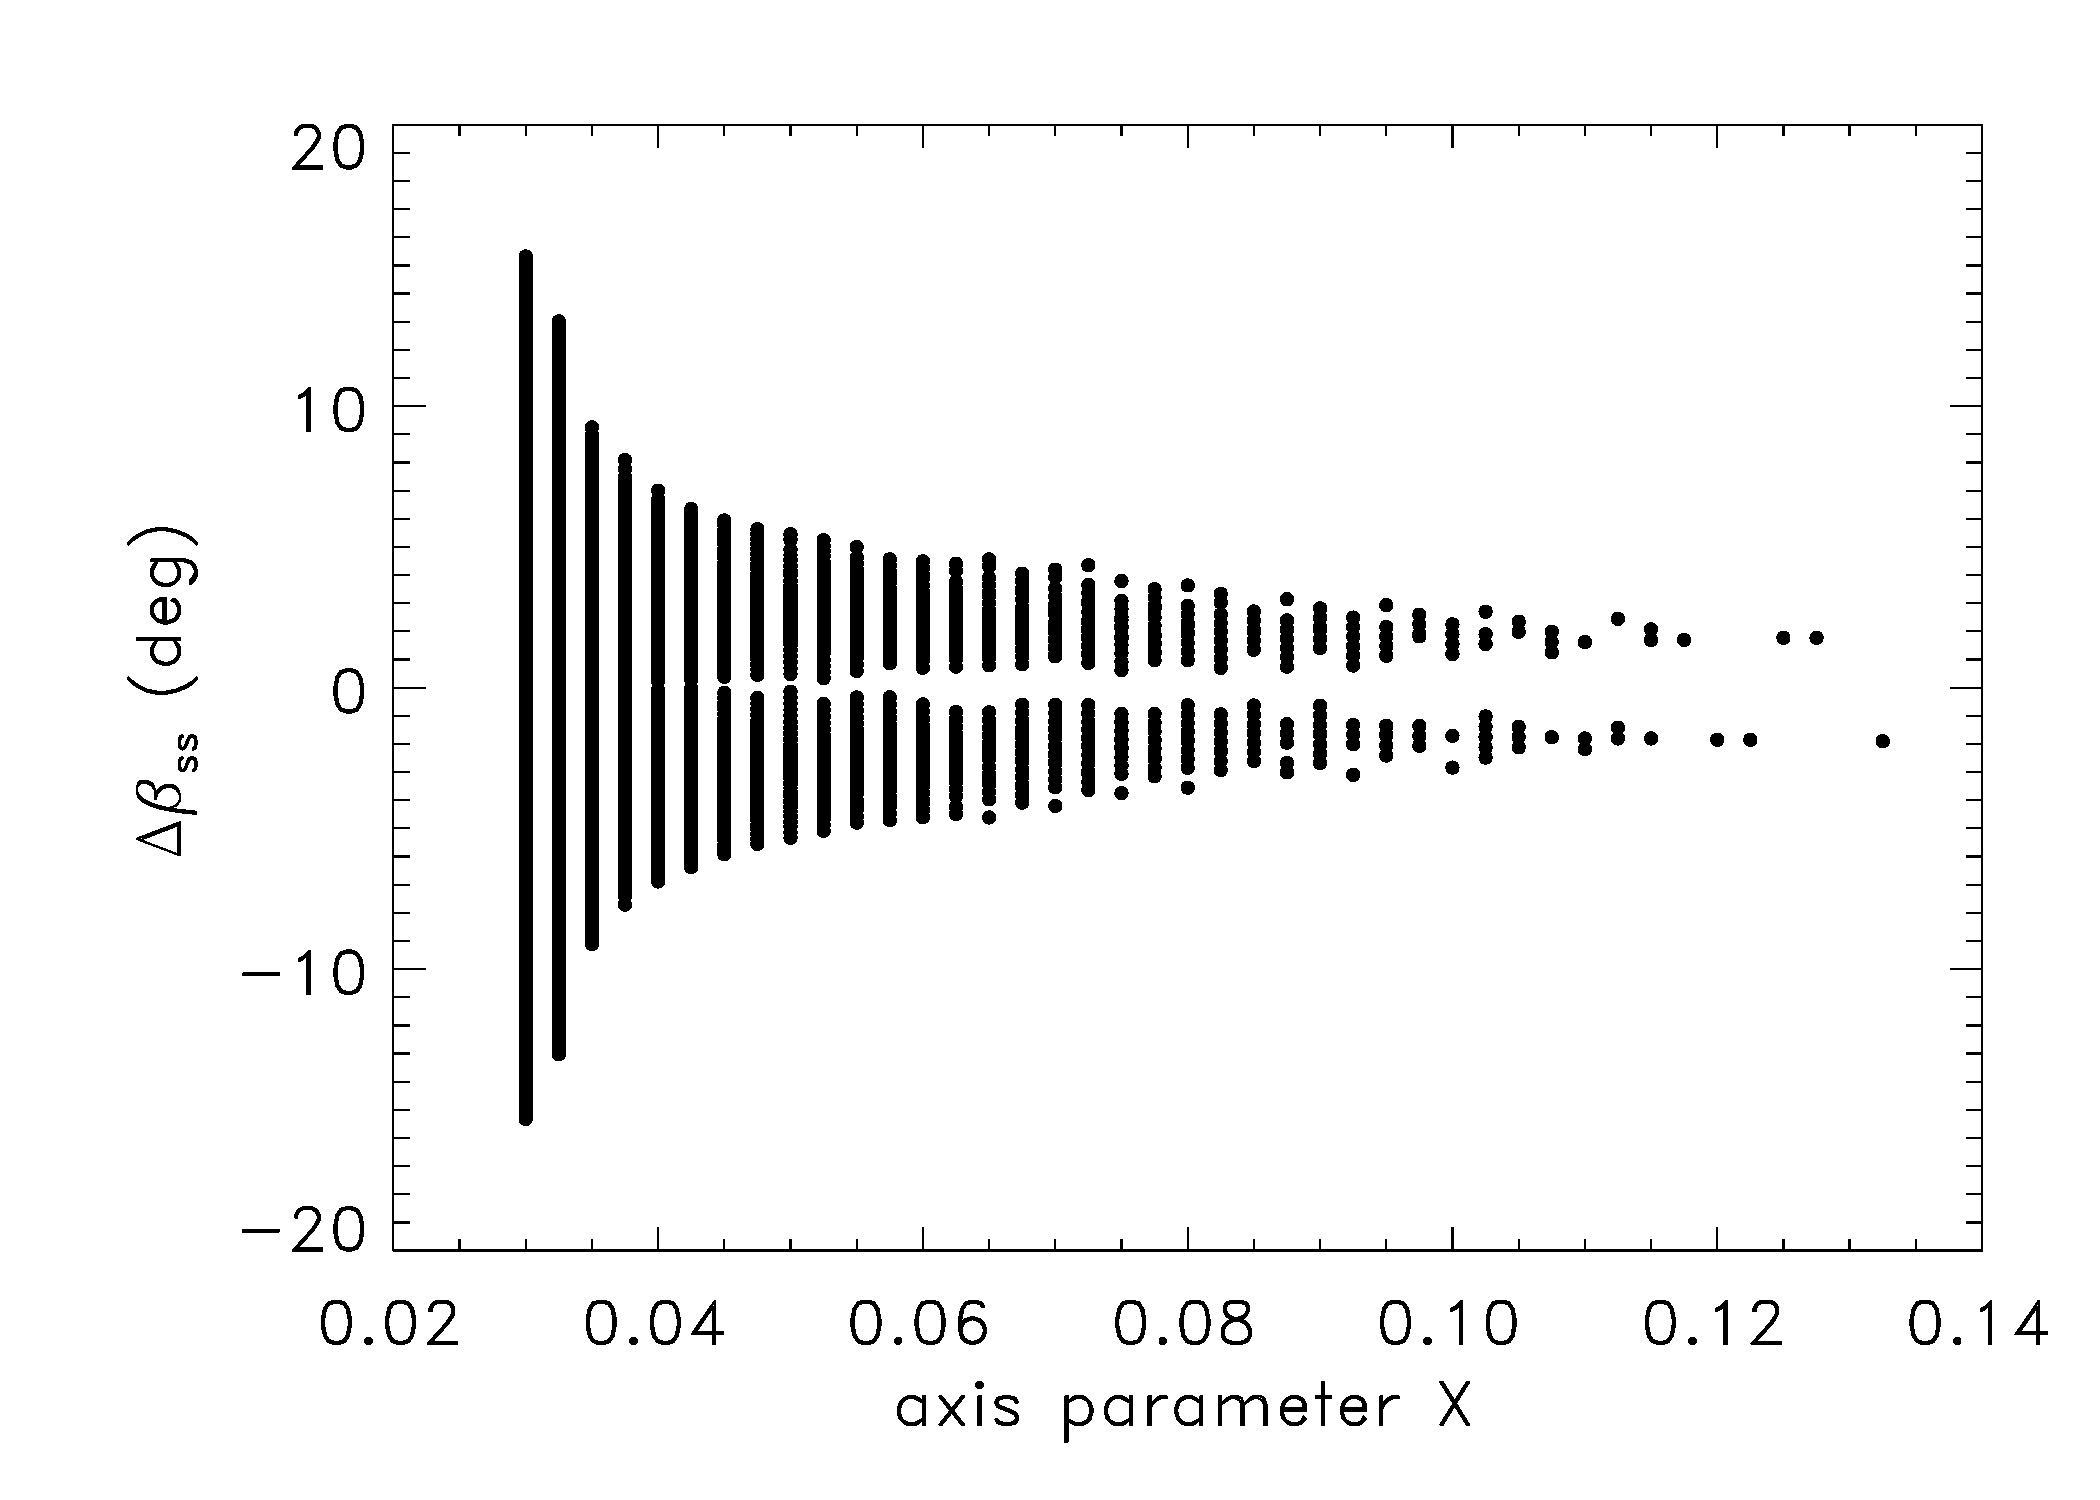
For the thermal emission models that we discuss in Sects. 3.3 and 3.4 it is important to see how the spin axis aspect angles and the subsolar latitudes could change with time. We plotted the subsolar latitude as a function of the axis ratio parameter X in Fig. 4a for the allowed configurations at the epoch of the Spitzer/MIPS observations. The subsolar latitudes show a well defined relationship with the axis ratio parameter: at low X values is close to zero (equator-on configurations) then it rises quickly and reaches a maximum value of 60° for the largest possible values of X. While can change notably between the MIPS and PACS epochs (up to 15 °) for low X values, the change is rather small for higher axis ratio parameters (see Fig. 4b).
3 The thermal emission of Nereid
3.1 Herschel Space Observatory measurements
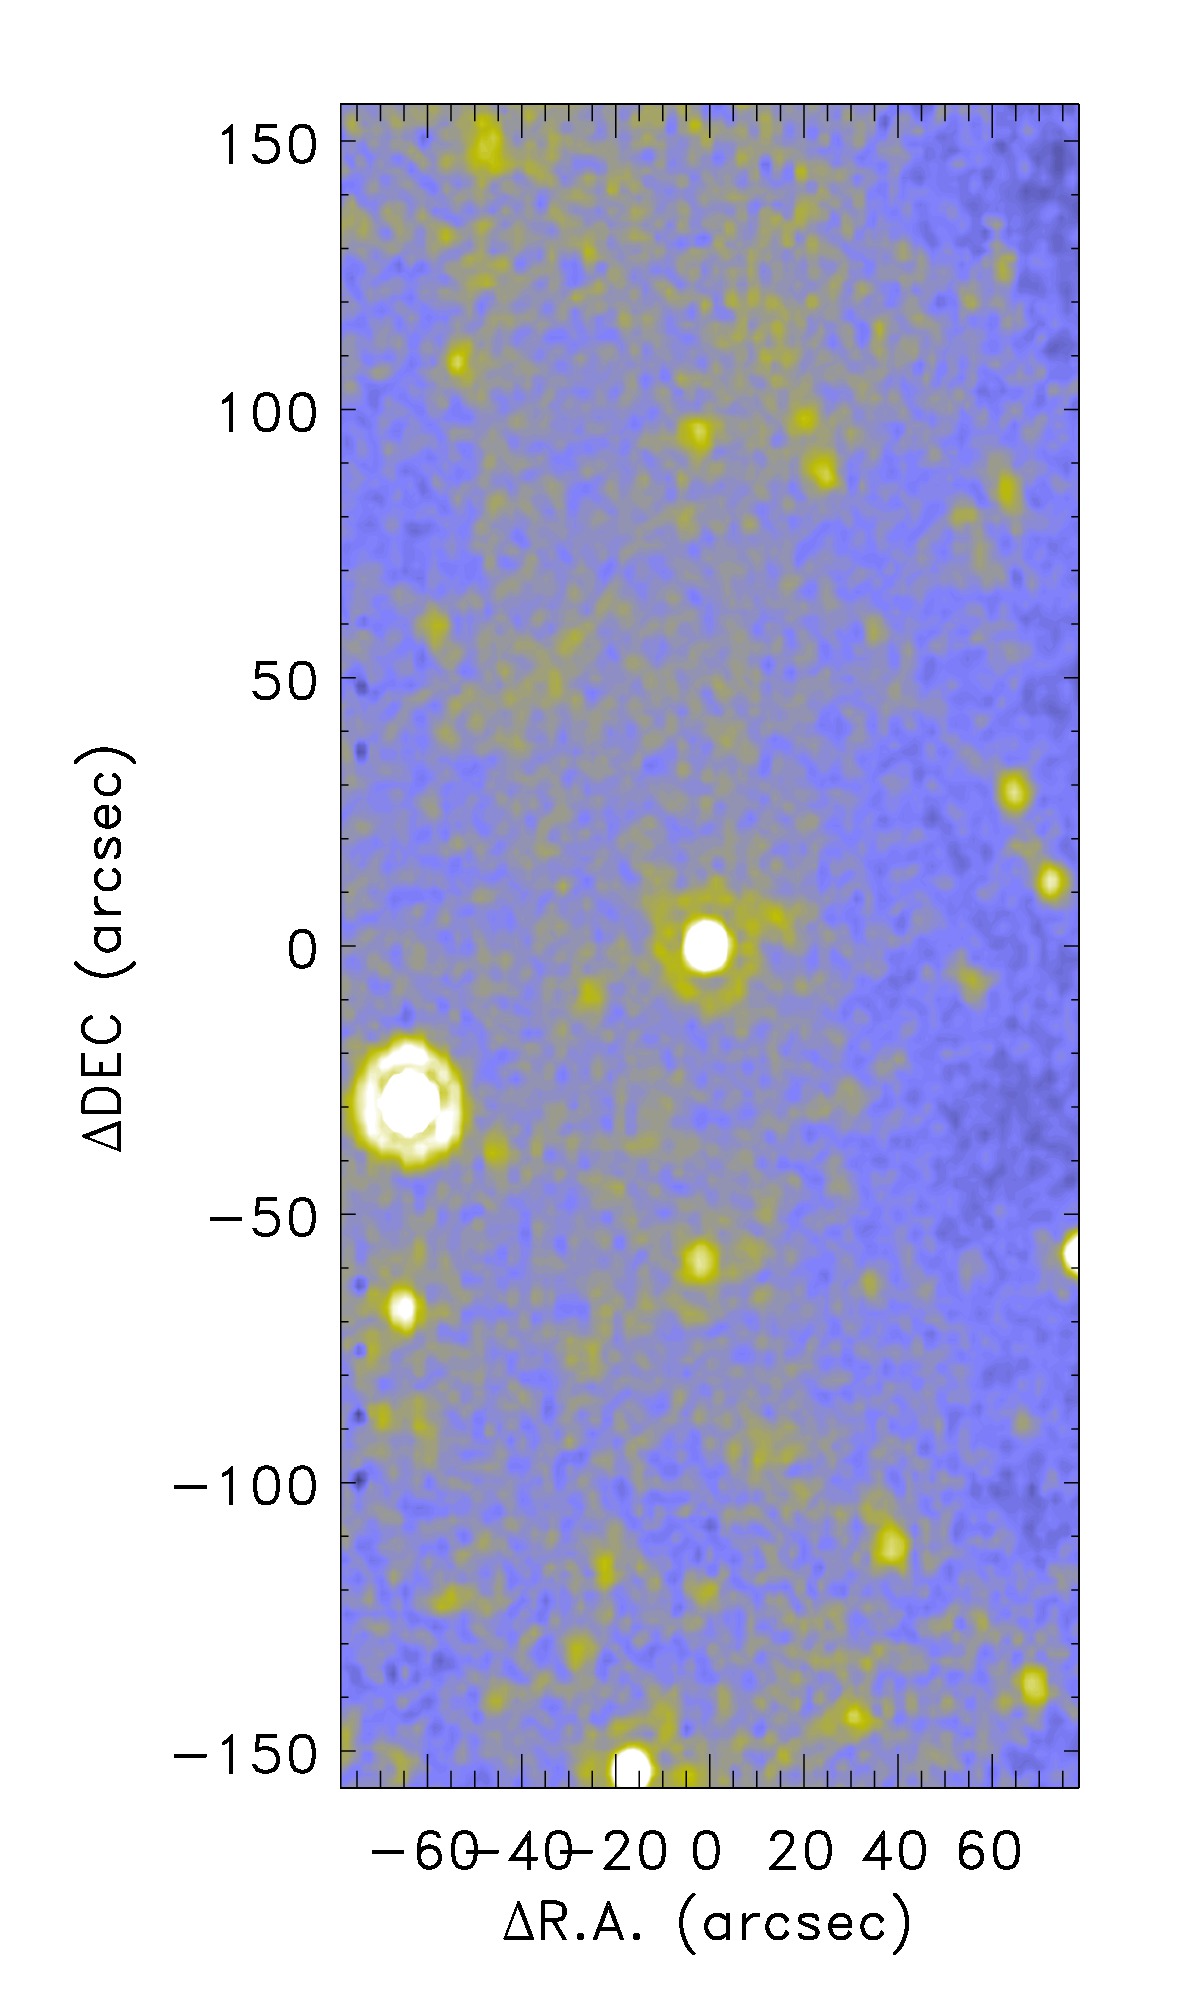
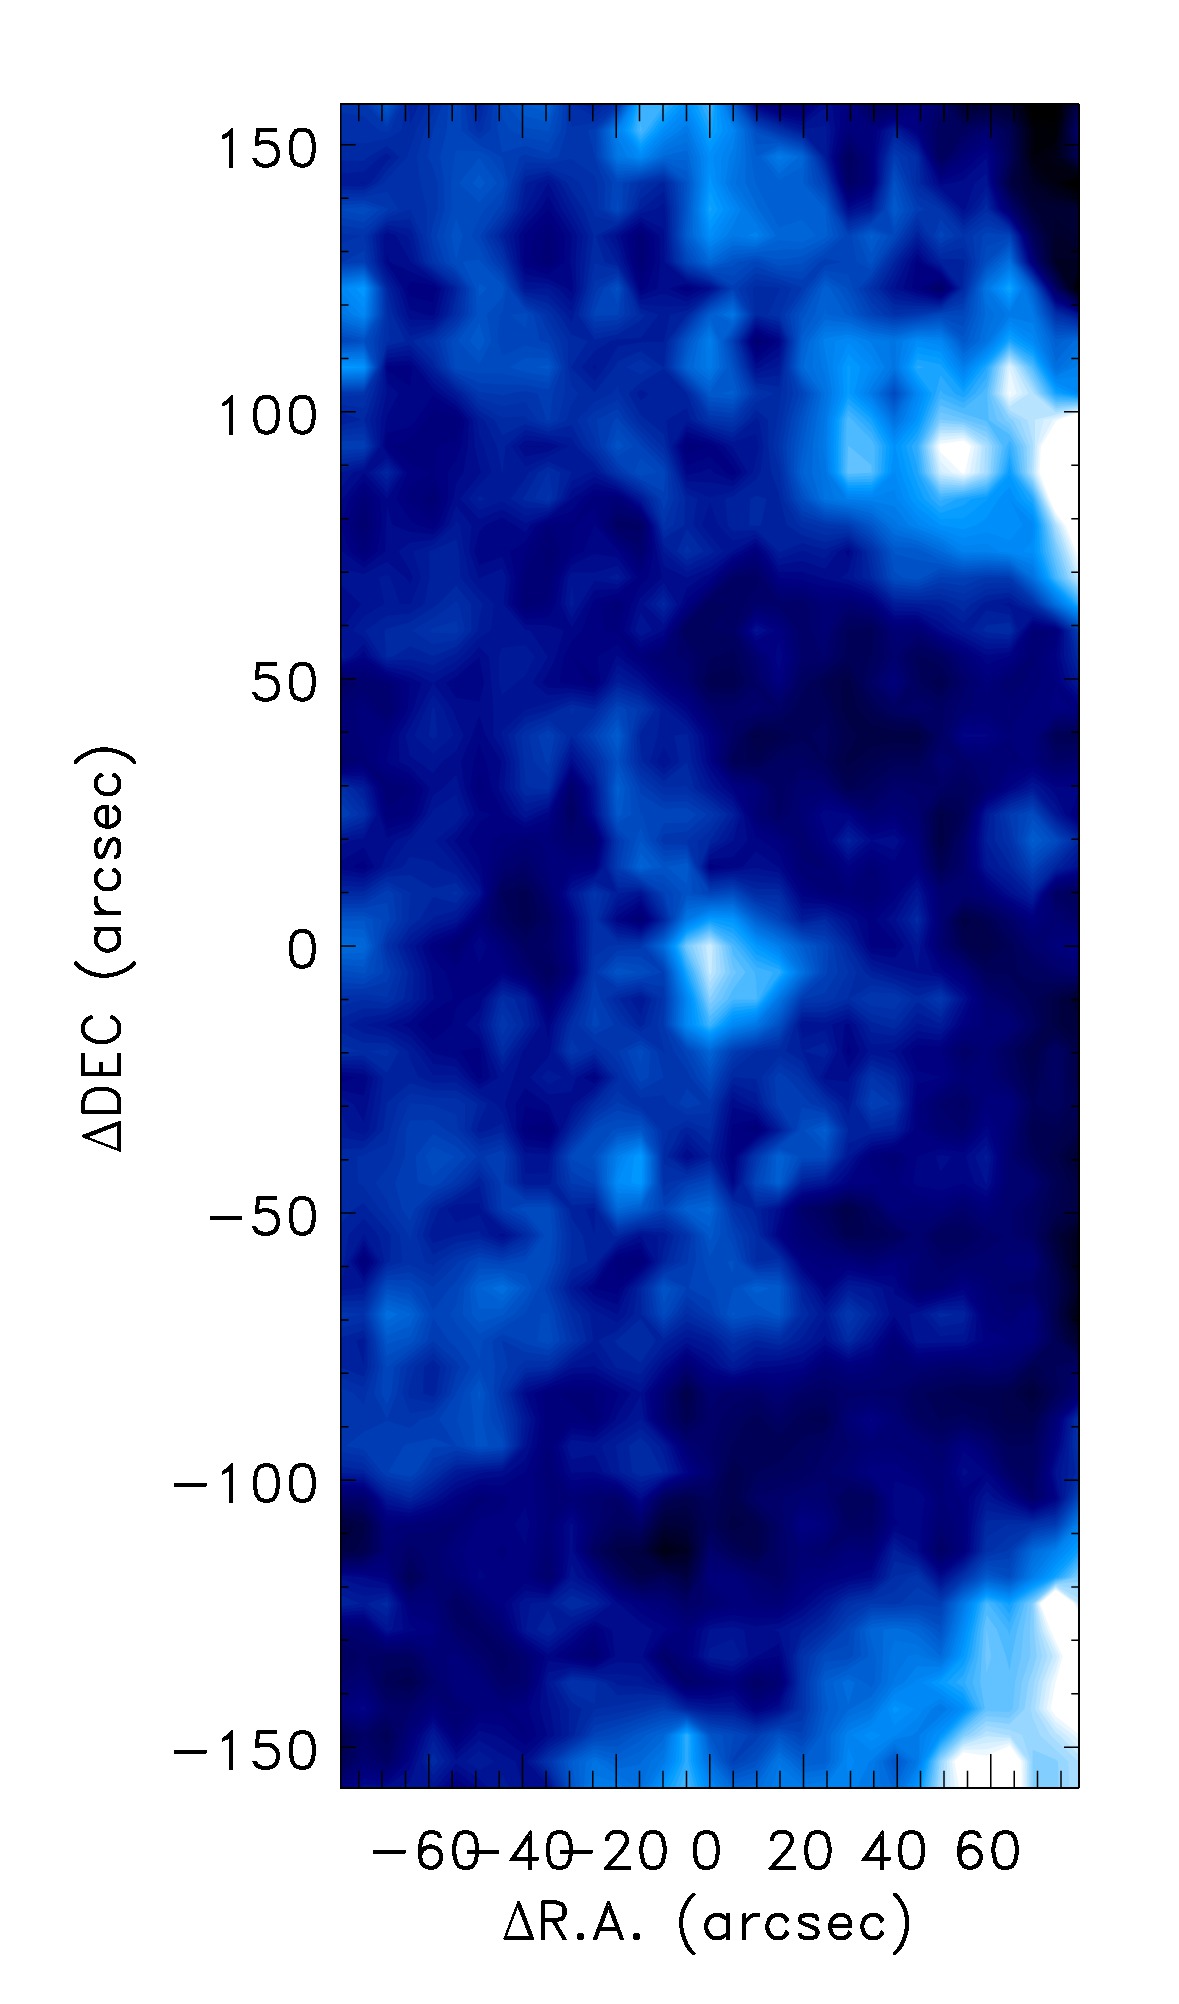
We have found Nereid in archival Herschel Space Observations data (proposal ID: OT1_ddan01_1). The original target in these observations was Neptune, and Nereid was just accidentally on the images (see Fig. 5). Four observations were taken with the PACS (Photometer Array Camera and Spectrometer Poglitsch et al., 2010) photometer camera on board the Herschel Space Observatory (Pilbratt et al., 2010), using the 100/160 m filter combination in all four cases. The data reduction pipeline we used is the same as the one used in the "TNOs are Cool!" Herschel Open Time Key Program (Müller et al., 2009), described in detail in Kiss et al. (2014). As our aim was to obtain photometry of a point source, we used the photProject() task with high pass filtering to create maps from the time domain detector data. The images of the four consecutive measurements were stacked in the co-moving frame of Nereid, and aperture photometry was performed on the stacked 100 and 160 m images. Flux uncertainties were determined with the implanted source method (Kiss et al., 2014), but in this case using a 80″area around Nereid rather than the high coverage regions of the whole map. As the apparent movement of the target was very small during the measurements we were not able the perform any kind of background correction. We clearly detected Nereid in both bands, and the photometry provided F100 =22.81.7 mJy and F160 =18.6 2.9 mJy in-band flux densities at 100 and 160 m, respectively.
| Instrument | Obs. date | identifier | duration | filter combination | |||
| (JD) | (s) | (m/m) | (au) | (au) | (deg) | ||
| Herschel/PACS | 2456090.655 | 1342222561 | 2996 | 100/160 | 30.02 | 29.65 | 1.85 |
| Herschel/PACS | 2456090.691 | 1342222562 | 2996 | 100/160 | |||
| Herschel/PACS | 2456090.726 | 1342222563 | 2996 | 100/160 | |||
| Herschel/PACS | 2456090.679 | 1342222564 | 2996 | 100/160 | |||
| Spitzer/MIPS | 2453539.667 | 4535808 | 1012 | 24 | 30.07 | 29.57 | 1.70 |
| Spitzer/MIPS | 2453539.679 | 4535808 | 1012 | 70 |
3.2 Spitzer/MIPS measurements
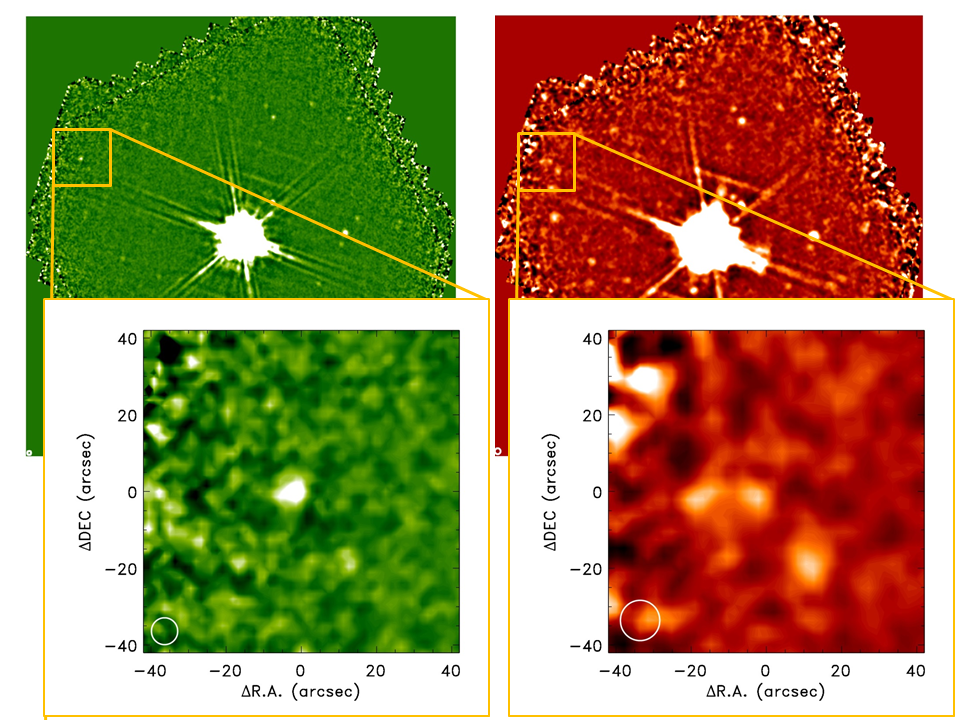
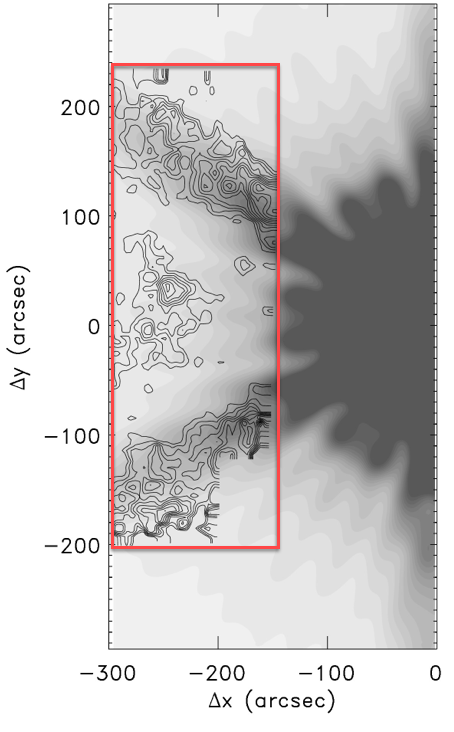
The Spitzer Space Telescope observed Nereid in a dedicated observation in 2005 using the MIPS camera at 24 and 70 m (Rieke et al., 2004). The data were reduced using the same pipeline as was used for the reduction of MIPS data of Centaurs and trans-Neptunian objects by Mueller et al. (2012) and Stansberry et al. (2008, 2012). Nereid was clearly detected in both bands, and we obtained in-band flux densities of F24 = 2.560.03 mJy at 24 m and F70 = 5011 mJy at 70 m using multi-aperture photometry. The corresponding images are presented in Fig. 6. At the time of the observations Nereid was at 4′ separation from the very bright Neptune. While the 24 m image (Fig. 6a) does not seem to be contaminated by extended emission features from the planet, this is not the case at 70 m. The two bright rims at the top and bottom of the 70 m image (Fig. 6b) are caused by the hexagon structure of the Neptunian point spread function (PSF), as it is demonstrated in Fig. 6c. There are also less apparent emission spikes at the location of Nereid that may affect the photometry. To account for the emission from Neptune at the location of Nereid, we tried to subtract Neptune’s contribution by scaling a theoretical 70 m 75 K PSF, scaled to the actual brightness of Neptune in this band at the time of the observations. Neptune’s brightness was estimated using the Neptune model by R. Moreno (Moreno, 2012) and we obtained F = 383.2 Jy at the effective wavelength of 71.42 m of this MIPS band. This model has been used for the Herschel/PACS and SPIRE flux calibration and used to reproduce the flux densities of Neptune within 2% (Müller et al., A&A, submitted). With this correction the main emission features have disappeared and repeated photometry provided an in-band flux of F = 2916 mJy.
| Detector/ | Fi | Cλ | Fm | |
|---|---|---|---|---|
| filter | ()m | (mJy) | (mJy) | |
| MIPS 24 | 23.68 | 2.560.03 | 0.990.01 | 2.590.13 |
| MIPS 70/u | 71.42 | 5011 | 0.910.01 | 55.012.7 |
| MIPS 70/c | 71.42 | 2916 | 0.910.01 | 31.917.6 |
| PACS 100 | 100.0 | 22.81.7 | 0.990.01 | 23.02.1 |
| PACS 160 | 160.0 | 18.62.9 | 1.030.01 | 18.13.0 |
3.3 NEATM model
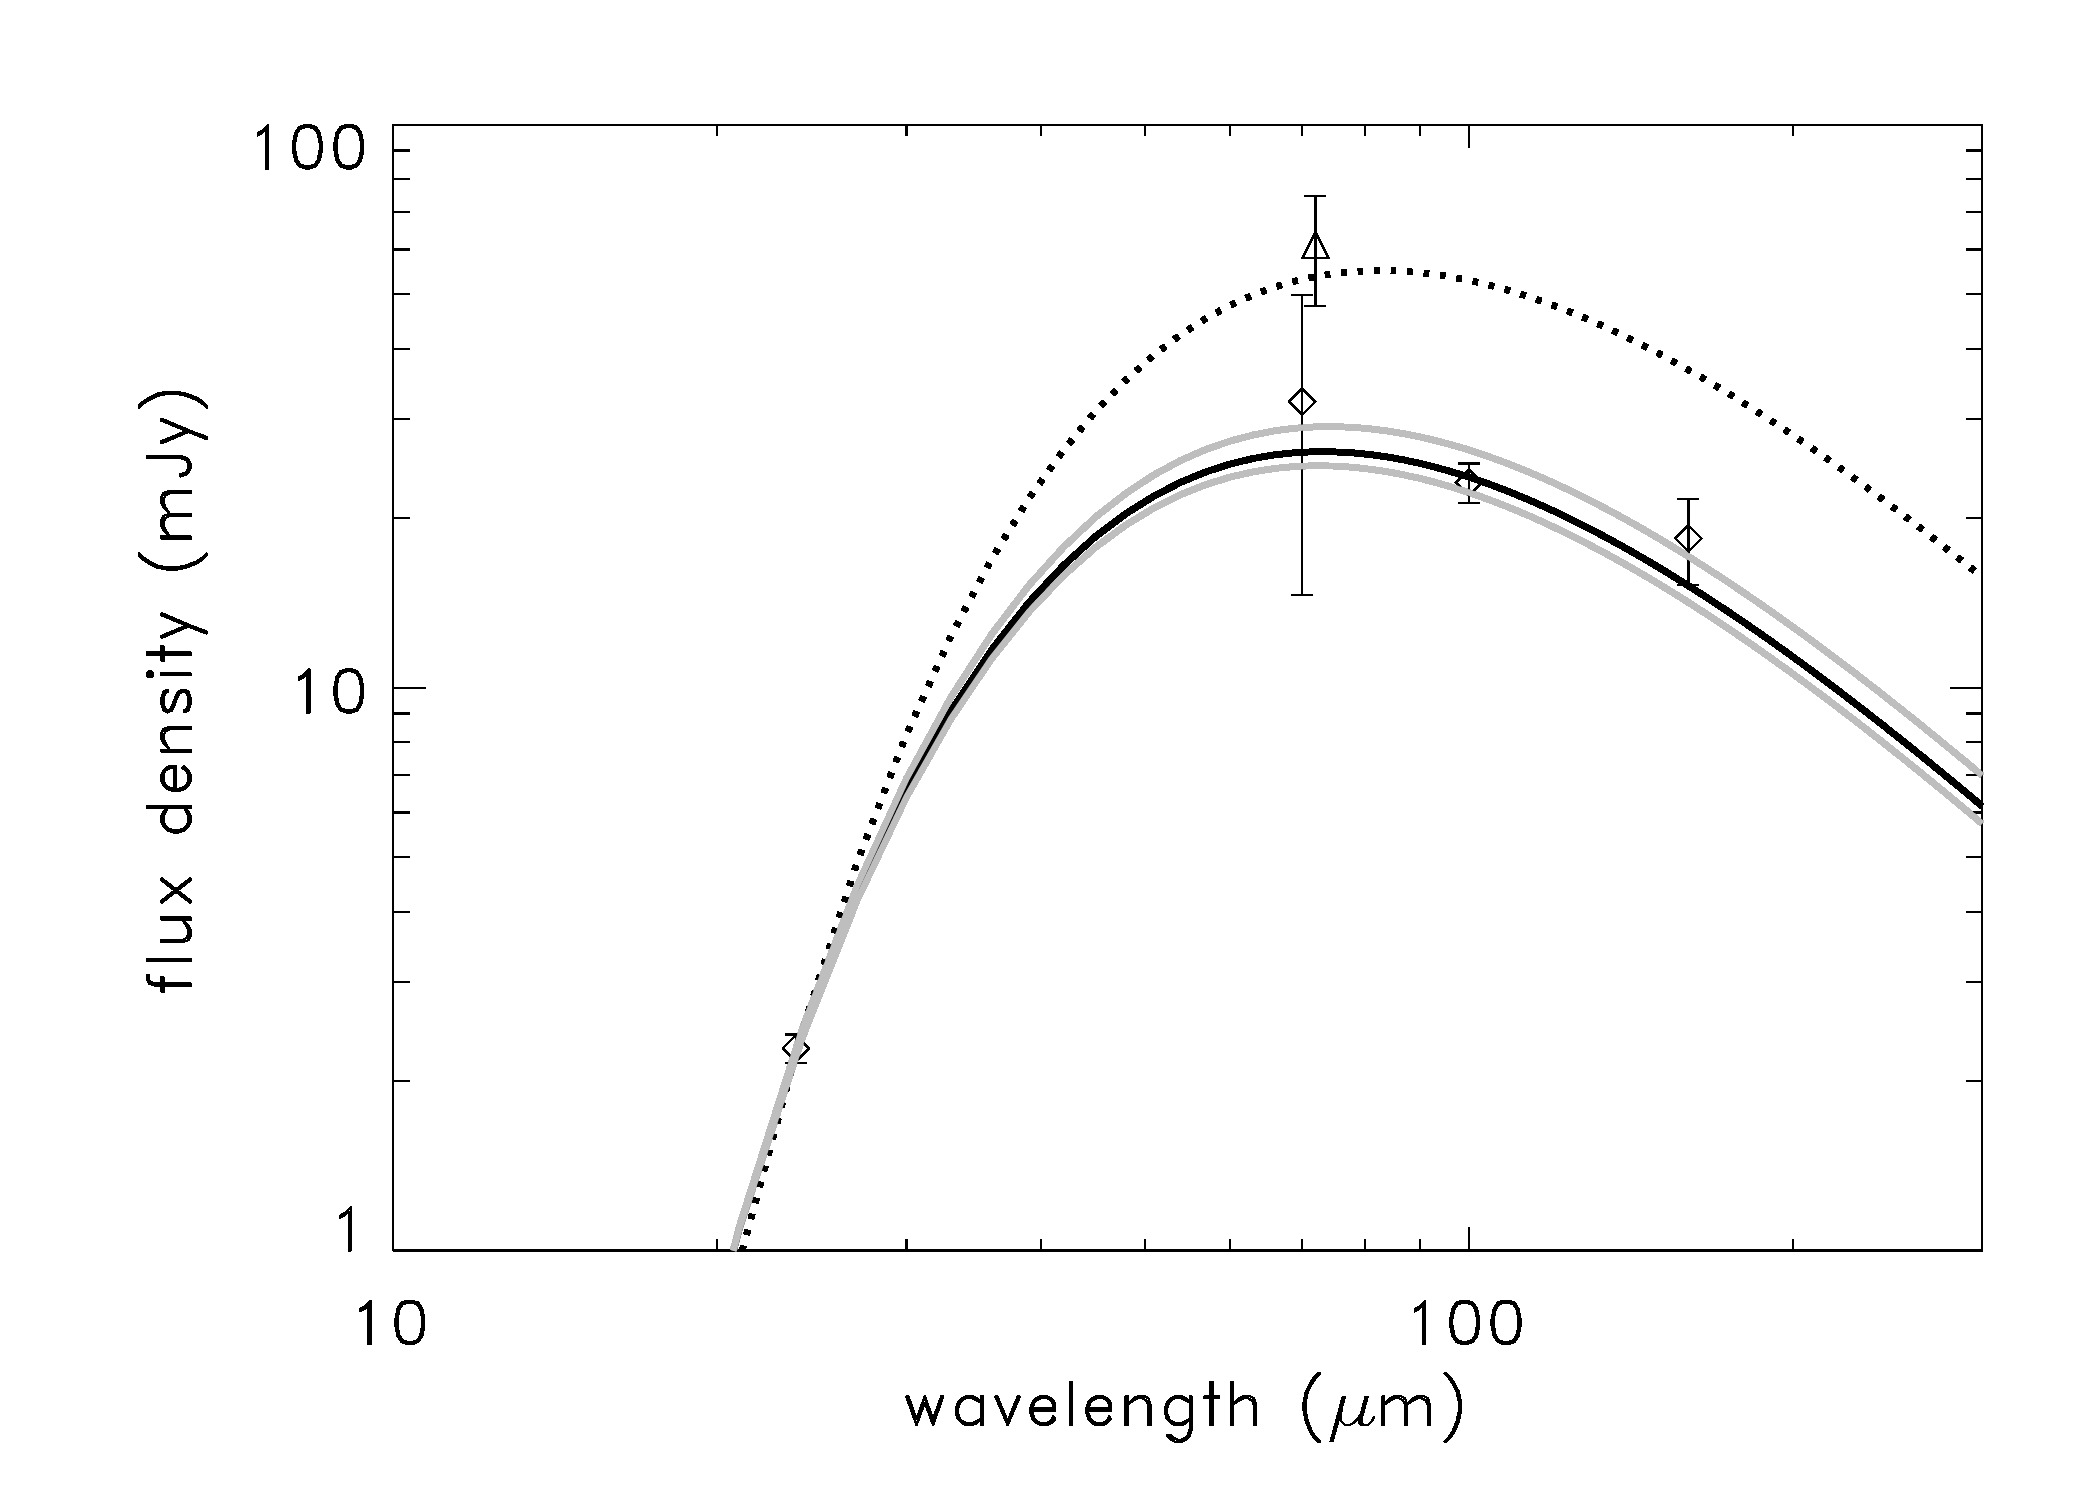
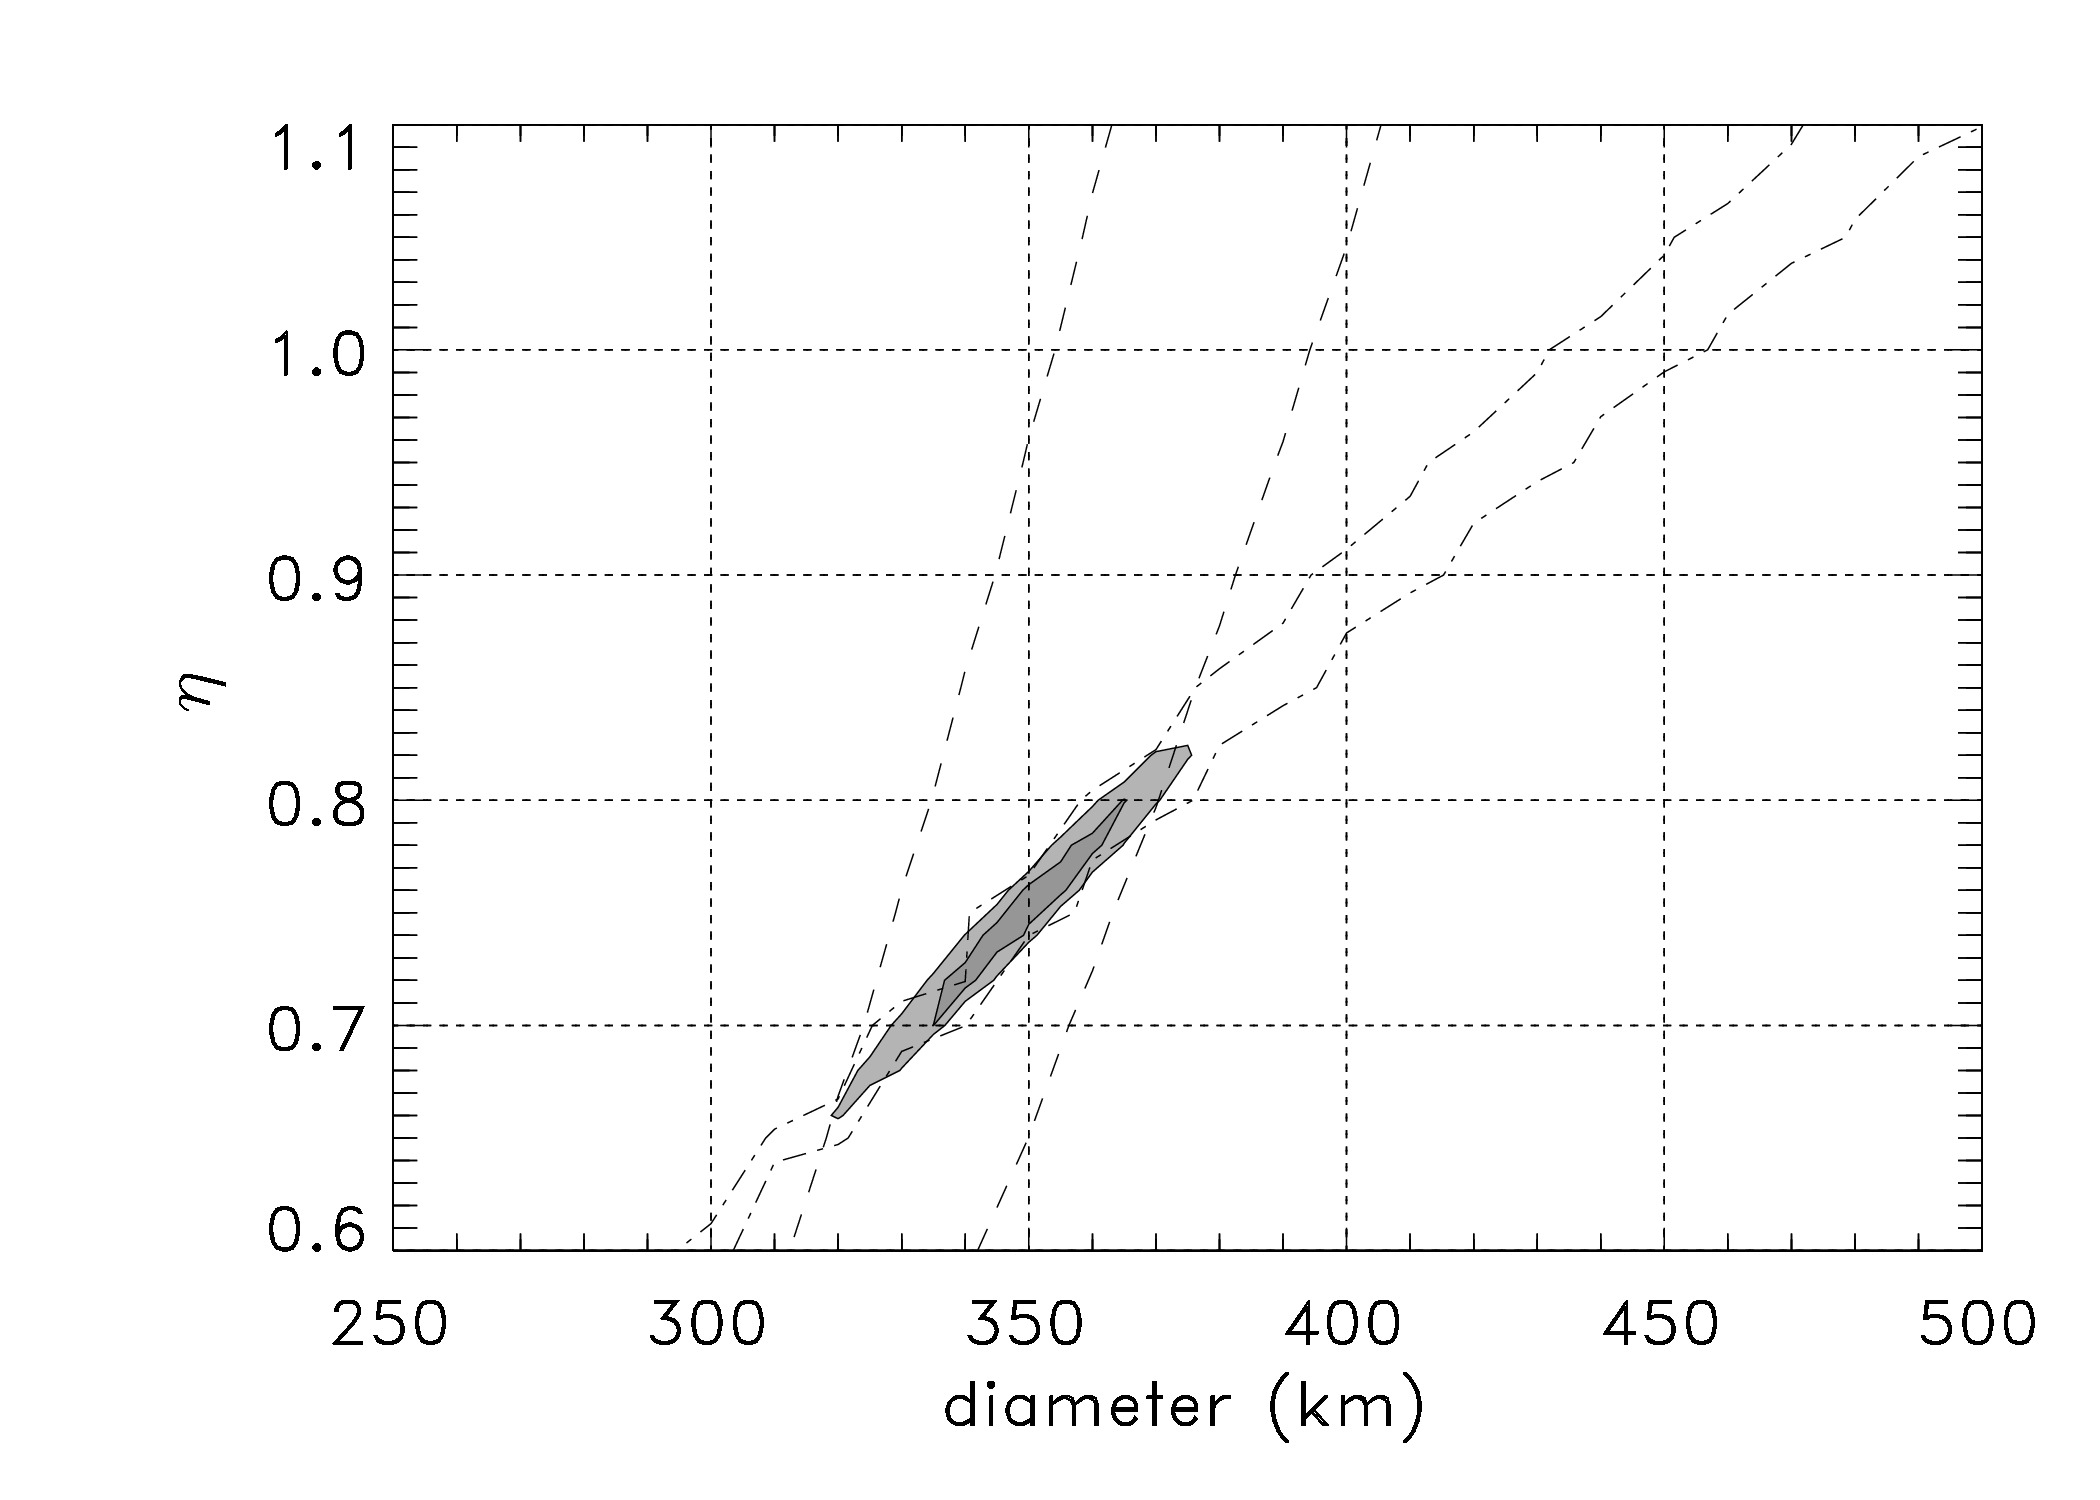
We used the Near-Earth Asteroid Thermal Model (NEATM) (Harris, 1998) to estimate the thermal emission of Nereid using the Spitzer/MIPS 24 and 70 m and the Herschel/PACS 100 and 160 m fluxes, as listed in Table 2. The Spitzer/MIPS and Herschel/PACS observations are separated by about six years, and, as we have seen above, there were indications that the rotational axis, brightness and the apparent shape of Nereid may change significantly on this timescale (see Sect. 1). However, as discussed above, the similarity of our newly detected rotation solution to those by Grav, Holman & Kavelaars (2003) and Terai & Itoh (2013) indicates that Nereid has been in a low rotational light curve amplitude period in the recent decade that is also associated with relatively small changes in spin axis rotation angle and subsolar latitude configurations. Therefore we feel that the combination of the Spitzer/MIPS and Herschel/PACS data is likely feasible and can better constrain the radiometry solutions than analysing them separately.
We characterise the radiometry solutions by calculating the reduced values of the fits from the observed and model fluxes of a specific effective diameter and beaming parameter combination. We consider a solution acceptable if , where is the standard deviation of the distribution (see e.g. Vilenius et al., 2014, for a similar application of the method). Albedo and effective diameter are not independent but are linked by the absolute magnitude. We use HV = 44180008, a weighted average of the absolute magnitudes provided by Grav, Holman & Fraser (2004) and Rabinowitz et al. (2007).
For the sake of completeness, we derived four kind of fits:
-
a)
MIPS 24 and 70 m only, original 70 m flux (MIPS epoch). In this case we used input flux derived from the uncorrected 70 m flux, F = 55.012.7 mJy (see Table 2). The NEATM fits resulted in a best fit diameter of D = 60595 km, = 1.360.16, and pV = 0.0810.027. (see the corresponding SED, plotted with dotted line, in Fig. 7a). This diameter is by far larger than any conceivable size for Nereid, and clearly indicates that the MIPS 70m flux is strongly contaminated, most likely by the diffraction spikes of Neptune, as discussed in Sect. 3.2 earlier. Therefore this 70 m input flux and the related solution is not considered any further in our analysis.
-
b)
MIPS 24 and 70 m only, corrected 70 m flux (MIPS epoch). In Fig. 7b we plot the regions of the acceptable solution ( ) in the diameter – beaming parameter space. For Case this is represented by the area enclosed by dashed lines. Due to the large error bar of the 70 m flux a wide range of diameters, and an especially wide range of beaming parameters are allowed.
-
c)
PACS 100 and 160 m only (PACS epoch). When only the PACS measurements are considered the situation is somewhat different. Here we have a strong correlation of the diameter and , but the model is not well constrained due to the lack of short wavelength fluxes (region enclosed by dash-dotted lines in Fig. 7b).
-
d)
PACS and MIPS combined (corrected 70 m flux, both MIPS and PACS epochs). Due to the similarities of the observing geometries at the dates of the MIPS and PACS observations the resulting fluxes of the same NEATM model are almost equivalent for the two epochs, and therefore a mean observing geometry can be safely applied on the combined dataset (see Table 1). When all four data points are considered, the NEATM model becomes well constrained. The common solution (gray contour ellipses in Fig. 7b) is compatible with both the MIPS-only and the PACS-only solutions (Cases and ). In this case we obtain D = 34515 km, = 0.760.02, and pV = 0.250.02. This effective diameter is very similar to the Voyager-2 flyby value of 35050 km (Thomas et al., 1991). The low value obtained for this combined solution confirms that the values related to the two epochs are the same to a level that they cannot be distinguished with the current flux uncertainties.
We consider the combined dataset and the solution of Case as the most acceptable size, albedo and beaming parameter for Nereid. It is supported by the light curve analysis / spin axis constraints and none of the other NEATM solutions (Cases and ) contradict with solution considering all the errors in the NEATM model parameter determination.
Using our favoured radiometry solution of D = 34515 km, = 0.760.02, and following the relations of thermal parameter, beaming parameter and surface roughness described in Spencer et al. (1989) and Spencer (1990), we can constrain the thermal properties (thermal inertia and surface roughness) of Nereid using the NEATM solutions to some level. In the framework of the abovementioned models, a beaming parameter below unity can be explained by surface roughness effects. The minimum level of surface roughness beaming contribution required to obtain = 0.76 (our best-fit value) is = 0.24 (see eq. 7 in Spencer 1990) that corresponds to an r.m.s. surface roughness level of = 0.6 (Lagerros 1998). Such a surface can also be constructed by considering 90° hemispheral craters with 50 per cent surface coverage. To obtain this low , it is, however, required in addition to the moderately high surface roughness that either the thermal inertia is extremely low ( 0.1 ) or the subsolar latitude is 90° (we see the spin-axis near to pole-on). For a near to pole-on configuration the thermal intertia should still be low, but it can be a value somewhat higher than in general case, typically 2 may be possible. The other possibility, 90° is not supported by the light curve constraints, as a maximum value of 60° is obtained in the spin axis analysis (see Sect. 2.3 and Fig. 4).
If we allow for a high surface roughness ( = 0.9 that can be achieved with 90° craters at 100% coverage), different sub-solar latitudes become possible. E.g. for = 0° = 0.76 results in a very low thermal inertia of = 0.5 . Lellouch et al. (2013) found an average thermal inertia of = 2.50.5 among Centaurs and trans-Neptunian objects in the heliocentric distance range of 25 au rh 41 au, with a strong suggestion of decreasing with increasing heliocentric distance. Even higher values of are expected among the icy moons of the outer giant planets. This may indicate that the observed values of the beaming parameter may rather be explained by a higher subsolar latitude ( 60°) than by a very low thermal inertia value of the surface. This also suggests that the shape of Nereid may be elongated to some level, because high values are found for larger axis ratio parameters in Sect. 2.3.
3.4 Thermophysical modelling
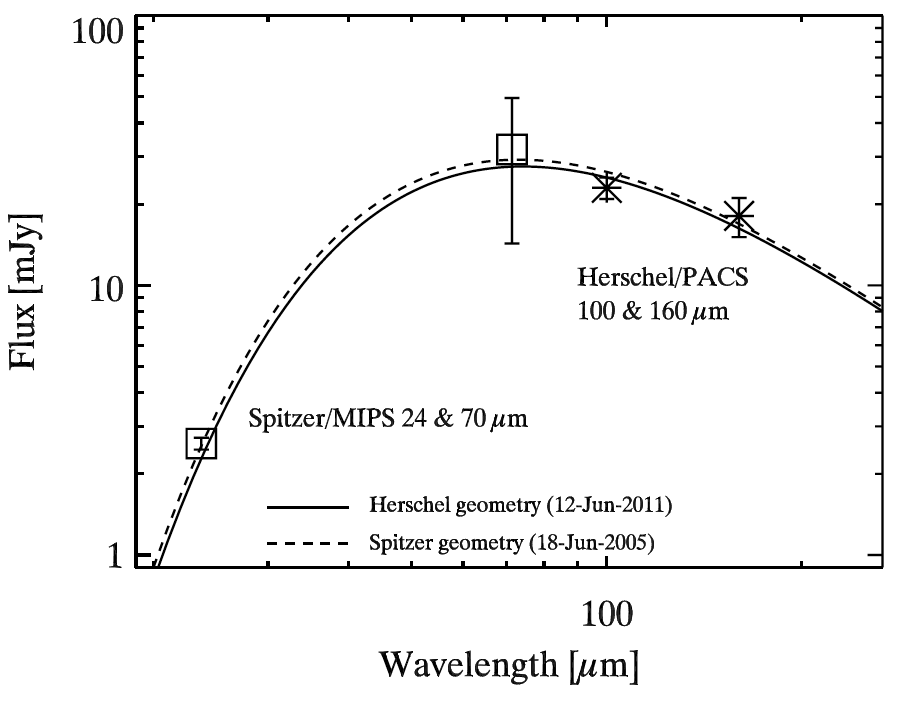
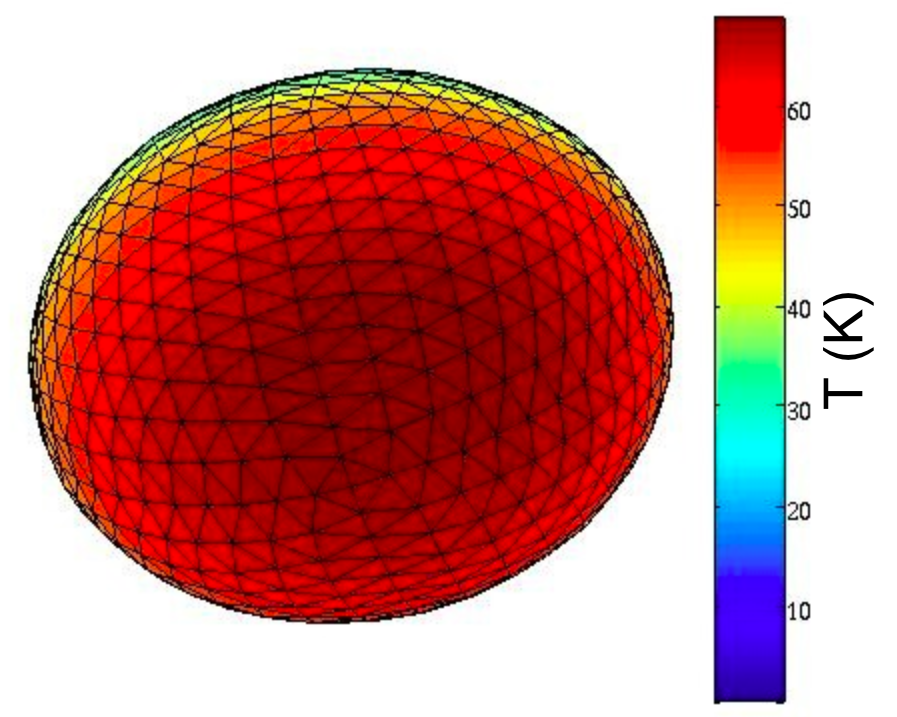
We also used a thermophysical model (TPM, see Lagerros, 1996, 1997, 1998; Müller & Lagerros, 1998, 2002). to characterise the thermal emission of Nereid. The TPM calculates the temperature distribution on the surface of a body for a specific shape, illumination, observing geometry, spin axis direction and rotation period. The model considers the thermal properties of the surface directly, including thermal inertia and surface roughness.
We looked for solutions that matches the observed Spitzer/MIPS and Herschel/PACS far infrared fluxes the best, using the input fluxes listed in Table 2. As in the case of the NEATM model, we characterise the goodness of fit by calculating the reduced values and we require that acceptable solutions should fulfil the requirement of .
Low ( = 0.1) to intermediate ( = 0.5) surface roughness cannot explain the observed fluxes as these values result in very high ( 3) reduced . All acceptable solutions ( 1.7) are related to "hot model settings", i.e., very high roughness ( 0.7) combined with extremely low thermal inertia ( 1 ), except for configurations near to pole-on where hot temperatures are reached for a wider range of thermal inertias, as in these cases heat is not transported to the night side. All acceptable settings ( 1.7) produce size and albedo solutions with Deff= 353–362 km and pV = 0.23–0.25.
Assuming that Nereid has a thermal inertia in the range of 1–5 , comparable to typical TNOs/Centaurs at similar distances (see Lellouch et al., 2013), only model settings with a spin axis direction close to "pole-on", {,} = {32030°, 030°}, produce acceptable flux predictions. The best-fit case of these models provided an effective size of D = 35713 km and a geometric albedo of pV = 0.240.02.
Our TPM analysis above suggested a high subsolar latitude and a correspondingly low spin axis aspect angle. According to the spin-axis constraints discussed in Sect. 2.3 high may occur for the highest possible axis ratio parameters only. This favours shape solutions of X 0.13, and a corresponding subsolar latitude of 60° (see Fig. 4). We have chosen the highest possible shape parameter value of X = 0.133 (a:c = 1.3:1) and the corresponding subsolar latitude of = 58°, and tested the feasibility of this configuration in a TPM model. When high roughness ( = 0.9) is assumed we obtained an acceptable value of 1.2, but this is associated with a very low thermal inertia of = 0.5 . For this solution the best fit effective diameter is D = 335 km, with a correspondig geometric albedo of pV = 0.275. Application of an extreme roughness of = 1.0 provides very low reduced values of 0.5, even when the "nominal" = 5 thermal inertia values are used. However, in these cases we obtain a somewhat smaller size of D = 326 km and a higher albedo of pV = 0.29.
4 Discussion
The most important question about Nereid, as discussed in the literature, was its shape and the precession behaviour of its spin axis. This was modelled in detail by Schaefer et al. (2008) and Hesselbrock et al. (2013), with the main aim to explain the large amplitude brightness variations seen on different time scales. These models assumed a long rotation period (72–144 h) which was needed to achieve precession timescales of around a decade.
One important finding of our paper is that we confirmed the short (11594) rotation period observed earlier by Grav, Holman & Kavelaars (2003) and Terai & Itoh (2013). As it has been mentioned previously, a short rotation period implies a long spin axis precession time, as Pprec P/Pspin, where Pprec is the precession period, Porb is the orbital period around Neptune, and Pspin is the rotation period (see e.g. Hesselbrock et al., 2013). Pprec values calculated from the 11594 rotation period are at least an order of magnitude longer than those assumed by Schaefer et al. (2008) and Hesselbrock et al. (2013), even if an extremely elongated body is assumed. Therefore the spin axis orientation could not change significantly in the last 15 years, and the precession of the spin axis cannot be the reason behind the large flux variations observed.
In Sect. 2.3 we used this stability of the spin axis orientation and obtained a maximum axis ratio of a:c = 1.3 from the light curve amplitude analysis. According to Hesselbrock et al. (2013), forced precession of Nereid could be feasible only if the moon is considerably elongated with an : axis ratio of 1.9:1. Such a high axis ratio is excluded by our results, consistently with the long precession timescales obtained.
The shape solution favoured by the thermal analysis (axis ratio parameter of X = 0.133) is also the one that provides the maximum possible light curve amplitude of 013, with a peak in the 1960’s (see Sect. 2.3). Even this solution is unable to explain the extremely large brightness variations observed some decades ago (up to of 05, see fig. 4 in Schaefer et al., 2008, for a summary of these data). Whatever caused these variations, it cannot be the forced precession of a very elongated Nereid, as this scenario is inconsistent with our present data.
The long rotation period assumed by Schaefer et al. (2008) and Hesselbrock et al. (2013) was partly based on the expectation that if Nereid was formed around Neptune or captured at early times, then its original rotation – which could have had a period of a few hours – should have slowed down considerably, even if Nereid is just slightly elongated. In this sense, Nereid rotates fast today – this may favour a late capture (i.e. Nereid did not have enough time to slow down considerably) or indicate some other influence, like a collision, that may overwrite the rotational state. We note that Grav, Holman & Fraser (2004) suggested that Halimede, a small moon of Neptune, may be a fragment of Nereid broken off during a collision. This scenario for the origin of Halimede is supported by their similar colours and the relatively high probability of a collision between Nereid and Halimede in the timespan between the formation of the Solar System and today (Holman et al., 2004).
As discussed in detail in Schaefer et al. (2008), the Voyager-2 images analysed by Thomas et al. (1991) could hardly be used to put constraints on the actual shape of Nereid, i.e. we did not have enough information to tell whether Nereid was spherical or notably non-spherical. The combination of the spin axis constrains and both the NEATM and TPM radiometry results favors a moderately elongated shape with a axis ratio parameter X 0.13, and correspondingly a present subsolar latitude of 60°(a possible shape solution using X = 0.133 is presented in Fig. 8b). The moderately elongated shape put forward here for Nereid is feasible regarding observational constraints. However, for a moon of 350 km in diameter a shape closer to spherical may be more likely (see e.g. Schaefer et al., 2008) based on the shape information of giant planet moons of similar size. Most of these large (100 km in radius) moons are round to a few per cent (better than 10%) accuracy. Our preferred solution for Nereid is further away from a perfect sphere. One exception among these satellites may be the Saturn moon, Hyperion, which is highly elongated despite that it is similar in size to Nereid (about 205130110 km semi-axes). In the case of Hyperion the elongated shape is explained by the high porosity of the interior (40%) that also leads to a ’sponge-like’, high roughness surface where craters remain nearly unchanged over billions of years (Thomas et al., 2007). A porous internal structure and high roughness surface similar to that of Hyperion may explain well both the elongated shape and the radiometry analysis results obtained for Nereid in the present paper.
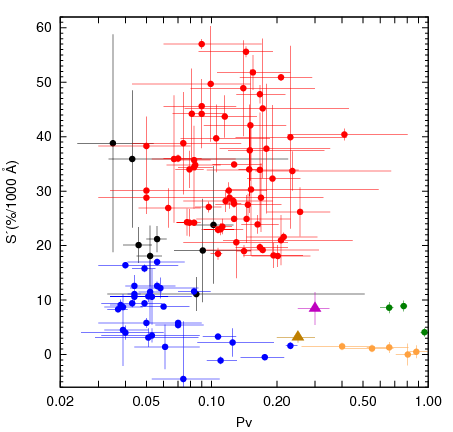
In a recent paper Lacerda et al. (2014) presented an analysis of colours and albedos of Centaurs and trans-Neptunian objects, and identified two main groups whose existence can be considered as an evidence for a compositional discontinuity in the young Solar System. For comparison, we plotted the colour and albedo of Nereid in a diagram (Fig. 9) similar to fig. 2 in Lacerda et al. (2014), presenting these dark-neutral and bright-red objects. Colours are represented by spectral slopes, calculated in the same way as in Lacerda et al. (2014). If Nereid was either formed around Neptune or captured during Neptun’s outward migration from the 20-30 au distance range in the early Solar System, it is expected to exhibit a surface similar to the objects in the dark-neutral group. Indeed, Nereid is close in colour to the typical colours of objects in this group, but at the same time, its albedo is significantly larger than the typical value in this group, even larger than the albedos of most objects in the bright-red group. If Nereid was a member to the dark-neutral group, it would have the brightest surface among these objects. While Nereid is at the edge of the distributions of objects of both major groups in the albedo-colour plain, it is rather close in these characteristics to the Saturnian moon Hyperion (purple triangle in Fig. 9). As mentioned earlier, the surface roughness and internal structure of Nereid may as well be similar to those characteristic of this irregular satellite.
5 Summary
In this paper we presented space born observation of Nereid, performed by the Kepler Space Telescope in the framework of the extended K2 mission, and results obtained from archival infrared data of the Spitzer Space Telescope and the Herschel Space Observatory. From the Kepler K2 data we obtained a light curve that was the same in period and similar in amplitude to those obtained from ground based observations in 2001 and 2008. These observations together contrain the possible rotation states of Nereid very well. According to these results, Nereid is in a low amplitude apparent light curve state nowadays, but may have been in a much larger amplitude state some decades ago. We managed to exclude very elongated shapes with axis ratios above :; this also means that Nereid cannot be in a forced precession state due to tidal forces as it is not elongated enough for this process. This is a robust result as we assumed that the light curve of Nereid is solely caused by shape effects and albedo variegations existing on the surfce would just make the moon more spherical in this respect.
We confirmed the size of Nereid obtained from Voyager-2 flyby data by an independent method – radiometry based on infrared data. Both the NEATM and TPM thermal emission models resulted in similar effective size (D =335–345 km) and albedo values (pV = 0.25–0.27). Both methods indicate very high roughness (likely 0.9) independently of shape, i.e. a surface with deep craters and very high surface coverage. Using the light curve and thermal emission results together we obtain a likely moderately elongated shape (a:c 1.3:1) and a present spin axis aspect angle of 30° for this irregular moon of Neptune. This shape may partly explain the larger light curves amplitudes observed some decades ago.
Acknowledgements
This project has been supported by the Lendület-2009 and LP2012-31 Young Researchers Program of the Hungarian Academy of Sciences, the Hungarian National Research, Development and Innovation Office grants OTKA K-109276 and K-104607, NKFIH K-115709 and PD-116175, and by City of Szombathely under agreement no. S-11-1027. The research leading to these results has received funding from the European Community’s Seventh Framework Programme (FP7/2007-2013) under grant agreements no. 269194 (IRSES/ASK), no. 312844 (SPACEINN), and the ESA PECS Contract Nos. 4000110889/14/NL/NDe and 4000109997/13/NL/KML. L.M. was supported by the János Bolyai Research Scholarship of the Hungarian Academy of Sciences. Funding for the K2 spacecraft is provided by the NASA Science Mission directorate. The authors acknowledge the Kepler team for the extra efforts to allocate special pixel masks to track moving targets. All of the data presented in this paper were obtained from the Mikulski Archive for Space Telescopes (MAST). STScI is operated by the Association of Universities for Research in Astronomy, Inc., under NASA contract NAS5-26555. Support for MAST for non-HST data is provided by the NASA Office of Space Science via grant NNX13AC07G and by other grants and contracts. The useful comments of the referee are also appreciated.
References
- Dobrovolskis (1995) Dobrovolskis, A.R., 1995, Icarus, 118, 181
- Gilliland et al. (2010) Gilliland, R. L. et al., 2010, ApJL, 713, 160
- Grav, Holman & Kavelaars (2003) Grav, T.; Holman, M. J. & Kavelaars, J. J., 2003, ApJ, 591, L71
- Grav, Holman & Fraser (2004) Grav, T.; Holman, M. J. & Fraser, W.C., 2004, ApJ, 613, L77
- Harris (1998) Harris, A. W., 1998 Icarus, 131, 291
- Hesselbrock et al. (2013) Hesselbrock, A.J., Alexander, S.G., Thomas, W.H., Abel, N.P., 2013, AJ, 145, 144
- Hicks et al. (2008) Hicks, M.D., Buratti, B,J., Basilier, E.N., 2008, Icarus, 193, 352
- Holman et al. (2004) Holman, M.J., Kavelaars, J.J., Grav, T., et al., 2004, Nature, 430, 865
- Howell et al. (2014) Howell, S. B., Sobeck, C., Haas, M., et al. 2014, PASP, 126, 398
- Jacobson (2009) Jacobson, R. A. 2009, AJ, 137, 4322
- Kiss et al. (2014) Kiss, Cs., Müller, T. G., Vilenius, E., et al., 2014, Experimental Astronomy, 37, 161
- Lacerda et al. (2014) Lacerda, P., Fornasier, S., Lellouch, E., et al. 2014, ApJL, 793, 2
- Lagerros (1996) Lagerros, J. S. V., 1996, A&A, 310, 1011
- Lagerros (1997) Lagerros, J. S. V., 1997, A&A, 325, 1226
- Lagerros (1998) Lagerros, J. S. V., 1998, A&A, 332, 1123
- Lellouch et al. (2013) Lellouch, E., Santos-Sanz, P., Lacerda, P., et al., 2013, A&A, 557, A60
- Monet et al. (2003) Monet, D. G., Levine, S. E.; Canzian, B., et al. 2003, AJ, 125, 984
- Moreno (2012) Moreno, R. (2012), Neptune and Uranus planetary brightness temperature tabulation. Tech. rep., ESA Herschel Science Centre, available from ftp://ftp.sciops.esa.int/pub/hsc-calibration/PlanetaryModels/ESA4/
- Müller & Lagerros (1998) Müller, T. G. & Lagerros, J. S. V. 1998, A&A, 338, 340
- Müller et al. (2009) Müller, T.G., Lellouch, E., Böhnhardt, H., et al., 2009, EM&P, 105, 209
- Müller & Lagerros (2002) Müller, T. G. & Lagerros, J. S. V. 2002, A&A, 381, 324
- Müller et al. (2009) Müller, T. G., Lellouch, E, Böhnhardt, H. et al. 2009, EM&P, 105, 209
- Mueller et al. (2012) Mueller, M., Stansberry, J., Mommert, M. & Grundy, W., 2012, "TNO Diameters And Albedos: The Final MIPS Dataset", AAS DPS meeting, #44, #310.13
- Pál (2012) Pál, A., 2012, MNRAS, 421, 1825
- Pál et al. (2015a) Pál, A.; Szabó, R.; Szabó, Gy. M.; Kiss, L. L.; Molnár, L.; Sárneczky, K. & Kiss, Cs. 2015a, ApJL, 804, 45
- Pál et al. (2015b) Pál, A.; Kiss, Cs.; Müller, Th. G.; Molnár, L.; Szabó, R.; Szabó, Gy. M.; Sárneczky, K.; Kiss, L. L. 2015c, AJ, submitted
- Pilbratt et al. (2010) Pilbratt, G. L., Riedinger, J. R., Passvogel, T., et al., 2010, A&A, 518, L1
- Poglitsch et al. (2010) Poglitsch, A., Waelkens, C., Geis, N., et al., 2010, A&A, 518, L2
- Rabinowitz et al. (2007) Rabinowitz, D., Schaefer, B.E., & Tourtellotte, S.W., 2007, AJ, 133, 26
- Rieke et al. (2004) Rieke, G.H., Young, E.T., Engelbracht, C.W., et al., 2004, ApJS, 154, 25
- Schaefer et al. (2008) Schaefer, B.E., Tourtellotte, S.W., Rabinowitz, D.L., Schaefer, M.W., 2008, Icarus, 196, 225
- Stansberry et al. (2008) Stansberry, J., Grundy, W.M., Brown, M.E., et al., 2008, in The Solar System Beyond Neptune, Physical Properties of Kuiper Belt and Centaur Objects: Constraints from the Spitzer Space Telescope, p.161 (Tuscon, AZ: Univ. Arizona Press)
- Stansberry et al. (2012) Stansberry, J.A., Grundy, W.M., Mueller, M., et al., 2012, Icarus, 219, 676
- Szabó et al. (2015) Szabó, R., Sárneczky, K., Szabó, Gy. M., et al. 2015, AJ, 149, 112
- Terai & Itoh (2013) Terai, T. & Itoh, Y., 2013, PASJ, 65, 46
- Thomas et al. (1991) Thomas, P., Veverka, J., Helfenstein, P., 1991, J. Geophys. Res., 96, 19253
- Thomas et al. (2007) Thomas, P.C., Armstrong, J.W., Asmar, S.W., et al., 2007, Nature, 448, 50
- Thomas (2010) Thomas, P.C., 2010, Icarus, 208, 395
- Vilenius et al. (2014) Vilenius, E., Kiss, C., Müller, T. et al. 2014, A&A, 564, 35