29Si nuclear magnetic resonance study of URu2Si2 under pressure
Abstract
We report 29Si nuclear magnetic resonance measurements of single crystals and aligned powders of URu2Si2 under pressure in the hidden order and paramagnetic phases. We find that the Knight shift decreases with applied pressure, consistent with previous measurements of the static magnetic susceptibility. Previous measurements of the spin lattice relaxation time revealed a partial suppression of the density of states below 30 K. This suppression persists under pressure, and the onset temperature is mildly enhanced.
keywords:
URu2Si2, hidden order, NMR, pressure1 Introduction
URu2Si2is a heavy fermion material that has captured the interest of the condensed matter community for over 25 years [1, 2]. In addition to an unconventional superconducting state below 1.5K, URu2Si2 undergoes a phase transition at [1, 3], the order parameter of which is yet undetermined. The nature of the hidden order phase remains controversial, but it clearly does not involve magnetic ordering of dipole moments [4]. Extensive neutron scattering work has suggested that it has an itinerant nature and involves some type of Fermi surface instability [4, 5, 6], and recent Raman spectroscopy experiments indicate that the hidden order consists of a chirality density wave [7]. It is likely that this exotic phase emerges in this material due to the unusual symmetry of the crystalline electric field states [8].
An analysis of previous thermodynamic and neutron scattering measurements in the context of hidden order gap fluctuations uncovered the possible existence of a pseudogap occurring at a temperature scale , and recent nuclear magnetic resonance (NMR) experiments at ambient pressure indicated [9, 10]. The presence of anomalies between 25-30K in magnetic susceptibility [11], point contact spectroscopy (PCS) [12], and neutron scattering measurements [5, 13], as well as in other thermodynamic probes (heat capacity, thermal expansion and ultrasound velocity), which are sensitive to changes in the elastic constants of the crystal lattice, also suggest this temperature scale [14, 15, 16, 17]. Ultrafast and conventional optical spectroscopy have also found a suppression of low energy spectral weight below 30 K [18, 19, 20].
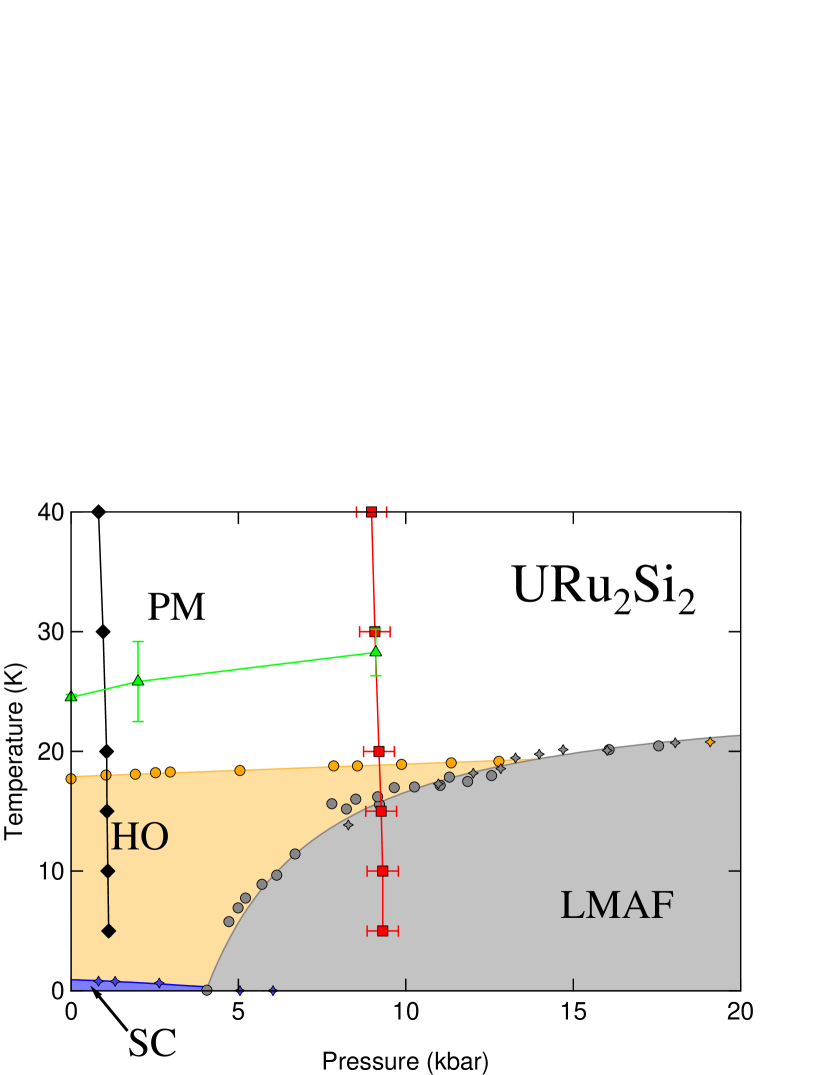
Under hydrostatic pressure, increases, and above 4.7 kbar URu2Si2 undergoes a phase transition to a large moment antiferromagnetic (LMAF) ground state [21, 22]. Little is known, however, about the behavior of under pressure. In order to investigate how the suppression of the density of states evolves, we performed 29Si NMR experiments up to 9.1 kbar in the paramagnetic region of the phase diagram. We find that this suppression persists with the application of pressure, and that increases slightly.
2 Sample Preparation and Pressurization
29Si NMR (, 4.7% natural abundance) measurements were conducted under pressure on a single crystal at 2.0 kbar and on an aligned powder at 9.1 kbar. Details of the sample preparation of both the single crystal and aligned powder are given in Ref. [10]. The signal to noise ratio in a single-crystal in a pressure cell is poor because the high conductivity of the sample screens out the radiofrequency fields of the pulsed NMR experiment, and small crystals are necessary due to the confined space within the pressure cell. As shown previously, the spin-lattice-relaxation rate measured in an aligned powder is identical to that in a single crystal, and the data is reproducible across different samples. Therefore we switched to the aligned powder for the higher pressure experiments in order to enhance signal to noise. Pressure was applied using a Cu-Be piston-cylinder clamp cell, with daphne oil (Idemitsu Co., Ltd., type 7373) as a pressure medium.
In order to accurately measure the pressure, we first tested the cell with two different types of manometers: ruby fluorescence at 532 nm and 63Cu NQR of Cu2O. The fluorescence was measured by incorporating an optical fiber (200 m diameter with Al cladding) in the feedthrough to the pressure cell. A ruby chip of diameter m was fixed to the end of the fiber with epoxy. The temperature dependence of the pressure in the cell measured using both the shift of the ruby fluorescence line, and the shift of the 63Cu NQR frequency in a single crystal of Cu2O for various load pressures applied to the cell at room temperature [23, 24, 25]. Both measurement techniques indicate that the pressure changes with temperature on the order of between room temperature and 4K. This change is likely due to differences in thermal contraction between different elements of the pressure cell. Curiously, the NQR measurement consistently gives a slightly lower pressure ( than the ruby fluorescence, albeit with a similar temperature trend. We attribute this discrepancy to differences in calibrations. For example, the NQR calibration is based on low temperature measurements of the of superconducting Sn, whereas the ruby fluorescence calibration is based on x-ray scattering at room temperatures. The difference is not due to inhomogeneous pressure within the pressure cell, as we found no broadening of either the ruby fluorescence spectrum or the NQR spectrum up to 9.1 kbar [23]. Based on these results, we decided to use the ruby fluorescence for the URu2Si2 NMR study. This approach to measuring the pressure is superior because it provides information about the pressure as a function of temperature and does not require that Cu2O be included within the NMR solenoid. The pressure measured in a clamp-cell can vary as a function of temperature, particularly at low pressures ( kbar). Since URu2Si2 (Fig. 1) exhibits multiple phases in this pressure regime, it is crucial to know the actual temperature dependence of the pressure in situ during the experiment. It is important to note that while the freezing of the pressure fluid around 200K causes a decrease in the applied pressure before it increases below 100K, the pressure in the region of interest for this experiment varies by less than 0.1 kbar.
3 NMR Results
Spectra and Knight Shift
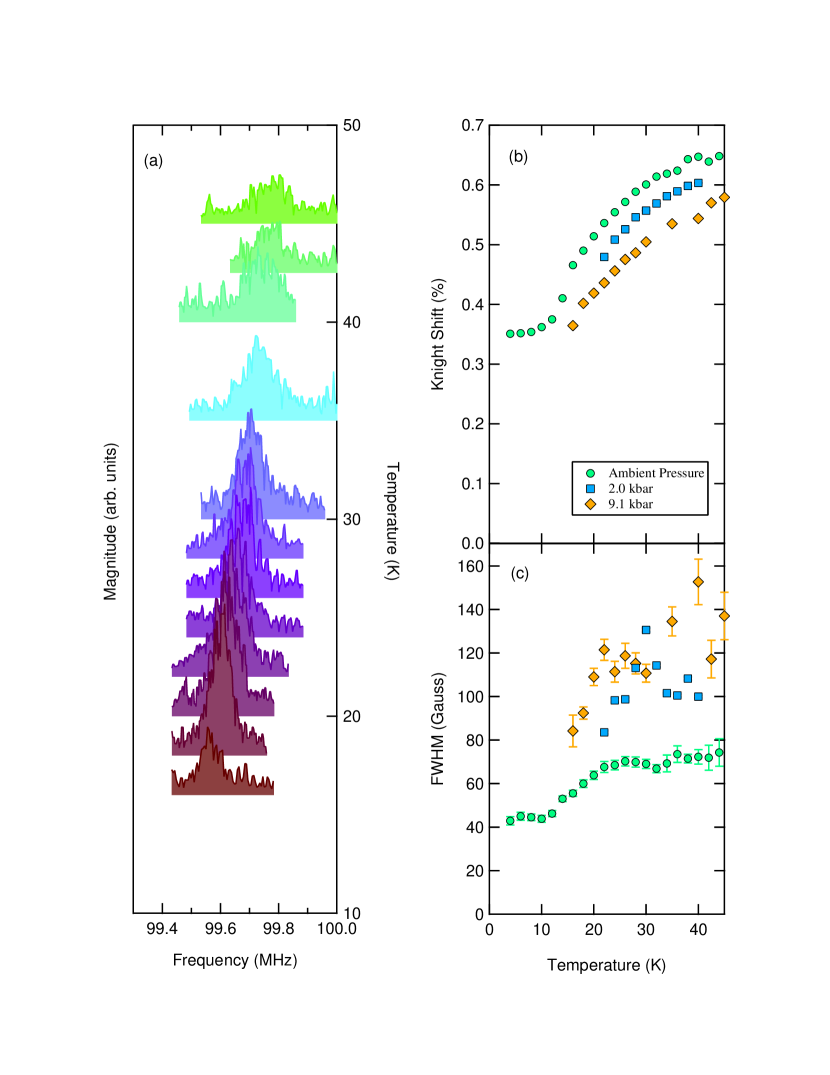
29Si NMR spectra were acquired by sweeping frequency at T in a high homogeneity NMR magnet with the field parallel to the c–axis of the crystal. In this field, is suppressed to 16 K [26]. The 29Si spectra were measured by spin echoes, and the signal-to-noise ratio was enhanced by summing several (16 to 24) echoes acquired via a Carr-Purcell-Meiboom-Gill (CPMG) pulse sequence with s and an acquisition time of s. The CPMG sequence requires that the spin-spin relaxation time, ms for URu2Si2in the normal state, is long compared to the acquisition of pulses, as is the case here. At ambient pressure, the spin-lattice-relaxation rate was measured as a function of the angle between the alignment axis and the magnetic field in order to properly align the sample, since is a strong function of orientation with a minimum for . Figure 2(a) shows the temperature dependence of the 29Si spectrum at 9.1 kbar. A comparison of the Knight shifts at ambient pressure, 2kbar, and 9.1 kbar are plotted in Fig. 2(b). The Knight shift probes the magnetic susceptibility through the hyperfine coupling, and the reduction of the Knight shift with applied pressure is consistent with measurements of the static magnetic susceptibility under pressure [27]. As previously observed at ambient pressure, the 30K anomaly seen in the spin-lattice-relaxation rate is not manifest in the Knight shift under pressure [10, 28]. Fig. 2(c) shows the temperature dependence of the full width half maximum of the Si resonance. The linewidth increases with applied pressure, and appears to have a peak in the powder sample around . This peak occurs at a slightly greater temperature in the single crystal, which likely arises from variations between the samples [29, 30].
Spin Lattice Relaxation Measurements
The spin-lattice-relaxation rate was measured by inverting the magnetization and measuring the recovered magnetization by summing the echoes from a CPMG sequence. Fig. 3 shows versus temperature for several different pressures. The error bars are greater under pressure because of the smaller sample size and reduced signal to noise ratio. Nevertheless, the data indicate a maximum close to 30 K that is characteristic of the reduction of density of states below that persists under pressure. For concreteness, we fit the data in the paramagnetic region to the expression [10]:
| (1) |
where , and are variable parameters, shown as black lines in Fig. 1. Here is a phenomenological form of the normalized joint density of states (JDOS) at the Fermi energy , which accounts for any -dependent suppression due to a pseudogap, and is a crossover function due to 2D antiferromagnetic psuedospin fluctuations [10, 31]. Although the error bars are significant due to the poor signal to noise, the increasing trend in as a function of pressure is evident, as shown in Fig. 1.
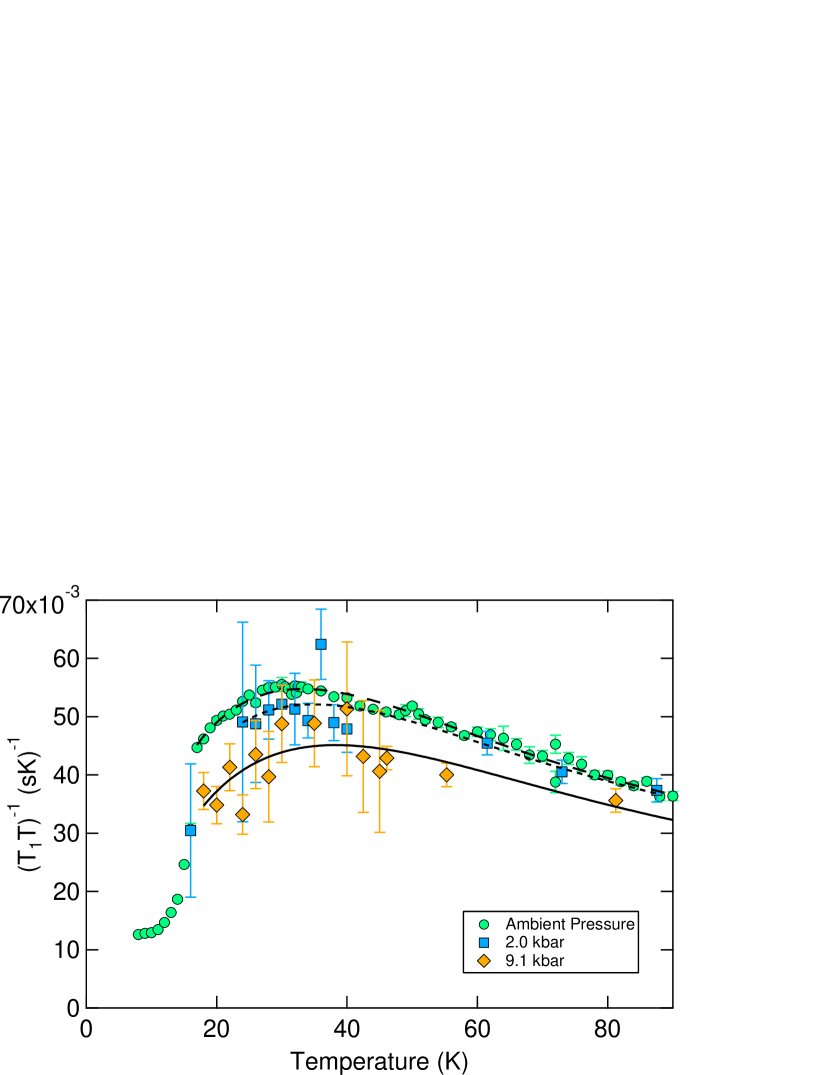
versus temperature for the powder and single crystal samples under pressure. At each pressure, has a maximum at , indicating that there is a reduction in the density of states above the hidden order transition that is robust under pressure up to 9.1 kbar. The data at ambient pressure is reproduced from [10]. Fits to the data are shown as black lines, and are discussed in the text.
4 Discussion
The physical significance of remains unclear, but may be related either to the the Kondo hybridization gap or to the onset of fluctuations of the hidden order. In either case, it is reasonable to expect that the energy scale increases with increasing pressure. Pressure increases the overlap between the U orbitals and the conduction electrons, leading to an enhanced Kondo scale. A similar increase was recently observed in NMR experiments in CeRhIn5 under pressure [32]. Furthermore, also increases with pressure, so the onset temperature for fluctuations would naturally increase. Curiously, the Knight shift is suppressed by about at 9.1 kbar between 23-30K. As shown in Ref. [27], the bulk susceptibility is reduced by about by 15.9 kbar over the same temperature range. Assuming a linear behavior of the suppression, the bulk susceptibility should be reduced by only . Therefore, the data suggest that the Knight shift has suppressed more than would be expected based on the susceptibility. A possible explanation for this discrepancy is that the transferred hyperfine coupling between the U moments and the Si nuclei increases under pressure. Similar pressure-dependent hyperfine couplings were observed in CeRhIn5 [32]. Further experiments on URu2Si2 under pressure are challenging, however, because the spin-spin decoherence rate, increases close to the LMAF phase. As a result, fewer CPMG echoes can be summed, and the signal to noise ratio decreases. It is possible that future experiments using isotopically enriched Si may provide more detailed information about the evolution of of the temperature scales, and as a function of pressure in a single crystal.
Acknowledgements
Work at UC Davis and LANL was supported by the UC Lab Research Fee Program and the National Nuclear Security Administration under the Stewardship Science Academic Alliances program through DOE Research Grant #DOE DE-FG52-09NA29464.
References
References
- [1] T. T. M. Palstra, A. A. Menovsky, J. v. d. Berg, A. J. Dirkmaat, P. H. Kes, G. J. Nieuwenhuys, J. A. Mydosh, Superconducting and magnetic transitions in the heavy-fermion system URu2Si2, Phys. Rev. Lett. 55 (24) (1985) 2727–2730. doi:10.1103/PhysRevLett.55.2727.
-
[2]
J. A. Mydosh, P. M. Oppeneer,
Colloquium
: Hidden order, superconductivity, and magnetism: The unsolved case of
URu2Si2, Rev. Mod. Phys. 83 (2011) 1301–1322.
doi:10.1103/RevModPhys.83.1301.
URL http://link.aps.org/doi/10.1103/RevModPhys.83.1301 -
[3]
Y. Kasahara, T. Iwasawa, H. Shishido, T. Shibauchi, K. Behnia, Y. Haga, T. D.
Matsuda, Y. Onuki, M. Sigrist, Y. Matsuda,
Exotic
superconducting properties in the electron-hole-compensated heavy-fermion
“semimetal” URu2Si2, Phys. Rev. Lett. 99 (2007) 116402.
doi:10.1103/PhysRevLett.99.116402.
URL http://link.aps.org/doi/10.1103/PhysRevLett.99.116402 - [4] C. Broholm, J. K. Kjems, W. J. L. Buyers, P. Matthews, T. T. M. Palstra, A. A. Menovsky, J. A. Mydosh, Magnetic excitations and ordering in the heavy-electron superconductor URu2Si2, Phys. Rev. Lett. 58 (14) (1987) 1467–1470. doi:10.1103/PhysRevLett.58.1467.
- [5] C. R. Wiebe, J. A. Janik, G. J. MacDougall, G. M. Luke, J. D. Garrett, H. D. Zhou, Y.-J. Jo, L. Balicas, Y. Qiu, J. R. D. Copley, Z. Yamani, W. J. L. Buyers, Gapped itinerant spin excitations account for missing entropy in the hidden-order state of URu2Si2, Nat. Phys. 3 (2007) 96–99. doi:10.1038/nphys522.
-
[6]
F. Bourdarot, E. Hassinger, S. Raymond, D. Aoki, V. Taufour, L.-P. Regnault,
J. Flouquet, Precise study of
the resonance at in URu2Si2, J. Phys. Soc.
Jpn. 79 (6) (2010) 064719.
doi:10.1143/JPSJ.79.064719.
URL http://jpsj.ipap.jp/link?JPSJ/79/064719/ -
[7]
H.-H. Kung, R. E. Baumbach, E. D. Bauer, V. K. Thorsmolle, W.-L. Zhang,
K. Haule, J. A. Mydosh, G. Blumberg,
Chirality density wave of
the ”hidden order” phase in URu2Si2, Science 347 (6228) (2015)
1339–1342.
doi:10.1126/science.1259729.
URL http://dx.doi.org/10.1126/science.1259729 -
[8]
K. Haule, G. Kotliar, Arrested kondo
effect and hidden order in URu2Si2, Nat. Phys. 5 (11) (2009)
796–799.
URL http://dx.doi.org/10.1038/nphys1392 -
[9]
J. T. Haraldsen, Y. Dubi, N. J. Curro, A. V. Balatsky,
Hidden-order
pseudogap in URu2Si2, Phys. Rev. B 84 (2011) 214410.
doi:10.1103/PhysRevB.84.214410.
URL http://link.aps.org/doi/10.1103/PhysRevB.84.214410 -
[10]
K. R. Shirer, J. T. Haraldsen, A. P. Dioguardi, J. Crocker, N. apRoberts
Warren, A. C. Shockley, C.-H. Lin, D. M. Nisson, J. C. Cooley, M. Janoschek,
K. Huang, N. Kanchanavatee, M. B. Maple, M. J. Graf, A. V. Balatsky, N. J.
Curro, Nuclear
magnetic resonance studies of pseudospin fluctuations in
URu2Si2, Phys. Rev. B 88 (2013) 094436.
doi:10.1103/PhysRevB.88.094436.
URL http://link.aps.org/doi/10.1103/PhysRevB.88.094436 - [11] M. B. Maple, J. W. Chen, Y. Dalichaouch, T. Kohara, C. Rossel, M. S. Torikachvili, M. W. McElfresh, J. D. Thompson, Partially gapped fermi surface in the heavy-electron superconductor URu2Si2, Phys. Rev. Lett. 56 (2) (1986) 185–188. doi:10.1103/PhysRevLett.56.185.
-
[12]
K. Hasselbach, J. R. Kirtley, P. Lejay,
Point-contact
spectroscopy of superconducting URu2Si2, Phys. Rev. B 46 (1992)
5826–5829.
doi:10.1103/PhysRevB.46.5826.
URL http://link.aps.org/doi/10.1103/PhysRevB.46.5826 - [13] J. A. Janik, H. D. Zhou, Y.-J. Jo, L. Balicas, G. J. MacDougall, G. M. Luke, J. D. Garrett, K. J. McClellan, E. D. Bauer, J. L. Sarrao, Y. Qiu, J. R. D. Copley, Z. Yamani, W. J. L. Buyers, C. R. Wiebe, Itinerant spin excitations near the hidden order transition in URu2Si2, J. Phys.: Condens. Matter 21 (19) (2009) 192202. doi:10.1088/0953-8984/21/19/192202.
-
[14]
W. Schlabitz, J. Baumann, B. Pollit, U. Rauchschwalbe, H. Mayer, U. Ahlheim,
C. Bredl,
Superconductivity and
magnetic order in a strongly interacting fermi-system: URu2Si2, in:
H. Ott (Ed.), Ten Years of Superconductivity: 1980 - 1990, Vol. 7 of
Perspectives in Condensed Matter Physics, Springer Netherlands, 1993, pp.
89–95.
doi:10.1007/978-94-011-1622-0_9.
URL http://dx.doi.org/10.1007/978-94-011-1622-0_9 -
[15]
N. H. van Dijk, F. Bourdarot, J. C. P. Klaasse, I. H. Hagmusa, E. Brück,
A. A. Menovsky,
Specific heat of
heavy-fermion URu2Si2 in high magnetic fields, Phys. Rev. B 56
(1997) 14493–14498.
doi:10.1103/PhysRevB.56.14493.
URL http://link.aps.org/doi/10.1103/PhysRevB.56.14493 -
[16]
A. de Visser, F. E. Kayzel, A. A. Menovsky, J. J. M. Franse, J. van den Berg,
G. J. Nieuwenhuys,
Thermal expansion and
specific heat of monocrystalline URu2Si2, Phys. Rev. B 34 (1986)
8168–8171.
doi:10.1103/PhysRevB.34.8168.
URL http://link.aps.org/doi/10.1103/PhysRevB.34.8168 -
[17]
B. Wolf, W. Sixl, R. Graf, D. Finsterbusch, G. Bruls, B. L uthi, E. Knetsch,
A. Menovsky, J. Mydosh, Elastic
properties of the heavy fermion superconductor URu2Si2, J. Low Temp.
Phys. 94 (3-4) (1994) 307–324.
doi:10.1007/BF00754672.
URL http://dx.doi.org/10.1007/BF00754672 -
[18]
D. A. Bonn, J. D. Garrett, T. Timusk,
Far-infrared
properties of URu2Si2, Phys. Rev. Lett. 61 (1988) 1305–1308.
doi:10.1103/PhysRevLett.61.1305.
URL http://link.aps.org/doi/10.1103/PhysRevLett.61.1305 -
[19]
M. K. Liu, R. D. Averitt, T. Durakiewicz, P. H. Tobash, E. D. Bauer, S. A.
Trugman, A. J. Taylor, D. A. Yarotski,
Evidence of a
hidden-order pseudogap state in URu2Si2 using ultrafast optical
spectroscopy, Phys. Rev. B 84 (2011) 161101.
doi:10.1103/PhysRevB.84.161101.
URL http://link.aps.org/doi/10.1103/PhysRevB.84.161101 -
[20]
J. Levallois, F. Lévy-Bertrand, M. K. Tran, D. Stricker, J. A. Mydosh, Y.-K.
Huang, D. van der Marel,
Hybridization gap
and anisotropic far-infrared optical conductivity of URu2Si2, Phys.
Rev. B 84 (2011) 184420.
doi:10.1103/PhysRevB.84.184420.
URL http://link.aps.org/doi/10.1103/PhysRevB.84.184420 - [21] K. Matsuda, Y. Kohori, T. Kohara, K. Kuwahara, H. Amitsuka, Spatially inhomogeneous development of antiferromagnetism in URu2Si2: Evidence from 29Si NMR under pressure, Phys. Rev. Lett. 87 (8) (2001) 087203. doi:10.1103/PhysRevLett.87.087203.
-
[22]
E. Hassinger, G. Knebel, K. Izawa, P. Lejay, B. Salce, J. Flouquet,
Temperature-pressure
phase diagram of URu2Si2 from resistivity measurements and ac
calorimetry: Hidden order and Fermi-surface nesting, Phys. Rev. B 77
(2008) 115117.
doi:10.1103/PhysRevB.77.115117.
URL http://link.aps.org/doi/10.1103/PhysRevB.77.115117 -
[23]
K. Syassen, Ruby under
pressure, High Pressure Research 28 (2) (2008) 75–126.
arXiv:http://dx.doi.org/10.1080/08957950802235640, doi:10.1080/08957950802235640.
URL http://dx.doi.org/10.1080/08957950802235640 -
[24]
A. P. Reyes, E. T. Ahrens, R. H. Heffner, P. C. Hammel, J. D. Thompson,
Cuprous
oxide manometer for high pressure magnetic resonance experiments, Rev. Sci.
Instrum. 63 (5) (1992) 3120–3122.
doi:http://dx.doi.org/10.1063/1.1142564.
URL http://scitation.aip.org/content/aip/journal/rsi/63/5/10.1063/1.1142564 -
[25]
K. Kitagawa, H. Gotou, T. Yagi, A. Yamada, T. Matsumoto, Y. Uwatoko,
M. Takigawa, Space efficient
opposed-anvil high-pressure cell and its application to optical and nmr
measurements up to 9 gpa, Journal of the Physical Society of Japan 79 (2)
(2010) 024001.
arXiv:http://dx.doi.org/10.1143/JPSJ.79.024001, doi:10.1143/JPSJ.79.024001.
URL http://dx.doi.org/10.1143/JPSJ.79.024001 -
[26]
N. Harrison, M. Jaime, J. A. Mydosh,
Reentrant hidden
order at a metamagnetic quantum critical end point, Phys. Rev. Lett. 90
(2003) 096402.
doi:10.1103/PhysRevLett.90.096402.
URL http://link.aps.org/doi/10.1103/PhysRevLett.90.096402 -
[27]
C. Pfleiderer, J. A. Mydosh, M. Vojta,
Pressure dependence
of the magnetization of URu2Si2, Phys. Rev. B 74 (2006) 104412.
doi:10.1103/PhysRevB.74.104412.
URL http://link.aps.org/doi/10.1103/PhysRevB.74.104412 -
[28]
K. R. Shirer, A. C. Shockley, A. P. Dioguardi, J. Crocker, C. H. Lin,
N. apRoberts Warren, D. M. Nisson, P. Klavins, J. C. Cooley, Y.-f. Yang,
N. J. Curro, Long range
order and two-fluid behavior in heavy electron materials, Proc. Natl. Acad.
Sci. 109 (45) (2012) E3067–E3073.
doi:10.1073/pnas.1209609109.
URL http://dx.doi.org/10.1073/pnas.1209609109 - [29] O. O. Bernal, C. Rodrigues, A. Martinez, H. G. Lukefahr, D. E. MacLaughlin, A. A. Menovsky, J. A. Mydosh, 29Si NMR and hidden order in URu2Si2, Phys. Rev. Lett. 87 (19) (2001) 196402. doi:10.1103/PhysRevLett.87.196402.
-
[30]
S. Kambe, Y. Tokunaga, H. Sakai, T. D. Matsuda, Y. Haga, Z. Fisk, R. E.
Walstedt, NMR
study of in-plane twofold ordering in URu2Si2, Phys. Rev. Lett. 110
(2013) 246406.
doi:10.1103/PhysRevLett.110.246406.
URL http://link.aps.org/doi/10.1103/PhysRevLett.110.246406 - [31] Y. Bang, M. J. Graf, N. J. Curro, A. V. Balatsky, Nuclear spin-lattice relaxation rate in pumga5 (m = rh, co): A two-component spin-fermion model, Phys. Rev. B 74 (5) (2006) 054514. doi:10.1103/PhysRevB.74.054514.
-
[32]
C. H. Lin, K. R. Shirer, J. Crocker, A. P. Dioguardi, M. M. Lawson, B. T. Bush,
P. Klavins, N. J. Curro,
Evolution of
hyperfine parameters across a quantum critical point in
, Phys. Rev. B 92 (2015) 155147.
doi:10.1103/PhysRevB.92.155147.
URL http://link.aps.org/doi/10.1103/PhysRevB.92.155147