For submission to Monthly Notices
A Model For Intergalactic Filaments and Galaxy Formation During the First Gigayear
Abstract
We propose a physically based, analytic model for intergalactic filaments during the first gigayear of the universe. The structure of a filament is based upon a gravitationally bound, isothermal cylinder of gas. The model successfully predicts for a cosmological simulation the total mass per unit length of a filament (dark matter plus gas) based solely upon the sound speed of the gas component, contrary to the expectation for collisionless dark matter aggregation. In the model, the gas, through its hydrodynamic properties, plays a key role in filament structure rather than being a passive passenger in a preformed dark matter potential. The dark matter of a galaxy follows the classic equation of collapse of a spherically symmetric overdensity in an expanding universe. In contrast, the gas usually collapses more slowly. The relative rates of collapse of these two components for individual galaxies can explain the varying baryon deficits of the galaxies under the assumption that matter moves along a single filament passing through the galaxy centre, rather than by spherical accretion. The difference in behaviour of the dark matter and gas can be simply and plausibly related to the model. The range of galaxies studied includes that of the so-called “too big to fail” galaxies, which are thought to be problematic for the standard CDM model of the universe. The isothermal-cylinder model suggests a simple explanation for why these galaxies are, unaccountably, missing from the night sky.
keywords:
cosmology: theory – galaxies: formation – galaxies: intergalactic medium – cosmology: dark ages, reionization, first stars – galaxies: structure – galaxies: haloes –1 Introduction
In the currently popular CDM model of the universe, collisionless dark matter dominates over baryons by a factor of nearly six (see Frieman et al. 2008 for review). A two-stage model for galaxy formation (White & Rees, 1978) has survived as a general paradigm, in which the overall architecture of the universe is formed by the potential wells formed by the collisionless gravitation of the dark matter For reviews see Frenk & White (2012); Kravtsov & Borgani (2012); Conselice (2014); Somerville & Davé (2015). The luminous structures that might be observed then would result from dissipational processes of the baryons trapped within these wells. This paradigm has justified the extensive use of N-body simulations using only dark matter to understand structure formation in the universe
The present paper challenges this paradigm in the case of intergalactic filaments during the first gigayear. Using a cosmological simulation that includes gas hydrodynamics, radiative transfer, and chemistry in addition to dark matter, we show that the mass per unit length of intergalactic filaments depends upon the sound speed of the gas in the manner expected if the filaments were gravitationally bound, isothermal cylinders of gas (Stodólkiewicz, 1963; Ostriker, 1964) with dark matter mixed in.
An important implication of this model is that the filaments should have a preferred size as deduced from the simple analytic expression for their structure. This is because the mass per unit length of such a cylinder depends solely upon the temperature and ionization state of the gas, which in turn are constrained by the Lyman alpha cooling floor. A preferred size for intergalactic filaments is not expected from collisionless structure formation by dark matter alone111Dark matter does have a preferred length scale arising from the sound horizon at recombination. However, this scale is vastly greater than that of galaxies and their attached filaments..
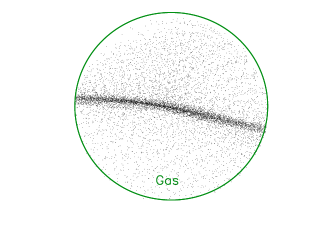
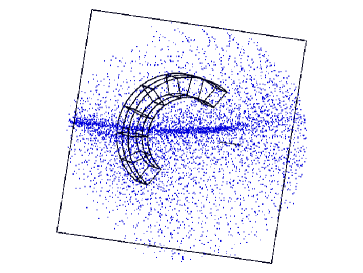
The present study was motivated by our previous simulation studies (Harford et al., 2008; Harford & Hamilton, 2011), which showed that gas and dark matter may assume very different structures shortly after the end of the first gigayear at a redshift of . For example, Figure 1 shows separate images of gas and dark matter for the same projection of a sphere centred upon a galaxy. The gas appears as a relatively smooth filament while the dark matter is more irregular, with discrete clumps positioned along the filament. We showed that the gravitational potential of the gas resembles that of a gravitationally bound, isothermal cylinder in cases where the filament is highly enriched in baryons.
In investigations that led to the present paper, we began to explore the development of the filaments throughout the first gigayear of the simulation, in order to understand the origin of the isothermal structure. We found that baryon enrichment of filaments emerges late in the first gigayear. Earlier most of the filaments are not enriched, and yet, as we show in this paper, can be described as gravitationally bound, isothermal cylinders, provided that we make the simplifying assumption that the dark matter adds to the gravitational potential as if it were uniformly mixed with the gas.
Current thinking ascribes an important role to intergalactic filaments in the transport of gas into the small galaxies that form at high redshift. Two modes of gas entry into galaxies have been described in the literature. In the “hot mode” incoming gas is shock heated when it encounters the potential well of the halo (Rees & Ostriker, 1977). The shocked gas is elevated in temperature to where it can cool efficiently and then enter the halo. This mode is thought to predominate for galaxies larger than a few times and at low redshifts. It is thought that for smaller galaxies, like the ones we have studied, the gas is not heated because the smaller potential wells cannot sustain shocks (Birnboim & Dekel, 2003). In this “cold mode” scenario, gas passes directly into the galaxy without supersonic heating, perhaps mediated by intergalactic filaments (Birnboim & Dekel, 2003; Binney, 2004; Katz et al., 2003; Kereš et al., 2005; Dekel & Birnboim, 2006; Ocvirk et al., 2008; Kereš et al., 2009; Dekel et al., 2009; Brooks et al., 2009).
A gravitationally bound, isothermal cylinder provides a physical framework for thinking about the motion of matter along an intergalactic filament. In the present paper, we show that the gas is generally retarded in its entry into the galaxy centre relative to the dark matter. We suggest that it is the hydrodynamic pressure of the gas, counter-balancing the inward force of gravity, that causes this behaviour.
We show that the different behaviours of dark matter and gas are consistent with a simple scheme for galaxy formation in which the dark matter collapses according to collisionless theory, while the gas tends to remain in extended, isothermal cylinders in which infall into the galaxy is retarded by the pressure of the gas.
In addition we show that the different rates of accretion of dark matter and gas predict roughly the baryon deficits of the final galaxies under the assumption that matter moves along a single filament passing through the galaxy centre rather than by spherical accretion.
Understanding the structure of intergalactic filaments may not only provide insights into the mechanisms and pace of early galaxy formation, but may also place limits upon the sizes of galaxies that can form from a filamentary precursor. In this way the model might be relevant to the so-called “missing satellite” problem (Kauffmann et al., 1993; Klypin et al., 1999; Moore et al., 1999), which refers to the discrepancy between the observed number of satellite galaxies of the Milky Way and the predicted number of dark matter haloes from N-body simulations containing only dark matter. An additional, “too big to fail” problem has also arisen in which a class of dark matter haloes thought to be massive enough to support star formation fail to be observed (Boylan-Kolchin et al., 2009). The model suggests a simple explanation for this anomaly. Resolution of these problems is critical to the viability of the cold dark matter hypothesis.
Most previous studies on intergalactic filaments have dealt with larger structures at later times in a more complex universe. Our study suggests that the intergalactic filaments associated with small galaxies during the first gigayear, and present during the critical period of reionization, may be a relatively simple model system to study.
The plan of the paper is as follows. In Section 2 we describe the self-consistent simulation of the first gigayear that we have analyzed. Section 3 gives an overview of principal features of the model with illustrative diagrams. Section 4 compares the model to the simulation. Section 4.1 sets out exactly what we mean by a galaxy in the simulation and how we decide where it is at any given time.
Section 4.2 begins with a brief summary of the algorithm for identifying intergalactic filaments associated with specific galaxies. The algorithm is described in more detail with diagrams in the Appendix. Then the basic structural equations of a gravitationally bound, isothermal cylinder are laid out as developed by Stodólkiewicz (1963) and Ostriker (1964). The agreement of the filaments with such structures is then tested by comparing the total mass per unit length to that predicted by the model.
Section 4.3 shows that the collapse of the dark matter can be described by the textbook collapse of a spherically symmetric overdensity. Section 4.4 describes how we compare and contrast the collapse of gas and dark matter onto the final galaxy. Three categories of galaxies are distinguished in this regard: plunging-gas, retreating-gas, and lingering-gas. Section 4.5 relates the findings to the baryon deficits of the final galaxies. The rates of movement of the gas and dark matter in the lingering-gas galaxies argue for collapse along a single filament as opposed to spherical accretion.
Section 4.6 relates the three categories of galaxies to the formation of isothermal cylinders and to the mass available to form filaments. Section 4.7 relates the model to the so-called “too big to fail” galaxies.
Section 4.8 explores an alternative model in which filament structure is determined primarily by dark matter.
Section 4.9 presents evidence that the filaments are aligned as predicted by the model.
2 Cosmological simulation
As in our previous work (Harford et al., 2008; Harford & Hamilton, 2011), the results reported in the present paper are based on a flat CDM cosmological simulation that includes gas hydrodynamics, radiative transfer, and chemistry in addition to dark matter. The simulation followed a comoving Mpc cube on a grid up to a redshift of using a “softened Lagrangian hydrodynamics” (SLH-P3M) code (Gnedin, 1995; Gnedin & Bertschinger, 1996). The cosmological parameters are , , , and .
Dark matter is computed with collisionless particles of mass . Gas dynamics is computed on a quasi-Lagrangian mesh that deforms adaptively to provide higher resolution in higher density regions. The mass of a gas particle is initially , but each gas particle mass may adjust slightly as the hydrodynamic computation evolves.
3 Overview of Model
A simple paradigm for gravitational collapse begins with collapse in one dimension to produce a plane. Further collapse in a second dimension produces a rod, which then collapses in the third dimension to a quasi-spherical ball (Zel’dovich, 1970; Park, 1990; Bertschinger & Gelb, 1991; Cen & Ostriker, 1993). Visual inspection of the simulation suggested that this paradigm would be a good starting point.
It is common to assume that galaxies form at the intersections of filaments. This is because large-scale views of simulations at late times show galaxies as nodes in a complex network of filamentous material. This paper takes a different point of view for the first gigayear. We consider an individual filament to be an intermediate structure in the formation of a galaxy. In the model an individual galaxy can be traced back in time to a single rod, in the centre of which a quasi-spherical galaxy will form as the contents of the rod collapse. After the first gigayear, multiple collisions may lead to the build up of complex networks, which we will not consider here.
In the model the rod is a gravitationally bound, isothermal cylinder of gas with comingled dark matter. Initially the gas and dark matter are uniformly mixed. The dark matter then proceeds to collapse toward the centre of the rod, where the future galaxy will be found. The gas, in general, collapses more slowly than the dark matter because the pressure of the gas retards its flow into the galaxy.
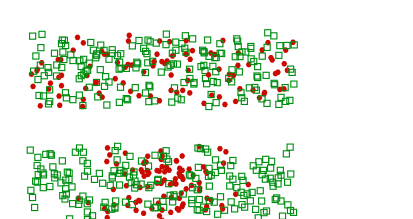
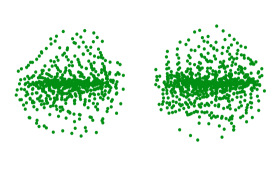
The rod, in its initial form and during differential collapse, is shown schematically in Figure 2. In the upper image the red, filled circles representing the dark matter are uniformly mixed with the green squares representing the gas. In the lower image, showing a later time, the dark matter particles have begun to coalesce into the centre of the rod leaving behind the gas particles. An actual example from the simulation is shown in Figure 3.
4 Comparison of the model to the simulation
The purpose of this section is to compare the model proposed in §3 to the cosmological simulation described in §2.
4.1 Galaxies
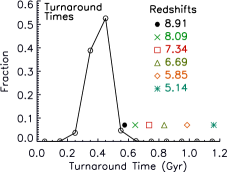
The objects referred to as “galaxies” in the present paper were identified at the end of the simulation, at a redshift of 5.134 (1.15 gigayears after the big bang), from the total mass distribution by DENMAX (Bertschinger & Gelb, 1991). The positions of the individual dark matter particles associated with each of these galaxies can be followed throughout the simulation. For a given galaxy defined by DENMAX at the end of the simulation, we define it at earlier times as the arrangement of its constituent dark matter particles at that time. The centre of the galaxy at any time is defined as the centre of mass of its dark matter particles, and the formation of each galaxy is followed with time in a local coordinate system relative to that centre of mass. In this coordinate system the dark matter particles of each galaxy exhibit an initial expansion followed by a well defined turnaround. The transient, quasi-spherical sub-structures seen at intermediate redshifts are not treated as separate galaxies.
In order to follow the development of single galaxies in time since the big bang, we focus on just the largest galaxies identified at the end of the simulation just after the first gigayear. The galaxies considered range in total mass from about to several times . The total mass of the galaxy is defined to include dark matter, gas, and stellar material.
4.2 Isothermal Filaments
To avoid subjective bias in identifying filaments, we adopt an objective algorithm which is detailed in Appendix A. Shortly after turnaround of the dark matter, the single rod of the model appears embedded in a planar slab of material. We take advantage of this situation to select the filaments in the two dimensions of the principal plane. The filaments are selected using only the gas component because its structure is more regular than that of the dark matter. Although the model in its purest form is best understood as the collapse of a single rod, we will refer to the two halves of the rod as separate filaments because both halves are not always present in the structures surviving our selection algorithm. No more than two filaments are selected for a single galaxy. When two are present, the filaments are usually oriented end-to-end as if part of a single, continuous structure.
The mass per unit length, , predicted for a gravitationally bound, isothermal gas cylinder is
| (1) |
where is the isothermal sound speed and is the gravitational constant (Stodólkiewicz, 1963; Ostriker, 1964). The sound speed at temperature is
| (2) |
where is the Boltzmann constant, the mass of the hydrogen atom and a mean particle mass to take into account the ionization of the hydrogen. The factor of corrects for the contribution of neutral helium to the mean atomic weight.
The important point here is that the mass per unit length of a filament depends only upon its temperature and ionization state, and not upon the concentration of the gas in the transverse direction,
The presence of dark matter adds gravitational field without any additional pressure. The simplest way, and the way we adopt, to account for the effect of dark matter is to assume that the gas and dark matter are uniformly mixed. The result of this assumption is that Equation 1 predicts, not the mass per unit length of the gas, but the total mass per unit length including the dark matter222The amount of stellar material in the filaments in negligible, and we neglect it.. It is interesting to note that this scheme means that if the relative amounts of gas and dark matter in the filament vary, then they must vary in opposite directions to keep the total in line with the sound speed. This situation contrasts with the conventional assumption that gas follows dark matter.
Appendix A describes the algorithm for selecting regions of the filaments to study. For detailed analysis, a filament segment is defined as the gas and dark matter within a cylinder of length twelve proper kiloparsecs and a radius of six proper kiloparsecs centred on the filament region selected as described in Appendix A. Even though the mass of the cylinder extends to infinity in theory, we find that most of the mass is within this proper radius. The orientation of the axis of the cylinder is determined by a principal component analysis.
We might expect the development of a filament to depend upon the local thermal history. Reionization occurs during the first gigayear. However, different regions of the simulation reionize at different times. For this reason we present the structure of the filaments using the square of the sound speed as a proxy for time. This scheme accomodates the possibility that different filaments are at different stages of development at the same time. The sound speed depends only upon the temperature and ionization state of the gas and is independent of the density. It is computed as the average of the squares of the sound speeds of the individual gas particles in the filament segment being analyzed. The sound speed of a gas particle is computed from its temperature and ionization state, which are independently computed. In the simulation the temperature and ionization are computed self-consistently from the radiation produced at specific loci of star formation. There is no superimposed, ionizing field as in many other simulations.
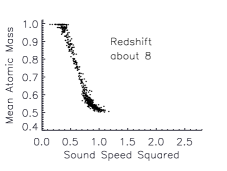
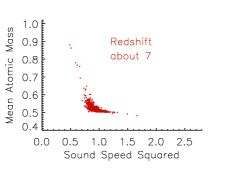
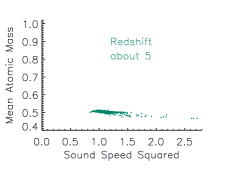
The course of reionization of the individual filament segments is shown in the scatter plot in Figure 4, in which each point is a filament segment at one of the six redshifts we studied. The abcissa is the average of the square of the sound speeds of the gas particles in the segment. The ordinate shows the mean mass per particle (nuclei and electrons) in the gas of the segment, which decreases as a result of reionization. It is clear that the segments at any given redshift are present in a range of different stages of reionization. In this paper the square of the sound speed is always expressed in the same units chosen to facilitate comparisons with the predictions of the model in Figure 5 and Figure 7.
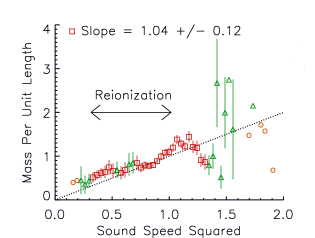
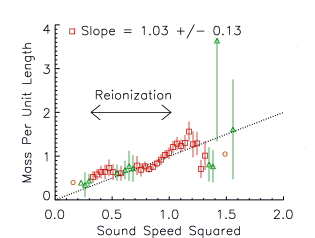
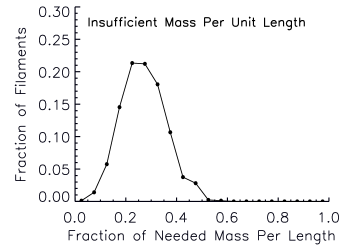
Figure 5 is at the crux of the argument for gravitationally bound, isothermal cylinders. It shows, over a range of sound speeds, that the total mass per unit length of the filament segments can be predicted from the sound speed of the gas using Equation 2. The value computed for the gas from this equation is divided by the overall gas fraction of the segment to give the total mass per unit length plotted in the figure. The units of the axes have been chosen for convenience so that the model predicts a slope of one. The ordinate shows the average for filaments segments in bins of sound speed squared on the abscissa. Bins having at least fifteen members, shown by red squares, were chosen for a linear regression analysis. The slope obtained, , shows good agreement with prediction.
The prediction, shown by the dotted, diagonal line of unit slope in Figure 5 assumes for simplicity that the dark matter is uniformly intermixed with the gas and contributes to the gravitational field in proportion to its abundance333It is impractical to subdivide the filament segments into regions with different amounts of dark matter even though the dark matter is clumpy. The gas tends to be smoother and not to clump with the dark matter. An alternative scheme, in which the gas is concentrated in a relatively flat central part of a dark matter potential well would predict for most segments a gas mass per unit length greater than observed by a factor of about five, since in the latter scheme the gas behaves as if it were a pure gas cylinder without dark matter. The measured mass per unit length is more consistent with the model where the gas and dark matter are uniformly mixed.
In Figure 5 the sparser bins to the right (green triangles) show only a general upward trend consistent with prediction. Orange circles indicate bins with a single member.
The period of best agreement with the model corresponds to the period of active reionization when the gas in the segments is partially ionized. The extent of this region is indicated by the horizontal, two-headed arrow. During this period most of the change in sound speed is due to reionization. The temperature changes little.
One should not conclude from these results that the model applies only to the reionization period. During the limited period of the simulation only a few of the filaments have progressed significantly beyond reionization, and these are associated with the largest galaxies. We will argue in Section 4.6 that excessive mass can lead to deviation from the model. However, the small numbers of segments in these sparse bins make it difficult to tell just how well the model works for the largest galaxies.
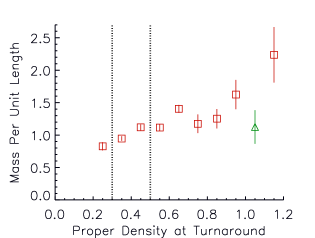
Another variable that might be expected to affect the filament structure is the proper density at turnaround. Figure 6 shows that the total mass per unit length does indeed increase with density at turnaround as one might expect. To demonstrate that the correlation of Figure 5 is not an artifact resulting from a correlation of sound speed with density at turnaround, we tested filaments from a restricted range of turnaround densities. Figure 7 shows a version of Figure 5 in which only galaxies within a narrow range of turnaround densities, those between the two vertical, dotted lines in Figure 6, are included. Figures 5 and 7 are almost identical.
4.3 Collapse of Dark Matter
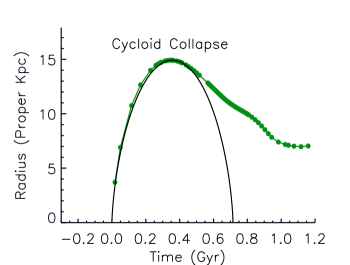
The simplest theory of galaxy formation in an expanding universe is that of the collapse of a spherically symmetric overdensity (Peacock, 1999). Sugerman et al. (2000) find that, despite its simplifying assumptions, the spherical model provides reasonable predictions for properties of dark matter haloes. The spherical model predicts that the radius of a mass evolves with time as a cycloid (Peacock, 1999),
| (3) |
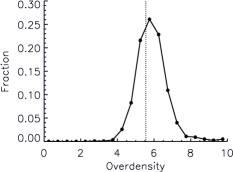
The cycloid describes expansion from zero to a maximum radius, the turnaround radius , as goes from to , followed by contraction as goes from to . To compare this theory with a given galaxy in the simulation, the average radius of the dark matter particles is computed at a series of times before and after turnaround. To compare these radii to the cycloid prediction, the mass in equation 3 is computed from the actual turnaround sphere using the theoretically expected overdensity of (Peacock, 1999).
We find the spherical model to be an excellent starting point for understanding the collapse of the dark matter of each galaxy. Figure 8 shows, for an example galaxy, the average radius of the galaxy’s dark matter particles from their centre of gravity and the corresponding cycloid. Virtually all the galaxies fit a cycloid at least up until turnaround,
The fitted cycloid is translated slightly in time so that the turnaround time coincides with that in the simulation. We find that the cycloid generally begins its ascent either at the beginning of the simulation or slightly before. We interpret this result to mean that the galaxies originate from fluctuations imposed at the start of the simulation, rather than from density variations resulting from subsequent events.
4.4 Contrasting Motion of Dark Matter and Gas
Unlike the dark matter particles, the individual gas particles in the simulation cannot be traced throughout the simulation. Rather, they are generated anew after each hydrodynamic timestep. Since the structures are continually moving and changing shape, it is difficult to pin down gas movements on a small scale. What we can compute unambiguously, however, is an overall measure of collapse. We compute this separately for the gas and the dark matter so that we can compare their relative rates of motion into the centre of the galaxy.
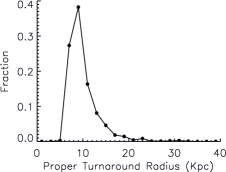
At each redshift we compute as a function of redshift the proper radius of a sphere centred on the galaxy that includes just that mass of gas or dark matter that was present inside the turnaround radius at the time of turnaround (the turnaround radius is the average radius of the dark matter particles of a galaxy at the time of turnaround).
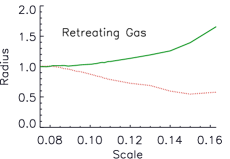
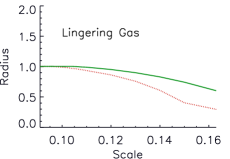
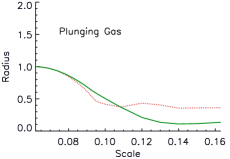
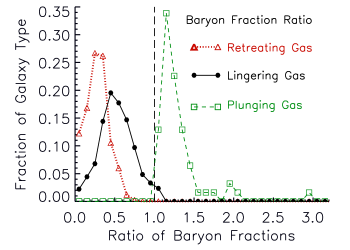
Figure 10 shows some individual galaxy histories that illustrate the types of results obtained. The abscissa shows the cosmic scale factor starting from the time of turnaround, which is slightly different for different galaxies. The ordinate is the radius as a fraction of the turnaround radius. Most of the time the gas collapses more slowly than the dark matter as shown in the first two graphs. In the left graph the gas does not collapse fast enough to outrun the expansion of the universe, and the gas radius increases with time. We call this the “retreating gas” type of galaxy. We will see that these are among the least massive of the galaxies we have studied. In the “lingering gas” type, shown in the middle graph, the gas collapses but more slowly than the dark matter. We will see in later sections that the filaments associated with these galaxies have the best fit to an isothermal cylinder. Finally, the right graph shows the gas collapsing more rapidly than the dark matter, the “plunging gas” case. There are retreating-gas galaxies, lingering-gas galaxies, and plunging-gas galaxies.
We will refer to the sphere containing the turnaround amount of mass as the collapse sphere for the gas or dark matter as the case may be for the time in question. The proper radius of the collapse sphere divided by the proper turnaround radius we will call the collapse fraction. When the radius is taken at the end of the simulation we will refer to this ratio as the final collapse fraction of the gas or dark matter.
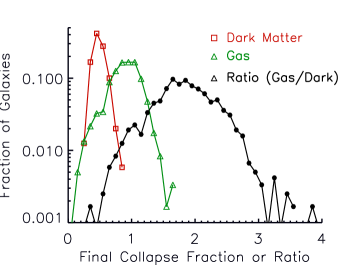
Figure 11 shows histograms of the final collapse fractions of dark matter and gas for the galaxies studied in this paper. The histogram for the dark matter (the red curve with squares) peaks at a collapse fraction of about one half, in agreement with the virial expectation for collisionless particles subject only to gravitation. In contrast, the gas (green curve with triangles) generally collapses more slowly.
The black curve with filled circles in Figure 11 shows a histogram of the ratio of the collapse fraction of the gas to that of the dark matter for the same galaxy. The small fraction of the area under the curve to the left of a ratio of shows that most of the time the gas collapses more slowly than does the dark matter. We suggest that the pressure in the gas filament counter-balancing the force of gravity is responsible for this difference in behaviour.
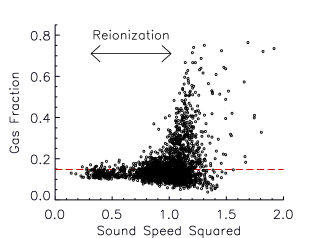
The end of reionization marks the beginning of a period of increasing deviation of the gas fraction of the filament from the cosmic value as shown in the scatter plot in Figure 12. Here each open circle represents a filament segment.
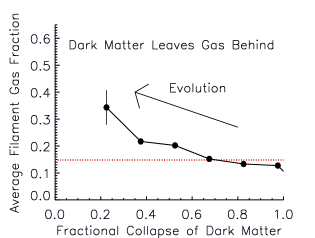
We suggest that this effect occurs when rapidly collapsing dark matter effectively leaves behind the gas in the filaments. Figure 13 shows the average gas fraction of filament segments as a function of the collapse fraction of the dark matter of the associated galaxy at the redshift of the filament. As the dark matter of a galaxy collapses, the filaments of that galaxy can become more baryon rich. Note that in this figure maximal collapse is at the left and minimal collapse at the right.
4.5 Filamentary as Opposed to Spherical Accretion.
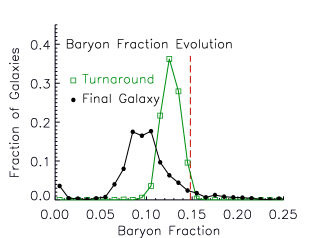
Unlike many of the final galaxies, the turnaround sphere has a baryon fraction close to the cosmic value. The differential collapse of gas and dark matter can lead to significant baryon deficits in the final galaxies. Figure 14 compares histograms of the baryon fraction at turnaround and in the final galaxies.
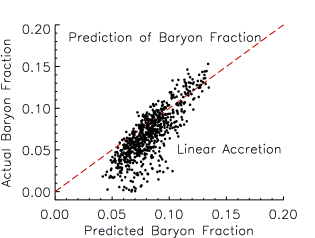
The differing motions of the dark matter and gas that we have just described in Section 4.4 can be related in a simple way to these baryon deficits. Consider, for simplicity, the lingering-gas situation in which the dark matter collapses faster than the gas. At the end of the simulation the final collapse sphere for the galaxy’s dark matter will have a baryon fraction less than that of the turnaround sphere and closer to that of the baryon fraction of the final galaxy. The gas in this sphere is some fraction of the gas at turnaround. If, for simplicity, we assume that the gas in the both the initial turnaround sphere and the final dark matter collapse sphere is in the form of a uniform filament that runs along the diameter of both spheres, then the fraction of the turnaround gas that is in the dark matter collapse sphere can be estimated from the ratio of the radius of this sphere to that of the larger gas collapse sphere. Thus the baryon fraction of the final dark matter collapse sphere, can then be computed knowing the baryon fraction at turnaround.
Figure 15 shows that this simple filamentary scheme predicts the baryon fraction of the final dark matter collapse sphere quite well. Each point on the graph represents a single galaxy. The abscissa is the predicted baryon fraction and the ordinate is the actual one. The red, dashed line represents agreement between the two. Excluded from this plot are plunging-gas galaxies where the gas collapses as fast or faster than the dark matter. These are mostly the largest galaxies. Also excluded are the retreating-gas galaxies where the gas fails to turn around even though the dark matter does. These are the galaxies where the final collapse fraction of the gas is greater than or equal to one.
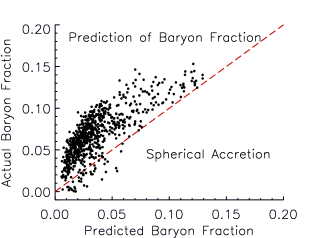
Figure 16 show the contrasting predictions if the relevant ratio of radii were instead cubed, as would be more appropriate for spherical accretion. The filamentary accretion model is a much better fit than is the spherical one.
The baryon fractions shown in Figure 15 and Figure 16 are for the final dark matter collapse sphere and are somewhat lower than those of the final galaxies as identified by the galaxy finding algorithm DENMAX. Since the turnaround sphere is based upon the average radius of the dark matter particles at turnaround, we might expect the final dark matter collapse sphere to represent an inner sphere of the galaxy. DENMAX might be adding to this a more baryon rich region at the periphery of the galaxy.
From the results of this section we suggest that a major cause of baryon deficits in the galaxies we have studied is the retarded motion of the gas relative to the dark matter. This situation is in constrast to a mechanism whereby gas already in the halo is subsequently expelled.
4.6 Isothermal Cylinders Retard Gas
In Section 4.4 we distinguished three types of galaxies. The ones where the gas moves toward the galaxy as fast or faster than the dark matter we referred to as “plunging-gas” galaxies. Those where the gas shows no net movement toward the galaxy we referred to as “retreating-gas” galaxies. Those where the gas moves toward the galaxy but not as fast as the dark matter we referred to as “lingering-gas” galaxies.
The filaments of these three galaxy types have been tested separately for evidence of gravitationally bound, isothermal cylinders. Figure 17 shows the correlation of the mass per unit length with the square of the sound speed. The filaments from the lingering-gas galaxies (black, open circles) show the best match. The filaments of the retreating-gas galaxies (red triangles) fail to keep up with the expansion of the universe. The plunging-gas galaxies, shown by the green squares have too much mass for isothermal cylinders.
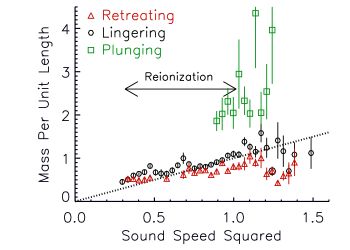
These contrasting results can be understood in terms of the key property of a gravitationally bound, isothermal cylinder that the mass per unit length is limited by the sound speed of the gas. We might expect the cylinder to break down if the overall collapsing mass is overwhelmingly larger than can be accomodated at the current sound speed. This situation would correspond to the plunging-gas case. On the other hand, the filaments of the retreating-gas galaxies might have too little matter to withstand the expansion of the universe.
If an isothermal cylinder does form, one would expect the hydrodynamic forces that stabilize it to compete with the gravitational pull of the dark matter that is collapsing to form the halo of the galaxy. This effect would be expected to retard the flow of the gas relative to that of the dark matter. Only the excess gas that cannot be accomodated into the cylinder structure would be free to proceed unhindered. The situation might describe the filaments of the lingering-gas galaxies.
A measure of the mass per unit length available to form a filament can be obtained by dividing the total mass of the turnaround sphere by its proper diameter, a quantity we will call the available mass per unit length, Figure 18 shows histograms of the available mass per unit length for the three galaxy types. The histogram for the lingering-gas galaxies peaks at the mass per unit length value corresponding to a sound speed squared of one in Figure 5, Figure 7, and Figure 17. This value, which marks the end of reionization, is indicated by the vertical, dark green, dashed line. The retreating-gas galaxies peak to the left and the plunging-gas galaxies to the right.
The change in baryon fraction between turnaround and the final collapse sphere for the three galaxy types is shown in Figure 19. As expected the retreating-gas galaxies lose the most baryons and the lingering-gas galaxies lose fewer baryons. The plunging-gas galaxies actually gain baryons.
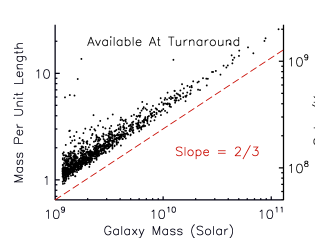
As expected, available mass per unit length increases with the total mass of the final galaxy. This relation is shown in Figure 20. Since the turnaround radius, and hence the mass within it as well, is determined by the average radius of the galaxy’s dark matter at turnaround, a simple hypothesis is that the log of the available mass per length should be proportional to the log of the total galaxy mass with a slope of two-thirds. The figure, in which each symbol represents a single galaxy, shows approximate agreement with this simple, self-similar picture.
4.7 Too Big To Fail Galaxies
Considerable success has been seen in attempts to match observed galaxies to haloes seen in simulations based upon the CDM model (for a review see Somerville & Davé (2015)). A circular velocity for observed galaxies can be derived from the Doppler broadening of HI lines. A reasonable relation between this measurement and the circular velocity of simulated haloes can be adduced which leads to rough agreement between the number densities of observed and simulated galaxies as a function of circular velocity.
However, important discrepancies remain at low halo masses. The term “too big to fail” has been applied to haloes having a circular velocity between about and (Boylan-Kolchin et al., 2009, 2011, 2012; Ferrero et al., 2012; Garrison-Kimmel et al., 2014; Tollerud et al., 2014; Papastergis et al., 2015; Klypin et al., 2015; Papastergis & Shankar, 2016). The frequency of these galaxies in observations is much lower than what would be predicted from the CDM model. The choice of terminology comes from the paradox that these galaxies are not seen despite apparently being massive enough to retain much or all of their gas throughout reionization. This situation is in contrast to galaxies with lower circular velocities, whose relative absence from observation is more easily explained by reionization.
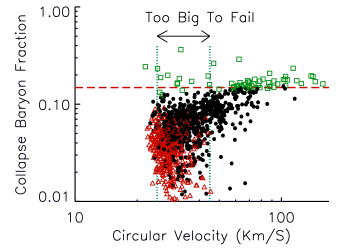
The “too big to fail” concept is based on observations of present day galaxies, whose detailed histories are uncertain. However, the simulated galaxies we studied are expected to include the mass range of the “too big to fail” phenomenon, and so might be relevant models. The scatter plot of Figure 21 shows the baryon fraction of the final collapse sphere as a function of the circular velocity of its dark matter as estimated from Equation 4.
| (4) |
where is the circular velocity, the mass of dark matter, the radius of the sphere, and the gravitational constant. The approximate circular velocity range of the “too big to fail” galaxies is delimited by the vertical, light blue, dotted lines. These galaxies have significant baryon deficits that might make them difficult to observe. The green squares represent the galaxies where the gas collapses as fast or faster than the dark matter, ie. the plunging-gas galaxies. The baryon fraction for these galaxies is close to the cosmic value. The red triangles represent the retreating-gas galaxies, where the gas fails to turnaround. As might be expected these are clustered at the low end of the circular velocity range and have the greatest baryon deficits. The black, filled circles are the lingering-gas galaxies. We suggest that the lingering-gas galaxies are the “too big to fail” galaxies.
We suppose that the formation of gravitationally bound, isothermal cylinders inhibits the collapse of gas into haloes otherwise thought to be massive enough to have plenty of gas. These galaxies are then missing from observations because they form too few stars, that is, they are “too big to fail” but fail because of the structure of the filaments.
4.8 An Alternative Dark Matter Model
In this section we consider an alternative filament model in which the gas is passively trapped in an overwhelming dark matter potential determined by the aggregation properties of dark matter. Could such a model be consistent with the filaments we have studied?
We do not favor this model because the filaments are undergoing reionization during the time in question, presumably by ionizing radiation coming in from the outside. It is not clear theoretically how external ionizing radiation would affect the aggregation properties of the dark matter except through its effect on the gas. Even a collection of the smallest galaxies has filament gas with the full range of sound speed during reionization.
To evaluate such a model we computed the bulk velocities of the dark matter and gas as a function of transverse distance from the filament axis.
To improve the accuracy of a velocity profile, we refined the determination of the position and orientation of the filament axes. Anticipating that the gas velocities would be minimal along the axis, a principal component analysis was done using just the gas particles having a tranverse velocity less than 444All velocities are computed relative to a coordinate system moving with the average velocity of the gas particles within 311 comoving kiloparsecs of the centre of the galaxy.. The orientation of the newly determined axes was close to that of the original ones, and considerably greater directionality was achieved.
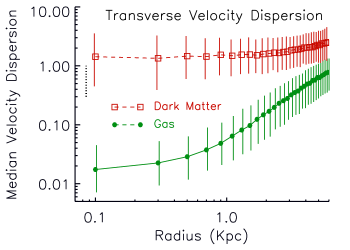
Figure 22 compares the velocity dispersion profiles of the dark matter and the gas of filaments from lingering-gas galaxies whose average sound speed squared is less than or equal to one in our usual units (see Figure 5). These are the filaments we have found to best match the predictions of the isothermal model we have put forward in this paper. Despite the uncertainties inherent in this computation, it is striking that the gas velocities are reduced near the axis as would be expected from hydrodynamic effects. The dark matter velocities, by contrast, are greater and are roughly constant out to nearly the assumed extent of the filament.
Eisenstein et al. (1997) have derived a relation between the transverse velocity dispersion and the mass per unit length, , of a collisionless cylinder at virial equilibrium.
| (5) |
where is the average of the square of the transverse velocity and is the gravitational constant (Eisenstein et al., 1997)555This differs from equation 13 of these authors by a factor of 2. Their equation refers to line-of-sight velocity.. The relation is similar to that for a gravitationally bound, isothermal gas cylinder (equation 1) with the bulk velocity substituted for the sound speed.
Our strategy, to better understand the role of the dark matter, is to examine the total virial budget, taking into account both the sound speed of the gas and the bulk velocities of the dark matter and gas. In an hypothesized virial equilibrium each source of kinetic energy must be balanced by a mass per unit length for the filament. For simplicity, we have taken the mass per unit length of the gravitationally bound, isothermal cylinder as that necessary to balance the sound speed of the gas. For the bulk velocities we have taken the mass per unit length for the collisionless counterpart described above (Equation 5).
Figure 23 shows that the actual mass per unit length is consistently too small for both gas and dark matter to be present together in a virial equilibrium. This figure is a histogram for filaments from lingering-gas galaxies having a sound speed squared less than or equal to one, using our usual units, These are the filaments we have found to match our isothermal cylinder model the best as shown in Figure 17. The bin on the abcissa is computed by taking the total mass per unit length of the filament and dividing it by the mass per unit length required to balance both the sound speed of the gas and the bulk velocities of the dark matter and gas.
These results make it hard to justify a model in which the gas is part of a dark matter structure at virial equilibrium. Taking the confines of the filament out to a larger radius may not solve the problem. The periphery typically has an overdensity of only a few compared to a central overdensity in the thousands. Furthermore, the otherwise mostly constant velocity of the dark matter increases at large radius.
We suggest that only the gas of these filaments is close to virial equilibrium. This supposition fits with the fact the lingering-gas galaxies are the ones that are the best match to a gravitationally bound, isothermal gas cylinder. In these galaxies the dark matter collapses into the forming galaxy more rapidly than does the gas. The moving dark matter provides an environment in which the gravitational constant appearing in the isothermal gas cylinder equations is effectively altered because of the potential energy of the dark matter.
4.9 Number and Alignment of Filaments
If the filaments in the simulation correspond to the rods of the model, we might expect to see for each galaxy two filaments protruding from the centre of the galaxy that are roughly aligned end-to-end.
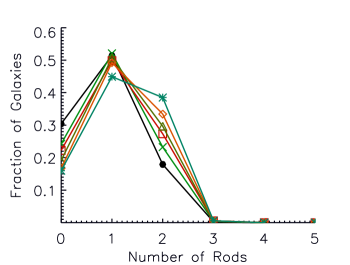
Figure 24 shows that the number of filaments identified for each galaxy is generally no more than two666The filaments used for the graphs in this section are taken from the collection of filaments before they are culled by the range test and the sphere of influence.. The six different curves are histograms of the number of filaments for a galaxy at the six redshifts studied. In keeping with the model, in the few cases where more than two were found, only the two most massive were retained for further analysis.
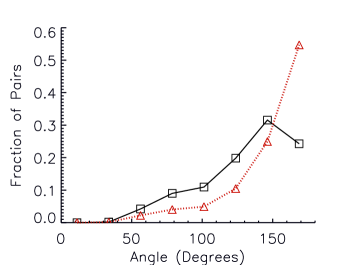
When two segments are present at the same time for a galaxy, the preferred angle between their directions is close to degrees, as if the segments were part of a single, straight rod passing through the centre of collapse. This finding dovetails nicely with the simple paradigm for successive collapse in three dimensions.
The black, solid line with squares in Figure 25 shows a histogram of the angles between the directions of pairs of segments. Results for the six redshifts have been pooled, since the individual results are very similar. The red, dotted line with triangles shows the same histogram with entries weighted by the reciprocal of the sine of the angle. This latter plot is suited to a situation in which the two filaments are assumed to come together in three dimensions rather than forming within a predetermined plane.
In this paper, for clarity, we have called each rod protruding from the centre of the galaxy a filament even though it is attractive theoretically to envision the collapse of a single filament passing through the centre of the galaxy.
5 Discussion
The theme of this paper is that the gas in the intergalactic filaments during the first gigayear can be best understood in terms of simple hydrodynamic principles. In contrast, the dark matter can be understood in terms of the spherically symmetric collapse of an overdensity in an expanding universe.
The filaments undergoing reionization fit the isothermal model best. These filaments tend to have dark matter spread roughly evenly over the entire length. Isothermal cylinders may also be present at later times, but be harder to demonstrate because large dark matter clumps may negate the assumption of uniform mixing.
It is important to emphasize that the filaments we see should be distinguished from the generally larger ones others study at lower redshifts, which often contain within them multiple galaxies. Most papers on the cosmic web have dealt with these massive, later structures.
Eisenstein et al. (1997) has described a method for determining the dynamical mass per unit length of a massive filament containing hundreds of galaxies such as might be observed in redshift surveys at low redshift. The method can be used to estimate the mass to light ratios of these filaments. The method is impressive and has theoretical antecedents in common with our model. However, the method is not easily applicable to the very small filaments associated with the galaxies of the first gigayear.
Danovich et al. (2012) have reported that galaxies tend to be at the centre of three filaments contrary to our findings. We also often see more than two filaments extending from a single point. However, we believe that these are likely to be the result of later collisions among filaments. Most of the largest galaxies can be traced back to an early stage when no more than two roughly end-to-end filaments are present.
To study the numbers and properties of filaments, it is necessary to identify them in an algorithmic fashion free of subjective bias. We find that visual inspection can be deceptive. A plane viewed edge on or the intersection of two planes can appear as a spurious filament. In addition, some of the filament segments are difficult to pick out from the background by eye.
We believe that our criteria for selection of filament candidates are good, and that it is not unreasonable to discard additional faint filaments that may be seen by eye.
It should also be appreciated that, at early times, the centre of a future galaxy connecting two end-to-end filaments may not be apparent upon casual inspection. Rather it may appear to the eye simply as a point on a single continuous filament. This situation could lead to an apparent preference for more than two filaments emanating from a single galaxy.
We argue that, during the reionization process, the gas assumes a structure that can be understood in terms of a gravitationally bound, isothermal cylinder at equilibrium at about . We find that this temperature, close to the Lyman alpha cooling floor, is tightly maintained during reionization. This temperature regulation may be important in the stability of the cylinders during this period.
The change in sound speed during reionization can be seen reflected in a change in the mass per unit length of the cylinder (Figure 5). We consider this finding together with the proportionality constant to be strong evidence for gravitationally bound, isothermal cylinders.
To further justify our emphasis on the importance of the gas component, we explored the virial consequences of a more conventional model in which the structure is primarily determined by the aggregation properties of dark matter. There appeared to be too little mass per unit length for such a model.
It is important to note that the simulation follows in detail the ionization of the gas by radiation from the actual sites of stellar formation. This is in contrast to many simulations that merely impose a uniform radiation field and thus might miss such structural nuances. For such simulations we would not expect dramatic changes in the physics of the gas in the filaments because there is very little stellar material in the filaments. However, the time course of reionization would probably be altered with the result that there would be fewer filaments with intermediate ionization stages. Demonstration of isothermal cylinders might then be more difficult.
We find remarkable uniformity in the behaviour of the dark matter of the largest galaxies in the simulation. These galaxies range in total mass, including dark matter, gas, and stars, over two orders of magnitude. The dark matter collapse follows closely the spherically symmetric cycloid model at least through turnaround. The overdensity at turnaround agrees roughly with theoretical expectation. The matter collapses initially into a rough plane and then into a one dimensional structure within the plane, resulting in up to two filaments protruding from the centre of the galaxy oriented end to end. At any time, approximately three quarters of the galaxies have at least one filament emerging from it.
An outstanding problem in cosmology is the discrepancy between the observed number of satellite galaxies of the Milky Way and the predicted number from simulations using dark matter only (Kauffmann et al., 1993). Our results suggest a mechanism that suppresses the entry of gas into dark matter haloes. This phenomenon would be in contrast to the expulsion of gas from haloes by heating and photoionization.
One might imagine that filaments would facilitate the entry of gas into the halo by restricting its angular momentum. However, our results argue that, on balance, the gas that can be accomodated into an isothermal cylinder is retarded in its motion.
A simulation with greater resolution would be desirable to confirm and expand upon these results. Higher resolution might reveal structures important in the formation of galaxies smaller than the ones studied here. It would be interesting to see if there is a minimum galaxy size that can form according to our filament model. Would very small galaxies form very early when the temperature is substantially lower than the Lyman alpha cooling floor?
A higher resolution would also help to establish whether the dark matter really is as clumpy compared to the gas as it appears. Sometimes increasing resolution can expose artifacts arising from the discreteness of the simulation elements. We would not expect a higher resolution to reveal the gas in the filaments as fragments rather than continuous. This is because, when discreteness is important, it is usually the lower resolution simulation that is fragmented rather than the higher one. For a discussion of discreteness effects see Power et al. (2016).
Reionization is regarded as a watershed event in the history of the universe. A galaxy that formed before reionization could retain an ancient population of stars that could not have formed afterward if the galaxy were too small. Brown et al. (2014) have argued from an analysis of individual stars that some ultra-faint dwarf satellites of the Milky Way are indeed such galaxies that have survived to the present day. The galaxies in our study all began their formation prior to reionization. We do not know their likely fate, but it is plausible that they could share common features with some small galaxies observed at redshift zero. It is thus not unreasonable to compare our galaxies with galaxy populations observed today that exhibit the “too big to fail” effect.
A comprehensive consideration of the “too big to fail” phenomenon is beyond the scope of this paper. We note, however, that our model differs from most of the other ones in focussing on the transport of gas into the galaxy, rather than on baryonic effects and star formation within the galaxy (see for example, Governato et al. (2012); Zolotov et al. (2012); Brooks et al. (2013); Vera-Ciro et al. (2013); Arraki et al. (2014); Brooks & Zolotov (2014); Madau et al. (2014); Jiang & van den Bosch (2015); Pawlowski et al. (2015); Agertz & Kravtsov (2016); Read et al. (2016); Wetzel et al. (2016); Zhu et al. (2016).
A detailed analysis of the motion of gas into galaxies is beyond the scope of this paper. Our model is consistent with the “cold mode” of galaxy accretion. We see no evidence for a hot gas stage in the formation of our galaxies. We have argued from rates of collapse of the dark matter and gas that the gas moves into the galaxy along a single, linear filament.
An important open question involves the timing and mechanism of the reionization of the universe. To evaluate the role of ionizing radiation from stars one must know the fraction of stellar radiation that escapes from its point of origin. It is clear that the gas surrounding the centre of collapse of a galaxy is not spherically symmetric. Our results may provide a more realistic starting point for such calculations.
Finally, our model suggests the central presence of gas at a very early time in the formation of the galaxy halo. Perhaps this gas contributes to the formation of a “cored” halo profile as opposed to the “cuspy” one suggested from simulations containing only dark matter (Gilmore et al., 2007; Evans et al., 2009; de Blok, 2010; Strigari et al., 2010; Amorisco & Evans, 2012; Martinez, 2015).
6 Summary
We propose a model for the development of intergalactic filaments during the first gigayear of the universe. In this model the mass per unit length and structure of the filament is determined, not by the potential well of the enclosing dark matter, but by the hydrodynamic properties of the gas.
The model is described in the context of galaxy formation. Up to two extended filaments may protrude from the centre of the collapsing galaxy. They tend to be oriented end-to-end as if they comprised a single structure. The total mass per unit length of a filament segment is proportional to the square of the sound speed of the gas with a proportionality constant equal to that predicted for a gravitationally bound, isothermal cylinder. The sound speed of a gas filament depends only upon its temperature and ionization state and not upon the density. These structures generally contain gas and dark matter in roughly the cosmic ratio. The dark matter contributes to the gravitational field in proportion to its abundance as if it were uniformly mixed with the gas.
The dark matter of each galaxy collapses according to the simplest model for a spherically symmetric overdensity in an expanding universe. This cycloid profile is followed until some time after turnaround. The overdensity of the material at turnaround agrees with theoretical predictions.
After reionization the average gas fraction of a filament segment may increase as the collapse of dark matter progresses.
Overall the dark matter collapses to roughly the same extent for each galaxy. However, the gas collapse varies. Three types of galaxies are distinguished. In the “plunging gas” galaxies, the gas collapses as fast or faster than the dark matter. These galaxies appear to collapse from overdensities having far too much matter to form a gravitationally bound, isothermal filament under the ambient thermal conditions. In the “retreating gas” galaxies, the gas fails to move toward the halo and may expand with the universe. These galaxies appear to collapse from overdensities having too little matter. Finally, in the “lingering gas” galaxies the gas collapses but more slowly than does the dark matter. These appear to have available masses in a suitable range to form gravitationally bound, isothermal cylinders. Presumably, the gas that can be accomodated in the isothermal structure is retarded in its motion, whereas excess gas can can proceed unhindered.
For the lingering gas galaxies the different overall rates of migration of the dark matter and gas predict the final baryon fraction of the galaxy under a simple assumption of uniform, filamentary accretion, but are inconsistent with spherical accretion.
The model works for a galaxy mass range that includes that of the so-called “too big to fail” galaxies and may explain the peculiar absence of these galaxies from observational surveys.
The model may provide a mathematical framework for understanding a variety of open questions about structure formation in the early universe. The sizes of the structures in this model suggest a minimum simulation resolution that may be necessary to recreate the effects seen here. In addition, the model may contribute to our intuition about the roles of dark matter and gas in structure formation.
Acknowledgments
We are grateful to Nickolay Y. Gnedin for providing us with the output of his simulation along with his visualization software IFRIT.
References
- Agertz & Kravtsov (2016) Agertz O., Kravtsov A. V., 2016, ApJ, 824, 79
- Amorisco & Evans (2012) Amorisco N. C., Evans N. W., 2012, MNRAS, 419, 184
- Arraki et al. (2014) Arraki K. S., Klypin A., More S., Trujillo-Gomez S., 2014, MNRAS, 438, 1466
- Bertschinger & Gelb (1991) Bertschinger E., Gelb J. M., 1991, Computers in Physics, 5, 164
- Binney (2004) Binney J., 2004, MNRAS, 347, 1093
- Birnboim & Dekel (2003) Birnboim Y., Dekel A., 2003, MNRAS, 345, 349
- Boylan-Kolchin et al. (2011) Boylan-Kolchin M., Bullock J. S., Kaplinghat M., 2011, MNRAS, 415, L40
- Boylan-Kolchin et al. (2012) Boylan-Kolchin M., Bullock J. S., Kaplinghat M., 2012, MNRAS, 422, 1203
- Boylan-Kolchin et al. (2009) Boylan-Kolchin M., Springel V., White S. D. M., Jenkins A., Lemson G., 2009, MNRAS, 398, 1150
- Brooks et al. (2009) Brooks A. M., Governato F., Quinn T., Brook C. B., Wadsley J., 2009, ApJ, 694, 396
- Brooks et al. (2013) Brooks A. M., Kuhlen M., Zolotov A., Hooper D., 2013, ApJ, 765, 22
- Brooks & Zolotov (2014) Brooks A. M., Zolotov A., 2014, ApJ, 786, 87
- Brown et al. (2014) Brown T. M., Tumlinson J., Geha M., Simon J. D., Vargas L. C., VandenBerg D. A., Kirby E. N., Kalirai J. S., Avila R. J., Gennaro M., Ferguson H. C., Muñoz R. R., Guhathakurta P., Renzini A., 2014, ApJ, 796, 91
- Cen & Ostriker (1993) Cen R., Ostriker J. P., 1993, ApJ, 417, 415
- Conselice (2014) Conselice C. J., 2014, ARA&A, 52, 291
- Danovich et al. (2012) Danovich M., Dekel A., Hahn O., Teyssier R., 2012, MNRAS, 422, 1732
- de Blok (2010) de Blok W. J. G., 2010, Advances in Astronomy, 2010, 789293
- Dekel & Birnboim (2006) Dekel A., Birnboim Y., 2006, MNRAS, 368, 2
- Dekel et al. (2009) Dekel A., Birnboim Y., Engel G., Freundlich J., Goerdt T., Mumcuoglu M., Neistein E., Pichon C., Teyssier R., Zinger E., 2009, Nature, 457, 451
- Eisenstein et al. (1997) Eisenstein D. J., Loeb A., Turner E. L., 1997, ApJ, 475, 421
- Evans et al. (2009) Evans N. W., An J., Walker M. G., 2009, MNRAS, 393, L50
- Ferrero et al. (2012) Ferrero I., Abadi M. G., Navarro J. F., Sales L. V., Gurovich S., 2012, MNRAS, 425, 2817
- Frenk & White (2012) Frenk C. S., White S. D. M., 2012, Annalen der Physik, 524, 507
- Frieman et al. (2008) Frieman J. A., Turner M. S., Huterer D., 2008, ARA&A, 46, 385
- Garrison-Kimmel et al. (2014) Garrison-Kimmel S., Boylan-Kolchin M., Bullock J. S., Kirby E. N., 2014, MNRAS, 444, 222
- Gilmore et al. (2007) Gilmore G., Wilkinson M. I., Wyse R. F. G., Kleyna J. T., Koch A., Evans N. W., Grebel E. K., 2007, ApJ, 663, 948
- Gnedin (1995) Gnedin N. Y., 1995, ApJS, 97, 231
- Gnedin & Bertschinger (1996) Gnedin N. Y., Bertschinger E., 1996, ApJ, 470, 115
- Governato et al. (2012) Governato F., Zolotov A., Pontzen A., Christensen C., Oh S. H., Brooks A. M., Quinn T., Shen S., Wadsley J., 2012, MNRAS, 422, 1231
- Harford & Hamilton (2011) Harford A. G., Hamilton A. J. S., 2011, MNRAS, 416, 2678
- Harford et al. (2008) Harford A. G., Hamilton A. J. S., Gnedin N. Y., 2008, MNRAS, 389, 880
- Jiang & van den Bosch (2015) Jiang F., van den Bosch F. C., 2015, MNRAS, 453, 3575
- Katz et al. (2003) Katz N., Keres D., Dave R., Weinberg D. H., 2003, in J. L. Rosenberg & M. E. Putman ed., The IGM/Galaxy Connection. The Distribution of Baryons at z=0 Vol. 281 of Astrophysics and Space Science Library, How Do Galaxies Get Their Gas. pp 185–191
- Kauffmann et al. (1993) Kauffmann G., White S. D. M., Guiderdoni B., 1993, MNRAS, 264, 201
- Kereš et al. (2009) Kereš D., Katz N., Fardal M., Davé R., Weinberg D. H., 2009, MNRAS, 395, 160
- Kereš et al. (2005) Kereš D., Katz N., Weinberg D. H., Davé R., 2005, MNRAS, 363, 2
- Klypin et al. (2015) Klypin A., Karachentsev I., Makarov D., Nasonova O., 2015, MNRAS, 454, 1798
- Klypin et al. (1999) Klypin A., Kravtsov A. V., Valenzuela O., Prada F., 1999, ApJ, 522, 82
- Kravtsov & Borgani (2012) Kravtsov A. V., Borgani S., 2012, ARA&A, 50, 353
- Madau et al. (2014) Madau P., Weisz D. R., Conroy C., 2014, ApJL, 790, L17
- Martinez (2015) Martinez G. D., 2015, MNRAS, 451, 2524
- Moore et al. (1999) Moore B., Ghigna S., Governato F., Lake G., Quinn T., Stadel J., Tozzi P., 1999, ApJL, 524, L19
- Ocvirk et al. (2008) Ocvirk P., Pichon C., Teyssier R., 2008, MNRAS, 390, 1326
- Ostriker (1964) Ostriker J., 1964, ApJ, 140, 1056
- Papastergis et al. (2015) Papastergis E., Giovanelli R., Haynes M. P., Shankar F., 2015, A&A, 574, A113
- Papastergis & Shankar (2016) Papastergis E., Shankar F., 2016, A&A, 591, A58
- Park (1990) Park C., 1990, MNRAS, 242, 59P
- Pawlowski et al. (2015) Pawlowski M. S., Famaey B., Merritt D., Kroupa P., 2015, ApJ, 815, 19
- Peacock (1999) Peacock J. A., 1999, Cosmological Physics. Cambridge University Press
- Power et al. (2016) Power C., Robotham A. S. G., Obreschkow D., Hobbs A., Lewis G. F., 2016, MNRAS, 462, 474
- Read et al. (2016) Read J. I., Agertz O., Collins M. L. M., 2016, MNRAS, 459, 2573
- Rees & Ostriker (1977) Rees M. J., Ostriker J. P., 1977, MNRAS, 179, 541
- Somerville & Davé (2015) Somerville R. S., Davé R., 2015, ARA&A, 53, 51
- Stodólkiewicz (1963) Stodólkiewicz J. S., 1963, Acta Astronomica, 13, 30
- Strigari et al. (2010) Strigari L. E., Frenk C. S., White S. D. M., 2010, MNRAS, 408, 2364
- Sugerman et al. (2000) Sugerman B., Summers F. J., Kamionkowski M., 2000, MNRAS, 311, 762
- Tollerud et al. (2014) Tollerud E. J., Boylan-Kolchin M., Bullock J. S., 2014, MNRAS, 440, 3511
- Vera-Ciro et al. (2013) Vera-Ciro C. A., Helmi A., Starkenburg E., Breddels M. A., 2013, MNRAS, 428, 1696
- Wetzel et al. (2016) Wetzel A. R., Hopkins P. F., Kim J.-h., Faucher-Giguère C.-A., Kereš D., Quataert E., 2016, ApJL, 827, L23
- White & Rees (1978) White S. D. M., Rees M. J., 1978, MNRAS, 183, 341
- Zel’dovich (1970) Zel’dovich Y. B., 1970, A&A, 5, 84
- Zhu et al. (2016) Zhu Q., Marinacci F., Maji M., Li Y., Springel V., Hernquist L., 2016, MNRAS, 458, 1559
- Zolotov et al. (2012) Zolotov A., Brooks A. M., Willman B., Governato F., Pontzen A., Christensen C., Dekel A., Quinn T., Shen S., Wadsley J., 2012, ApJ, 761, 71
Appendix A Algorithm For Filament Identification
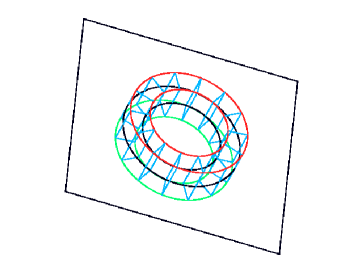
Each filament is selected in the context of a forming galaxy. Figure 26 shows the geometry for this selection for an example galaxy. The selection takes place in a comoving coordinate system whose centre is the centre of mass of the collapsing dark matter particles of the galaxy. Unlike the gas particles, the individual dark matter particles of a galaxy can be followed throughout the simulation. The XY plane is set to the plane of the gas as determined by a principal component analysis of the gas particles within a sphere of radius kpc. The large black rectangle in the Figure 26 shows this XY plane. Annuli above (red) and below (green) the plane determine a volume that is divided into equal bins by the light blue rectangles. The intersection of the bins with the plane are shown by the black annulus. The annulus is defined by two radii of 88.8 and 133.2 kpc.
A bin having more than twice the average amount of gas per bin is considered to contain a filament. In cases where neighboring bins of the annulus both meet this criterion, the gas in both bins is merged and analyzed together. The filament identification process is completely defined by this algorithm. There are no subjective elements.
The algorithm identifies visually clear segments that are usually part of longer filaments extending radially from the centre of collapse of the galaxy. Also identified, and therefore included in our analysis, are structures that may not be readily identified or interpreted by eye.
These filament segments are used in Section 4.9 to compare the relative orientations of the filaments with the prediction of the model. However, for the analyses in the remaining sections, the set of segments is further culled using a “range test”. In this test, the filament segment is divided into three parts. To pass the test, the mass of gas in each part can differ from the average of the three parts by no more than 20%. This test ensures that the identified structure grossly resembles a filament. This is important because we do not allow any subjective inspection of a segment to influence whether it is included.
In addition, we require that the sphere of influence of the galaxy cover at least half of the filament segment in question. This is done to ensure that nearby galaxies do not result in the selection of the same filament. The sphere of influence is considered to be a sphere with radius equal to the turnaround radius in comoving coordinates centred at the centre of the galaxy at the time in question.
A total of filament segments selected from the six redshifts considered survived all tests.
For structural analysis the orientation of each segment is determined more precisely using a principal component analysis.