Fast, low-ionization emission regions of the planetary nebula M2-42
Abstract
Spatially resolved observations of the planetary nebula M2-42 (PN G008.204.8) obtained with the Wide Field Spectrograph on the Australian National University 2.3 m telescope have revealed the remarkable features of bipolar collimated jets emerging from its main structure. Velocity-resolved channel maps derived from the [N ii] 6584 emission line disentangle different morphological components of the nebula. This information is used to develop a three-dimensional morpho-kinematic model, which consists of an equatorial dense torus and a pair of asymmetric bipolar outflows. The expansion velocity of about 20 km s-1 is measured from the spectrum integrated over the main shell. However, the deprojected velocities of the jets are found to be in the range of –160 km s-1 with respect to the nebular center. It is found that the mean density of the collimated outflows, cm-3, is five times lower than that of the main shell, cm-3, whereas their singly ionized nitrogen and sulfur abundances are about three times higher than those determined from the dense shell. The results indicate that the features of the collimated jets are typical of fast, low-ionization emission regions.
Subject headings:
ISM: jets and outflows – planetary nebulae: individual (M2-42) – stars: evolution1. Introduction
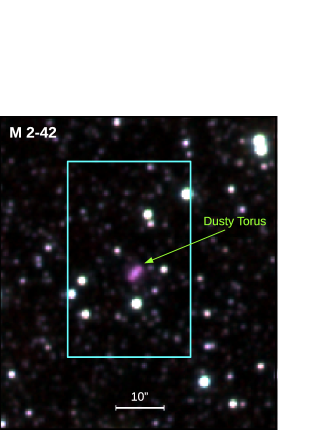
M2-42 ( = PN G008.204.8 = Hen 2-393 = VV 177 = Sa 2-331) was discovered as a planetary nebula (PN) by Minkowski (1947). The H image, Fig. 1 (top panel), obtained from the AAO/UKST SuperCOSMOS H Sky Survey (SHS; Parker et al., 2005) revealed an elliptical morphological structure with a clear extension to the north east, suggesting the presence of bipolar outflows. The long-slit data from the San Pedro Mártir kinematic catalog (SPM; López et al., 2012) disclosed the presence of a dense torus-like component and collimated bipolar outflows (Akras & López, 2012). The JHKs image, Fig. 1 (bottom panel), obtained from the VISTA variables in the Vía Láctea Survey (VVV; Saito et al., 2012) also shows the presence of a compact dusty torus embedded in the main shell.
Wang & Liu (2007) carried out plasma diagnostics and abundance analysis of M2-42 using deep long-slit optical spectroscopy. They derived a mean electron density of cm-3, and an electron temperature of = 9 350 K from the [N ii] line ratio, which is consistent with those of other PNe (see e.g. Kingsburgh & Barlow, 1994). The oxygen abundance of O/H = derived by Wang & Liu (2007) is slightly above the solar metallicity, while N/O = 0.32 corresponds to a non-Type I PN (based on N/O ; Kingsburgh & Barlow, 1994).
The central star of M2-42 depicts weak emission-line star characteristics (wels defined by Tylenda et al., 1993) dominated by nitrogen and helium (DePew et al., 2011). The nebular spectrum of moderate excitation, (5007 on a scale where (H (Wang & Liu, 2007), is related to an excitation class of 3.6 (Dopita & Meatheringham, 1990), and a stellar temperature of 74 kK (Dopita & Meatheringham, 1991) or 69 kK (Reid & Parker, 2010). Based on the Energy-Balance method, Preite-Martinez et al. (1989) estimated a stellar temperature of 74.9 kK. According to Tylenda et al. (1991a), the central star has a B magnitude of 18.2. Using the H i Zanstra method, Tylenda et al. (1991b) derived a stellar temperature of 56 kK and a luminosity of L, which correspond to a current core mass of 0.62M⨀.
Based on its angular diameter and radio brightness (6 cm), Acker et al. (1991) suggested that M2-42 is most likely located in the Galactic bulge. Cahn et al. (1992) estimated a distance of 8754 pc to the PN, which places it near to the Galactic center. The most recent distance estimation by Stanghellini et al. (2008) yielded a distance of 9444 pc. Moreover, we estimate a distance of 7400 from the H surface brightness-radius relation for a sample of 332 PNe (Frew et al., 2016), total flux value of H erg cm-2 s-1 (Frew et al., 2013), (H) (Wang & Liu, 2007), and angular radius of 2 arcsec (Stanghellini et al., 2008). Therefore, it could be a Galactic Bulge PN (GBPN).
In this paper, we present our integral field spectroscopy of M2-42, from which we determine ionization and kinematic properties of the nebula and its collimated outflows. In Section 2, we present the observations together with the physical and chemical conditions, stellar characteristics, and kinematic results derived from our data. Section 3 describes the morpho-kinematic model of M2-42 and, finally, in Section 4 we draw our conclusion.

2. Observations
Moderate resolution, integral field observations were obtained on 2010 April 22 under program number 1100147 (PI: Q. A. Parker) with the Wide Field Spectrograph (WiFeS; Dopita et al., 2007, 2010) mounted on the Australian National University (ANU) 2.3 m telescope at Siding Spring Observatory. CCD chips with pixels are used as detectors. The spectrograph samples along each of twenty five slitlets, which provides a field of view of and a spatial resolution element of . Each slitlet is designed to project to 2 pixels on the CCD chips, yielding a reconstructed point-spread function with a full width at half maximum (FWHM) of .
Figure 1 shows the WiFeS areal footprint used for our study. The main shell, the northeast (NE) jet and the southwest (SW) jet are also labeled on the figure. We used the spectral resolution of , covering 4415–5589 Å in the blue channel and 5222–7070 Å in the red channel. The red spectrum has a linear wavelength dispersion per pixel of Å, which yields a resolution of km s-1 in velocity channels. The exposure time of 20 minutes used for our observation yields a signal-to-noise ratio of S/N for the [N ii] emission line. Data reduction was performed with the wifes iraf package (described by Danehkar et al., 2013, 2014).
| (Å) | ID | Mult | Main Shell | NE Jet | SW Jet | |||
|---|---|---|---|---|---|---|---|---|
| 4471.50 | He i | V14 | 4.56 | 5.67 | 4.07 | 4.97 | 3.75 | 4.58 |
| 4609.44 | O ii | V92a | 0.03 | 0.04 | – | – | – | – |
| 4634.14 | N iii | V2 | 0.13 | 0.15 | – | – | – | – |
| 4649.13 | O ii | V1 | 0.35 | 0.39 | – | – | – | – |
| 4676.23 | O ii | V1 | 0.09 | 0.10 | – | – | – | – |
| 4685.68 | He ii | 3.4 | 0.30 | 0.34 | 0.34 | 0.37 | – | – |
| 4740.17 | [Ar iv] | F1 | 0.51 | 0.54 | – | – | – | – |
| 4861.33 | H i 4-2 | H4 | 100.00 | 100.00 | 100.00 | 100.00 | 100.00 | 100.00 |
| 4881.11 | [Fe iii] | F2 | 0.05 | 0.05 | – | – | – | – |
| 4921.93 | He i | V48 | 1.45 | 1.41 | – | – | 1.68 | 1.63 |
| 4958.91 | [O iii] | F1 | 226.94 | 214.89 | 172.83 | 164.37 | 193.45 | 184.01 |
| 5006.84 | [O iii] | F1 | 728.99 | 672.08 | 529.92 | 491.74 | 589.62 | 547.27 |
| 5666.63 | N ii | V3 | 0.07 | 0.04 | – | – | – | – |
| 5679.56 | N ii | V3 | 0.11 | 0.07 | – | – | – | – |
| 5754.60 | [N ii] | F3 | 1.03 | 0.66 | 2.21 | 1.47 | 1.35 | 0.90 |
| 5875.66 | He i | V11 | 24.78 | 15.20 | 23.82 | 15.20 | 25.96 | 16.58 |
| 6101.83 | [K iv] | F1 | 0.05 | 0.03 | – | – | – | – |
| 6312.10 | [S iii] | F3 | 2.24 | 1.18 | – | – | – | – |
| 6461.95 | C ii | V17.04 | 0.12 | 0.06 | – | – | – | – |
| 6548.10 | [N ii] | F1 | 26.55 | 12.87 | 82.73 | 42.49 | 56.74 | 29.21 |
| 6562.77 | H i 3-2 | H3 | – | 286.00 | 564.29 | 288.58 | 564.65 | 289.38 |
| 6583.50 | [N ii] | F1 | 81.59 | 39.10 | 258.01 | 131.14 | 174.03 | 88.64 |
| 6678.16 | He i | V46 | 8.60 | 4.00 | 8.59 | 4.25 | 8.81 | 4.36 |
| 6716.44 | [S ii] | F2 | 8.16 | 3.75 | 39.09 | 19.11 | 28.82 | 14.12 |
| 6730.82 | [S ii] | F2 | 12.97 | 5.93 | 36.51 | 17.78 | 30.02 | 14.65 |
| (H) | 0.989 | 0.910 | 0.907 | |||||
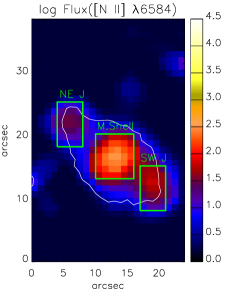
Table 1 presents a full list of observed line fluxes measured from three different apertures shown in Fig. 2: the main shell (), the NE jet () and the SW jet (). The laboratory wavelength, emission line identification and multiplet number are given in columns 1–3, respectively. Columns 4–9 present the observed line fluxes and the dereddened fluxes after correction for interstellar extinction for the three different regions, respectively. All fluxes are given relative to H, on a scale where . To extract the observed line fluxes, we applied a single Gaussian profile to each line. The logarithmic extinction was calculated from the Balmer flux ratio H/H. However, we adopted the extinction (H) derived by Wang & Liu (2007) for the main shell since the H emission line was saturated over the main shell area.
2.1. Physical and chemical conditions
Electron temperature and electron density for the different regions of M2-42 are presented in Table 2. The electron temperatures and densities were obtained using the equib code (Howarth & Adams, 1981) from the [N ii] nebular to auroral line ratio and the [S ii] doublet line ratio, respectively. The electron temperature ([N ii])corr was corrected for recombination contribution to the auroral line using the formula given by Liu et al. (2000) and the ionic abundance derived from the N ii lines. The values of [S ii] cm-3 and [N ii] K are in agreement with [S ii] cm-3 and [N ii] K derived by Wang & Liu (2007). Additionally, we determined the physical conditions of the NE and SW jets. The jets show a mean electron temperature of K, which is 760 K lower than that of the main shell, whereas their mean electron density of cm-3 is by a factor of five lower than that of the main shell.
Table 2 also lists the ionic abundances Xi+/H+ derived from collisionally excited lines (CELs) and optical recombination lines (ORLs). We used the equib code to calculate the ionic abundances. We adopted the physical conditions, ( corr for the main shell) and , derived from CELs. The atomic data sets used for plasma diagnostics and abundances analysis are the same as those used by Danehkar (2014, Chapter 3).
Our value of He+/H for the main shell is in good agreement with He+/H+ = 0.107 derived by Wang & Liu (2007). However, they derived O++/H+ = , which is twice our value. This could be due to the different atomic data used by them. Our values of N+/H+, S+/H+ and Ar3+/H+ are in reasonable agreement with N+/H+ = , S+/H+ = and Ar3+/H+ = obtained by Wang & Liu (2007). Note that a slit with a width of used by Wang & Liu (2007) is not completely related to the main shell. We see that the abundance discrepancy factor for O++, , is in agreement with (Wang & Liu, 2007). Moreover, our abundance ratio of (N++/O derived from ORLs is in excellent agreement with (N++/O obtained by Wang & Liu (2007). Although He+/H+ and O++/H+ derived from the jets are similar to those of the main shell, N+/H+ and S+/H+ derived from the jets are about three times higher than those of the main shell. These ionization features of the bipolar collimated jets are typical of fast, low-ionization emission regions (FLIERs; Balick et al., 1993, 1994, 1998).
| Parameter | Main Shell | NE Jet | SW Jet |
|---|---|---|---|
| ([N ii])(K) | 10270 | 9020 | 8660 |
| ([N ii])corr(K) | 9600 | – | – |
| ([S ii])(cm-3) | 3150 | 470 | 720 |
| (He+/H+)ORL | 0.105 | 0.107 | 0.110 |
| (N+/H+) | 0.764 | 2.912 | 2.236 |
| (O++/H+) | 2.606 | 2.469 | 3.208 |
| (S+/H+) | 0.347 | 1.150 | 1.040 |
| (S++/H+) | 3.116 | – | – |
| (Ar3+/H+) | 1.871 | – | – |
| (N++/H+) | 3.175 | – | – |
| (O++/H+) | 8.185 | – | – |
2.2. Comments on stellar characteristics
The stellar emission-line fluxes presented in Table 3, are measured from a spectrum integrated over an aperture () covering the central star in the WiFeS field. The emission line identification, wavelength, dereddened flux corrected for reddening using (H), equivalent width (Å), and FWHM (Å) are given in columns 1–5, respectively. All fluxes are given relative to C iv 5805, on a scale where C iv 5805 = 100. We note that the width of C iv 5805 is narrower than typical Wolf–Rayet central starts of PNe with the same stellar temperature (see e.g., Crowther et al., 1998; Acker & Neiner, 2003), so it could be a wels as identified by DePew et al. (2011). Following the method used by Acker & Neiner (2003), a terminal wind velocity of 640 km s-1 is deduced from FWHMC iv 5805 Å. However, we get a terminal velocity of 1560 km s-1 from FWHMC iv 5805 Å reported by DePew et al. (2011). Although the C iii 5696 line is not detected, the C iii/iv 4650 is possibly identified. The He ii 4686 line is fairly strong, but it could have a nebular origin. We see the presence of strong N iii 4634,4641 lines and weak N v 4603,4932 lines. Assuming that the He ii 4686 line is a stellar emission line, M2-42 could have a stellar characteristics similar to WN8-type stars of van der Hucht (2001) based on N iii 4641He ii 4686) and N iiiN v. However, N ii 3995 and N iv 3479–3484, 4058 lines are not in the wavelength coverage of our WiFeS observations, so we cannot certainly classify it as one of nitrogen sequences of Wolf–Rayet central stars of PNe.
| Line | (Å) | (Å) | FWHM(Å) | |
|---|---|---|---|---|
| N v | 4603 | : | ||
| N iii | 4634 | |||
| N iii | 4641 | |||
| C iii/iv | 4650 | |||
| C iii | 4655 | |||
| C iv | 4659 | |||
| He ii | 4686 | |||
| N v | 4932 | : | ||
| C iv | 5805 | |||
| C ii | 6462 | |||
| C iii | 7037 | : |
2.3. Kinematic results
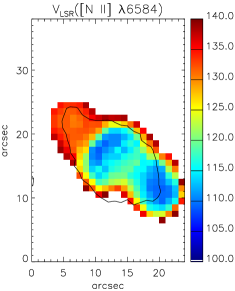
We derived an expansion velocity of km s-1 from the half width at half maximum (HWHM) for the [N ii] 6548,6584 and [S ii] 6716,6731 emission-line profiles integrated over the main shell (). The local standard of rest (LSR) systemic velocity of the whole nebula was estimated to be at km s-1, which is in agreement with km s-1 measured by Durand et al. (1998). The LSR velocity is defined as the line of sight radial velocity, transferred to the local standard of rest by correcting for the motions of the Earth and Sun.
Figure 2 shows spatially resolved flux and velocity maps of M2-42 extracted from the [N ii] 6584 emission line across the WiFeS field. The observed radial velocity map was transferred to the LSR radial velocity. The white/black contour lines in the figures depict the 2D distribution of the H emission obtained from the SHS, which can aid us in distinguishing the nebular border. As seen in Fig. 2, the kinematic map depicts an elliptical structure with a pair of collimated bipolar outflows, which is easily noticeable in the channel maps (see Fig. 3) and discussed below.
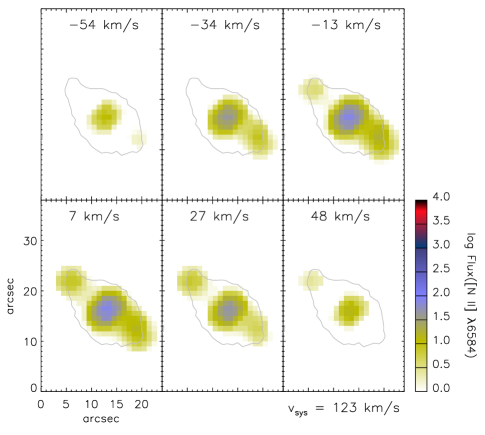
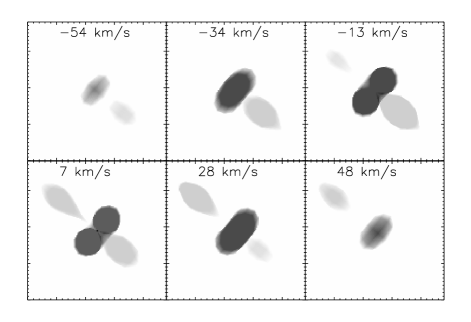
Figure 3 presents the flux intensity maps of the [N ii] 6584 emission lines on a logarithmic scale observed in a sequence of 6 velocity channels with a resolution of km s-1, which can be used to identify different morphological components of the nebula. We subtracted the systemic velocity km s-1 from the central velocity value given at the top of each channel. The stellar continuum map was also subtracted from the flux intensity maps. While there is a dense torus in the center, a pair of collimated bipolar outflows can be also identified in the velocity channels. The torus has a radius of . This torus is clearly evident in the VVV J, H, and Ks color combined image of M2-42 presented in Figure. 1 (bottom panel). We notice that the bipolar outflows are highly asymmetric, the SW jet apparently having a bow shock structure. While the NE jet reaches a distance of from the nebular center, the distance of the SW jet from the central star is about 25% shorter than the NE jet. Interaction with the interstellar medium (ISM) can lead to the formation of asymmetric bipolar outflows (see e.g. Wareing et al., 2007). Both the jet components have similar brightness in the velocity channels. Brightness discontinuities are seen in the channels, where the bipolar outflows emerge from the main shell.
3. Morpho-kinematic model
We have used the morpho-kinematic modeling program shape (version 5.0) described in detail by Steffen & López (2006) and Steffen et al. (2011). This program has been used for modeling many PNe, such as NGC 2392 (García-Díaz et al., 2012), NGC 3242 (Gómez-Muñoz et al., 2015), Hen 2-113 and Hen 3-1333 (Danehkar & Parker, 2015). It uses interactively molded geometrical polygon meshes to generate three-dimensional structures of gaseous nebulae. The program produces several outputs that can be directly compared with observations, namely position-velocity diagrams, velocity channels and synthetic images. The modeling procedure consists of defining the geometry, assigning a density distribution and defining a velocity law. Geometrical and kinematic parameters are modified in a manual interactive process until a satisfactorily fitting model has been constructed.
Figure 4 (a) shows the morpho-kinematic model before rendering at two different orientations (inclination: 0∘ and 90∘), and their best-fitting inclination, together with the result of the rendered model. The morpho-kinematic model consists of an equatorial dense torus (main shell) and a pair of asymmetric bipolar outflows. The values of the parameters of the final model are summarized in Table 4. For the velocity field, we assume a Hubble-type flow (Steffen et al., 2009).
The velocity-channel maps of the final model are shown in Figure 4 (b), where they can be directly compared with the observed velocity-resolved channel maps presented in Figure 3. The model maps are a good match to the observational maps. The model successfully produces two kinematic components of the jets moving in opposite directions on both sides of the torus. From the morpho-kinematic model, we derived an inclination of with respect to the line of sight. Taking the inclination derived by the best-fitting model, we estimated a “jet” expansion velocity of km s-1 with respect to the central star.
(a) shape model
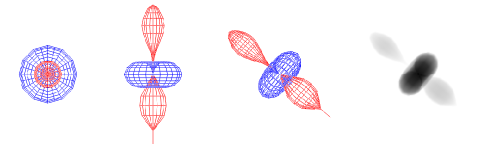
(b) Velocity channels
| Parameter | Value |
|---|---|
| Inclination of major axis, | |
| Position angle of major axis, PA | |
| Galactic position angle of major axis, GPA | |
| Outer radius of the main shell | arcsec |
| NE Jet distance from the center | arcsec |
| SW Jet distance from the center | arcsec |
| Jet velocity from the center | km s-1 |
As seen in Table 4, the symmetric axis of the bipolar outflows has a position angle (PA) of measured from the north toward the east in the equatorial coordinate system (ECS). This leads to a Galactic position angle (GPA) of . The GPA is the position angle of the nebular symmetric axis projected on to the sky plane, measured from the North Galactic Pole toward the Galactic east. Note that describes an alignment with the Galactic plane, whereas is perpendicular to the Galactic plane. Therefore, the symmetric axis of M2-42 is roughly aligned with the Galactic plane. This alignment could have some implications for other studies of GBPNe (see e.g. Rees & Zijlstra, 2013; Falceta-Gonçalves & Monteiro, 2014; Danehkar & Parker, 2016).
4. Summary and discussions
In this paper, we present the spatially resolved observations of M2-42 obtained with the WiFeS on the ANU 2.3 m telescope. Using the velocity-resolved channel maps derived from the [N ii] 6584 emission line, a morpho-kinematic model has been developed which includes different morphological components of the nebula: a dense torus and a pair of asymmetric bipolar outflows in opposite directions. From the HWHM method, the torus is found to expand slowly at km s-1, almost in agreement with km s-1 derived by Akras & López (2012). From the reconstruction model, the trail of bipolar outflows was found to go along the direction of (GPA, ) (, ), which is very similar to the inclination of derived by Akras & López (2012) based on the SPM long-slit data. We find a “jet” expansion velocity of km s-1 with respect to the nebular center, which is higher than the value of km s-1 estimated by Akras & López (2012). Moreover, we found that the SW jet, which moves toward us, has possibly a bow shock structure relating to the interaction with ISM (see e.g. Wareing et al., 2007).
An empirical analysis of the nebular spectra separately integrated over the three different regions shows that the mean density of the jets is a factor of five lower than that in the main shell. Although the abundances of singly ionized helium and doubly ionized oxygen are almost the same in both the shell and the jets, the singly ionized nitrogen and sulfur abundances derived from the jets are about three times higher than those obtained from the main shell. The similar ionization characteristics have been found in collimated jets emerged from other PNe (see e.g. Balick et al., 1993, 1994).
Nearly 10% of Galactic PNe have been found to have the small-scale low-ionization structures in opposite directions on both sides of their central stars. Around half of them are fast, highly collimated outflows with velocities of 30–200 km s-1 relative to the main bodies, so called FLIERs (Balick et al., 1993, 1994, 1998). Previously, Balick et al. (1994) claimed the presence of nitrogen enrichment by factors of 2–5 in the FLIERs of some PNe. However, Gonçalves et al. (2003) suggested that empirically derived nitrogen overabundance seen in FLIERs are a result of inaccurate ionization correction factors applied in the empirical analysis. Gonçalves et al. (2006) constructed a chemically homogeneous photoionization model of NGC 7009, which can reproduce the ionization characteristics of its shell and FLIERs. Similarly, the enhancement of N+/H+ and S+/H+ in the FLIERs of M2-42 could be attributed to the geometry and density distribution rather than chemical inhomogeneities.
The previous observations of M2-42 showed that its central star is of wels type (DePew et al., 2011). Moreover, we found that its stellar spectrum might be similar to the WN8 subclass of van der Hucht (2001) based on N iiiHe ii). The terminal wind velocity was also estimated to be about 640 km s-1. However, our observations did not cover the N ii and N iv lines, which are necessary for the WN classification. This typical stellar characteristics and its point-symmetric morphology could be a result of a common-envelope evolutionary phase (see e.g. Nordhaus & Blackman, 2006). Currently, there is no evidence for binarity in M2-42. We believe that further observations of its central star will help develop a better stellar classification and also shed light on the mechanism producing its FLIERs.
References
- Acker & Neiner (2003) Acker, A. & Neiner, C. 2003, A&A, 403, 659
- Acker et al. (1991) Acker, A., Raytchev, B., Koeppen, J., & Stenholm, B. 1991, A&AS, 89, 237
- Akras & López (2012) Akras, S. & López, J. A. 2012, MNRAS, 425, 2197
- Balick et al. (1998) Balick, B., Alexander, J., Hajian, A. R., Terzian, Y., Perinotto, M., & Patriarchi, P. 1998, AJ, 116, 360
- Balick et al. (1994) Balick, B., Perinotto, M., Maccioni, A., Terzian, Y., & Hajian, A. 1994, ApJ, 424, 800
- Balick et al. (1993) Balick, B., Rugers, M., Terzian, Y., & Chengalur, J. N. 1993, ApJ, 411, 778
- Cahn et al. (1992) Cahn, J. H., Kaler, J. B., & Stanghellini, L. 1992, A&AS, 94, 399
- Crowther et al. (1998) Crowther, P. A., De Marco, O., & Barlow, M. J. 1998, MNRAS, 296, 367
- Danehkar (2014) Danehkar, A. 2014, PhD thesis, Macquarie University
- Danehkar & Parker (2015) Danehkar, A. & Parker, Q. A. 2015, MNRAS, 449, L56
- Danehkar & Parker (2016) Danehkar, A. & Parker, Q. A. 2016, in IAU Symp. 312, Star Clusters and Black Holes in Galaxies Across Cosmic Time, ed. Spurzem, R. and Liu, F. and Li, S. and Meiron, Y., arXiv:1412.0012
- Danehkar et al. (2013) Danehkar, A., Parker, Q. A., & Ercolano, B. 2013, MNRAS, 434, 1513
- Danehkar et al. (2014) Danehkar, A., Todt, H., Ercolano, B., & Kniazev, A. Y. 2014, MNRAS, 439, 3605
- DePew et al. (2011) DePew, K., Parker, Q. A., Miszalski, B., De Marco, O., Frew, D. J., Acker, A., Kovacevic, A. V., & Sharp, R. G. 2011, MNRAS, 414, 2812
- Dopita et al. (2007) Dopita, M., Hart, J., McGregor, P., Oates, P., Bloxham, G., & Jones, D. 2007, Ap&SS, 310, 255
- Dopita et al. (2010) Dopita, M., Rhee, J., Farage, C., McGregor, P., Bloxham, G., Green, A., Roberts, B., Neilson, J., Wilson, G., Young, P., Firth, P., Busarello, G., & Merluzzi, P. 2010, Ap&SS, 327, 245
- Dopita & Meatheringham (1990) Dopita, M. A. & Meatheringham, S. J. 1990, ApJ, 357, 140
- Dopita & Meatheringham (1991) —. 1991, ApJ, 377, 480
- Durand et al. (1998) Durand, S., Acker, A., & Zijlstra, A. 1998, A&AS, 132, 13
- Falceta-Gonçalves & Monteiro (2014) Falceta-Gonçalves, D. & Monteiro, H. 2014, MNRAS, 438, 2853
- Frew et al. (2013) Frew, D. J., Bojičić, I. S., & Parker, Q. A. 2013, MNRAS, 431, 2
- Frew et al. (2016) Frew, D. J., Parker, Q. A., & Bojičić, I. S. 2016, MNRAS, 455, 1459
- García-Díaz et al. (2012) García-Díaz, M. T., López, J. A., Steffen, W., & Richer, M. G. 2012, ApJ, 761, 172
- Gómez-Muñoz et al. (2015) Gómez-Muñoz, M. A., Blanco Cárdenas, M. W., Vázquez, R., Zavala, S., Guillén, P. F., & Ayala, S. 2015, MNRAS, 453, 4175
- Gonçalves et al. (2003) Gonçalves, D. R., Corradi, R. L. M., Mampaso, A., & Perinotto, M. 2003, ApJ, 597, 975
- Gonçalves et al. (2006) Gonçalves, D. R., Ercolano, B., Carnero, A., Mampaso, A., & Corradi, R. L. M. 2006, MNRAS, 365, 1039
- Howarth & Adams (1981) Howarth, I. D. & Adams, S. 1981, Program EQUIB, University College London, (Wesson R., 2009, Converted to FORTRAN 90)
- Kingsburgh & Barlow (1994) Kingsburgh, R. L. & Barlow, M. J. 1994, MNRAS, 271, 257
- Liu et al. (2000) Liu, X.-W., Storey, P. J., Barlow, M. J., Danziger, I. J., Cohen, M., & Bryce, M. 2000, MNRAS, 312, 585
- López et al. (2012) López, J. A., Richer, M. G., García-Díaz, M. T., Clark, D. M., Meaburn, J., Riesgo, H., Steffen, W., & Lloyd, M. 2012, RMxAA, 48, 3
- Minkowski (1947) Minkowski, R. 1947, PASP, 59, 257
- Nordhaus & Blackman (2006) Nordhaus, J. & Blackman, E. G. 2006, MNRAS, 370, 2004
- Parker et al. (2005) Parker, Q. A., Phillipps, S., Pierce, M., & et al. 2005, MNRAS, 362, 689
- Preite-Martinez et al. (1989) Preite-Martinez, A., Acker, A., Koeppen, J., & Stenholm, B. 1989, A&AS, 81, 309
- Rees & Zijlstra (2013) Rees, B. & Zijlstra, A. A. 2013, MNRAS, 435, 975
- Reid & Parker (2010) Reid, W. A. & Parker, Q. A. 2010, Publ. Astron. Soc. Australia, 27, 187
- Saito et al. (2012) Saito, R. K., Hempel, M., Minniti, D., & et al. 2012, A&A, 537, A107
- Stanghellini et al. (2008) Stanghellini, L., Shaw, R. A., & Villaver, E. 2008, ApJ, 689, 194
- Steffen et al. (2009) Steffen, W., García-Segura, G., & Koning, N. 2009, ApJ, 691, 696
- Steffen et al. (2011) Steffen, W., Koning, N., Wenger, S., Morisset, C., & Magnor, M. 2011, IEEE Trans. Vis. Comput. Graphics, 17, 454
- Steffen & López (2006) Steffen, W. & López, J. A. 2006, RMxAA, 42, 99
- Tylenda et al. (1991a) Tylenda, R., Acker, A., Raytchev, B., Stenholm, B., & Gleizes, F. 1991a, A&AS, 89, 77
- Tylenda et al. (1993) Tylenda, R., Acker, A., & Stenholm, B. 1993, A&AS, 102, 595
- Tylenda et al. (1991b) Tylenda, R., Stasińska, G., Acker, A., & Stenholm, B. 1991b, A&A, 246, 221
- van der Hucht (2001) van der Hucht, K. A. 2001, New Astro. Rev., 45, 135
- Wang & Liu (2007) Wang, W. & Liu, X.-W. 2007, MNRAS, 381, 669
- Wareing et al. (2007) Wareing, C. J., Zijlstra, A. A., & O’Brien, T. J. 2007, MNRAS, 382, 1233