Direct numerical simulation of statistically stationary and homogeneous shear turbulence and its relation to other shear flows
Abstract
Statistically stationary and homogeneous shear turbulence (SS-HST) is investigated by means of a new direct numerical simulation code, spectral in the two horizontal directions and compact-finite-differences in the direction of the shear. No remeshing is used to impose the shear-periodic boundary condition. The influence of the geometry of the computational box is explored. Since HST has no characteristic outer length scale and tends to fill the computational domain, long-term simulations of HST are ‘minimal’ in the sense of containing on average only a few large-scale structures. It is found that the main limit is the spanwise box width, , which sets the length and velocity scales of the turbulence, and that the two other box dimensions should be sufficiently large , ) to prevent other directions to be constrained as well. It is also found that very long boxes, , couple with the passing period of the shear-periodic boundary condition, and develop strong unphysical linearized bursts. Within those limits, the flow shows interesting similarities and differences with other shear flows, and in particular with the logarithmic layer of wall-bounded turbulence. They are explored in some detail. They include a self-sustaining process for large-scale streaks and quasi-periodic bursting. The bursting time scale is approximately universal, , and the availability of two different bursting systems allows the growth of the bursts to be related with some confidence to the shearing of initially isotropic turbulence. It is concluded that SS-HST, conducted within the proper computational parameters, is a very promising system to study shear turbulence in general.
pacs:
Valid PACS appear hereI Introduction
The simulation of ever higher Reynolds numbers is a common practice in modern turbulence research, mainly to study the multi-scale nature of the energy cascade and similar phenomena. A basic property of these processes is that they are nonlinear and chaotic, which makes their theoretical analysis difficult. Direct numerical simulations offer a promising tool for their study because they provide exceptionally rich data sets. They have also been moving recently into the same range of Reynolds numbers as most experiments, especially when similar levels of observability are compared.
On the other hand, simulations are not without problems, some of which they share with experiments. One of those problems is forcing. Turbulence is dissipative, and unforced turbulence quickly decays. The highest resolution simulations available, with Taylor-microscale Reynolds number , are nominally isotropic flows with artificial forcing in a few low wavenumbers, Kaneda et al. (2003) and it is difficult to judge how far into the cascade the effect of the forcing extends. The forcing of wall-bounded shear flows is well characterized and corresponds to physically realizable situations, and they have often been used as alternatives to study high-Reynolds number turbulence. However, a consequence of their more natural large scales is that their cascade range is much shorter than in the isotropic boxes. Current simulations only reach (see Refs. Lozano-Durán and Jiménez, 2014a; Bernardini, Pirozzoli, and Orlandi, 2014). They are also inhomogeneous, and it is difficult to distinguish which properties are due to the inhomogeneity, to the presence of the wall, or to inertial turbulence itself.
A compromise between the two limits is homogeneous shear turbulence (HST), which shares the natural energy-generation mechanism of shear flows with the simplicity of homogeneity. This flow is believed not to have an asymptotic statistically stationary state, but it is tempting to use it as a proxy for general shear turbulence in which high Reynolds numbers can be reached without the complications of wall-bounded flows. Up to recently, HST has mostly been used to study the generation of turbulent fluctuations during the initial shearing of isotropic turbulence, where one of the classic challenges is to determine the growth rate with a view to developing turbulence models, avoiding as far as possible artifacts due to numerics and initial conditions. A question closer to our interest in this paper is whether some aspects of HST can be used as models for other shear flows. For example, Rogers and Moin Rogers and Moin (1987) showed typical ‘hairpin’ structures under shear rates comparable to those in the logarithmic layer of wall-bounded flows, and Lee et al. Lee, Kim, and Moin (1990) found that higher shear rates, comparable to those in the buffer layer, result in structures similar to near-wall velocity streaks. Jiménez (2013a) Those structures are known to play crucial roles in transition and in maintaining shear-induced turbulence, Jiménez and Moin (1991); Jiménez (1994); Hamilton, Kim, and Waleffe (1995); Waleffe (1997) and Kida and Tanaka Kida and Tanaka (1994) proposed a generation mechanism for the streamwise vortices in transient HST that recalls those believed to be active in wall turbulence.
Ideal HST in unbounded domains grows indefinitely, both in intensity and length scale. Rogers and Moin (1987); Tavoularis and Karnik (1989); Isaza and Collins (2009) During the initial stages of shearing an isotropic turbulent flow, linear effects result in algebraic growth of the turbulent kinetic energy, which is later transformed to exponential due to nonlinearity. Cambon and Scott (1999) These simulations are typically discontinued as the growing length scale of the sheared turbulence approaches the size of the computational box, but Pumir Pumir (1996) extended the simulation to longer times and reached a statistically stationary state (SS-HST) in which the largest-scale motion is constrained by the computational box and undergoes a succession of growth and decay of the kinetic energy and of the enstrophy reminiscent of the bursting in wall-bounded flows, Jiménez et al. (2005) suggesting that bursting is a common feature of shear-induced turbulence, not restricted to wall-bounded situations. In fact, previous investigations of SS-HST have suggested that the growth phase of bursts is qualitatively similar to the initial shearing of isotropic turbulence. Pumir (1996); Gualtieri et al. (2002)
It should be emphasized that the main goal of this paper is not to investigate the properties of unbounded HST, which is difficult to implement both experimentally and numerically for the reasons explained above. Simulations in a finite box introduce a length scale that, without interfering with homogeneity, is incompatible with an unbounded flow. It is precisely in the effect of this extraneous length scale, which may make simulations more similar to flows in which a length scale is enforced by the wall, that we are more interested. As first pointed out in Ref. Pumir, 1996, this is what SS-HST provides.
In this paper we present a numerical code optimized to perform the long simulations required to study SS-HST. We characterize the code and the influence of the numerical parameters on the physics, and draw preliminary conclusions about the physics itself. Since it will be seen that bursting times are , where is the mean velocity gradient, the required simulation times are of the order of several hundreds shear times. The most commonly used code for HST is due to Rogallo, Rogallo (1981) and involves remeshing every few shear times. Some enstrophy is lost in each remeshing Lee, Kim, and Moin (1990), and the concern about the cumulative effect of these losses has lead to the search for improved simulation schemes. Schumacher et al. Schumacher and Eckhardt (2000), and Horiuchi Horiuchi and Ozawa (2011) introduced artificial body forces to drive a mean shear gradient between stress-free surfaces, but this creates thin layers near the surfaces, and the impermeability condition prevents large-scale motions from developing. A different strategy for avoiding discrete remeshings in fully spectral codes is that of Brucker et al., Brucker et al. (2007) who used an especially developed Fourier transform essentially equivalent to remeshing at each time step.
Another approach to avoid periodic remeshing was pioneered by Baron Baron (1982) and later by Schumann Schumann (1985) and Gerz et al., Gerz, Schumann, and Elghobashi (1989) who used a ‘shear-periodic’ boundary condition in which periodicity is enforced between shifting points of the upper and bottom boundaries of the computational box by a central-finite-differences scheme. Similar boundary conditions have been used in simulations of astrophysical disks Balbus and Hawley (1998); Johansen, Youdin, and Klahr (2009); Salhi et al. (2014) under the name of ‘shearing-boxes’. The code in this paper belongs to this family, but uses higher-order approximations and a vorticity representation similar to that in Ref. Kim, Moin, and Moser., 1987.
A substantial part of the present paper is devoted to the choice of the dimensions of the computational box. The previous discussion about length scales suggests that this choice should influence the properties of the resulting SS-HST, but the matter has seldom been addressed in detail. We also spend some effort comparing the bursts in SS-HST with those in the logarithmic layer, and with the initial shearing of isotropic turbulence.
The organization of this paper is as follows. The numerical technique and the shear-periodic boundary condition is introduced and analyzed in §II. The effect of the computational domain is studied in §III, resulting in the identification of an acceptable range of aspect ratios in which the flow is as free as possible of computational artifacts, as well as in the determination of the relevant length and velocity scales. Sec. IV contains preliminary comparisons of the results of our simulations with other shear flows, with emphasis on the logarithmic layer of wall-bounded turbulence. Conclusions are offered in §V. Several appendices, included as supplementary material Sup , contain details of the numerical implementation, and validations of the code.
II Numerical method
II.1 Governing equations and integration algorithm
The velocity and vorticity of an uniform incompressible shear flow are expressed as perturbations, and , with respect to their ensemble averages (implemented here as spatial and temporal averaging), and . The streamwise, vertical, and spanwise directions are, respectively, and the corresponding velocity components are . We will occasionally use time-dependent averages over the computational box, , and over individual horizontal planes, . Capital letters, such as , will be mostly reserved for mean values, and primes, such as , for standard deviations.
The Navier–Stokes equations of motion, including continuity, are reduced to evolution equations for and , Kim, Moin, and Moser. (1987) with the advection by the mean flow explicitly separated,
| (1) |
where is the kinematic viscosity. Defining ,
| (2) |
In addition, the governing equation for are
| (3) |
Continuity requires that the mean vertical velocity should be independent of , and it is explicitly set to . We consider a periodic computational domain, , , and use two-dimensional Fourier-expansions with 3/2 dealiasing in those directions. The grid dimensions, and , and their corresponding resolutions, and , will be expressed in terms of Fourier modes. The domain is shear-periodic in , as explained in the next section. The direction is not dealiased, and . Its discretization is spectral compact finite differences with a seven-point stencil on a uniform grid. Its coefficients are chosen for sixth-order consistency, and for spectral-like behavior at (see Ref. Lele, 1992).
Time stepping is third-order explicit Runge–Kutta Spalart, Moser, and Rogers (1991) modified by an integrating factor for the mean-flow advection (see appendix A in Sup ). This uncouples the CFL condition from the mean flow, and is especially helpful in tall computational domains. The resulting time step is
| (4) |
where the denominators 2.85 and 9 in Eq. (4) are the maximum eigenvalues of our finite differences for the first and second derivatives. An implicit viscous part of the time stepper is not required because only the advective CFL matters in turbulent flows with uniform grids of the order of the Kolmogorov viscous scale. Our simulations use .
The problem has three dimensionless parameters that are chosen to be two aspect ratios of the computational box, and , and the Reynolds number based on the box width, .
We will also use the Taylor-microscale Reynolds number,
| (5) |
where is the dissipation rate of the fluctuating energy, is twice the kinetic energy per unit mass, and repeated indices imply summation. The Corrsin shear parameter Corrsin (1958) is , and the Kolmogorov viscous length is .
II.2 The shear-periodic boundary condition

The boundary condition used in this study is that the velocity is periodic between pairs of points in the top and bottom boundaries of the computational box, which are shifted in time by the mean shear. Baron (1982); Schumann (1985); Gerz, Schumann, and Elghobashi (1989); Balbus and Hawley (1998) For a generic fluctuation ,
| (6) |
where and are integers. In terms of the spectral coefficients of the expansion,
| (7) |
the boundary condition becomes
| (8) |
where are wavenumbers, are integers, and . This condition is implemented by a few complex off-diagonal elements in the compact-finite-difference matrices (see Ref. Schumann, 1985 and appendix B in Sup ).
Because of the streamwise periodicity of the domain, the shift of the upper boundary with respect to the bottom induces a characteristic time period, (hereafter, box period), in which the flow is forced by the passing of the shifted-periodic boxes immediately above and below. Jiménez (2013b) Since this forcing acts at the box scale, small turbulent structures can be expected to be roughly independent of the box geometry, but care should be taken to account for resonances between the largest flow scales and (see Sec. III.2). Note that Eq. (6) implies that the flow becomes strictly periodic in whenever is integer. From now on, we will use those moments as origins of time, and refer to them as the ‘top’ of the box cycle.
Typically, codes that depend on shearing grids remesh them once per box period. Rogallo (1981) The differences between those codes and the present one are sketched in Fig. 1. Consider the two-dimensional finite-differences grid in Fig. 1(a), which is drawn at some negative time, before the top of the box cycle. The solid rectangle is the fundamental simulation box, and the boundary condition (6) is that the endpoints of the inclined solid line have the same value. Without losing generality, this can be expressed by writing the solution as , where the dependence of on its second argument has period . The first argument represents the time-dependent tilting of the solution. Consider the representation of in terms of Fourier modes,
| (9) |
where periodicity requires that . The effective Fourier grid, is skewed, Rogallo (1981) as represented by the upwards-sloping dashed lines in Fig. 1(b). Finite-differences formulas always use the Fourier modes within the thick dashed rectangle (ABCD, plus its complex conjugate) in Fig. 1(b), whose limits are defined by the grid resolution. Moin (2001) As the Fourier grid is sheared downwards for increasing time, some modes leave the lower boundary of the resolution limit and are substituted by others entering through the upper one. The overall resolution is therefore maintained. In contrast, shearing-grid codes Rogallo (1981) let the Fourier modes skew outside the resolution box between the periodic remeshings. The triangular region (DcC) in Fig. 1(b) is thus not used, and the enstrophy contained in it is either lost or aliased. In contrast, the triangular region (AbB) is over-resolved, because it contains little useful information if the resolution has been chosen correctly. Note that the Fourier modes just described do not correspond to a unique time. It is easy to show that and result in exactly the same Fourier grid, and are numerically indistinguishable. They typically correspond to forward- and backwards-tilted pairs of boundary conditions, as shown by the the dashed inclined line in Fig. 1(a) and by the downwards-sloping single Fourier grid line in Fig. 1(b). In particular, it will become important in §III.3 that form one such pair of numerically-conjugate times.
Validations collected in Appendix C of the supplementary material Sup confirm that it maintains sixth-order accuracy in space and third-order in time. It is also confirmed that it produces results that are consistent with the well-known Rogallo’s Rogallo (1981) three-dimensional spectral remeshing method, both in the initial shearing of isotropic turbulence, (AGARD, 1998) and in longer simulations of SS-HST. Pumir (1996); Gualtieri et al. (2002, 2007) In all those cases, our enstrophy and other small-scale statistics are slightly higher than those in remeshing codes using the same Fourier modes, probably because the lack of remeshing prevents the loss of some enstrophy.
III Characterization of SS-HST
We have already mentioned that HST in an infinite domain evolves towards ever larger length scales, Tavoularis and Karnik (1989); Rogers and Moin (1987) so that simulations in a finite box are necessarily controlled to some degree by the box geometry. In this section, we examine the dependence of the turbulence statistics on the geometry and on the Reynolds number. Our aim is to identify a range of parameters in which the flow is as free as possible from box effects and can be used as a model of shear-driven turbulence in general.
A wide range of aspect ratios was sampled at Reynolds numbers between and 48000. Each simulation accumulates statistics over more than , after discarding an initial transient of . The lowest Reynolds number at which statistically steady turbulence can be achieved is , but we do not consider the transitional low-Reynolds number regime, and focus on the fully-developed cases in which turbulence does not laminarize for at least . Most of our simulations have well-resolved numerical grids with effective resolutions in the three coordinate directions. A few very flat boxes with have coarser grids with , since it will be seen that those geometries are severely constrained by the box, and are not interesting for the purpose of this paper. One of those cases was repeated at to confirm that the one-point statistics vary very little for the coarser grids. Also, because of the computational cost, some long- and tall-box cases, , and , were run at , which is empirically the marginal value to investigate small scales. Jiménez et al. (1993) In all cases, the energy input balances the dissipation rate within less than .

It turns out that the effect of the Reynolds number is relatively minor, at least for the larger scales, but that the flow properties depend strongly on the aspect ratios. A summary of the geometries tested is Fig. 2(a). The plane is divided into several regions, whose properties will be shown to be different. Those ranges, as well as the associated symbols used in the figures and the short name by which we refer to them below, are summarized in Table 1. The characteristics of a few representative simulations can also be found in Table 2 in §IV.
| Region | Symbol | ||
|---|---|---|---|
| Short | |||
| Flat | |||
| Acceptable | () | ||
| Long | |||
| Tall and long |

III.1 The characteristic length and velocity
Although it is reasonably well understood that the time scale of sheared turbulence is , there is surprisingly little information on the length scales. Sheared turbulence itself has no length scale, except for the viscous Kolmogorov length, and properties like the integral scale grow roughly linearly in time. Rogers and Moin (1987); Tavoularis and Karnik (1989) In statistically stationary simulations, the question is which of the box dimensions limits the growth and imposes the typical size of the turbulent structures. Fig. 2(b) shows the integral scale, , normalized by as a function of . The inset in that figure tests the scaling of with , and it is clear that is a much better choice. The ordinates in the inset are logarithmic, and spans two orders of magnitudes, while is always around 0.5, except for a few short-flat cases. This suggests that the flow is ‘minimal’ in the spanwise direction, and visual inspection confirms that there is typically a single streamwise streak of that fills the domain (see Fig. 13 in Sec. IV). A similar structure is found in minimal channels, both near the wall Jiménez and Moin (1991) and in the logarithmic layer, Flores and Jiménez (2010) and Pumir Pumir (1996) reports that most of the kinetic energy in his SS-HST is contained in the first spanwise wavenumber. The scaling with , not shown, is even worse than with .
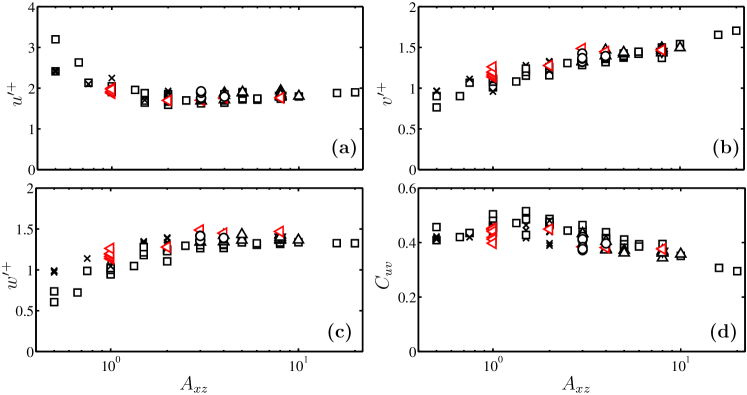
The scaling of the length suggest that velocities should scale with . This is tested in Fig. 4(a-c) for the velocity fluctuation intensities. They collapse reasonably well except for very flat boxes, . The scaling with , not shown, is very poor.
The tangential Reynolds stress is given in Fig. 4(d), in the form of a friction velocity defined as . As was the case for the intensities, it scales well with , but it turns out that most of the residual scatter in Fig. 4 is removed using as a velocity scale, as shown in Fig. 4(a-c). It is interesting that, when the intensities are scaled in this way, they are reasonably similar to those in the logarithmic layer of wall-bounded flows, which are in channels. Hoyas and Jiménez (2006) The usual argument to support this ‘wall-scaling’ is that the velocity fluctuations have the magnitude required to generate the tangential Reynolds stress, , which is fixed by the momentum balance. The argument also requires a constant value of the anisotropy of the Reynolds-stress tensor, whose most important contribution is the structure coefficient . It is given in Fig. 4(d), and also collapses well among the different cases, although it varies slowly with . Note the good agreement of the intensities in Figs. 4 and 4 with the results included from previously published simulations. Pumir (1996); Gualtieri et al. (2002, 2007)
We defer to the next section the discussion of the slow growing trend of with the aspect ratio, but the behavior of the three intensities for short boxes is interesting and probably has a different origin. For , (, ) is stronger (weaker) than the cases with more equilateral boxes. A similar tendency was observed in simulations of turbulent channels in very short boxes by Toh and Itano. Toh and Itano (2005) It can also be shown that the inclination angle of the two-point correlation function of tends to zero for these very short boxes, while it is around in longer boxes (not shown), and in wall-bounded flows. Sillero, Jiménez, and Moser (2014) The behavior of the intensities suggests that the streaks of the streamwise velocity become more stable and break less often when the box is short, which is reasonable if we assume that the box limits the range of streamwise wavenumbers available to the instability. Indeed, the linear stability analysis of model streaky flows shows that they are predominantly unstable to long wavelengths, and that shorter instabilities require stronger streaks. Waleffe (2003)
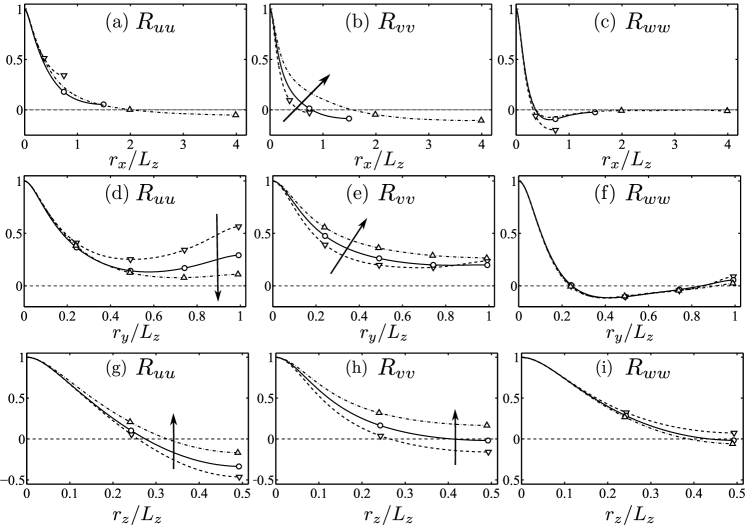

Figs. 6 and 6 display the two-point correlation functions of the velocities. The streamwise correlations in Fig. 6(a-c) are the longest, especially , as already noted by Ref. Rogers and Moin, 1987. This is common in other shear flows, Sillero, Jiménez, and Moser (2014) and Fig. 6(a) shows that at least is required for the streamwise velocity to become independent of the box length. This roughly agrees with the observation of Reynolds-stress structures in channels, which have aspect ratios of the order of (see Ref. Lozano-Durán, Flores, and Jiménez, 2012), and with our discussion on the velocity intensities in short boxes. Pumir Pumir (1996) likewise reported that the turbulence statistics become independent of the aspect ratio for , and Rogers et al. Rogers and Moin (1987) used for their transient-shearing experiments after a qualitative inspection of the correlation functions. It is interesting that in Figs. 6(b,e,h) becomes longer in the three directions for longer boxes, even if is typically a short variable in wall-bounded flows. Jiménez (2013a); Sillero, Jiménez, and Moser (2014) This agrees with the common notion that the limit on the size of in wall-bounded turbulence is due to the blocking effect of the wall, and suggests that the effect observed in the longer boxes is related to structures that span several vertical copies of the shear-periodic flow. Otherwise, the central peak of all the correlations collapses well when normalized with , even if spans a factor of over 20 in our simulations. Note that none of the curves in Fig. 6(g,h,i) shows signs of decorrelating at the box width, supporting the conclusion that the flow is constrained by the spanwise box dimension.
Fig. 6 shows two-point velocity correlation functions in the direction, for different vertical aspect ratios. The collapse with of the different correlations is striking; taller boxes lead to more structures of a given size, but not to taller structures. The figure also provides a minimum vertical aspect ratio, , for structures that are not vertically constrained, ruling out what we have termed above ‘flat’ boxes.
The correlation functions in Fig. 6 and 6 depend on the Reynolds number in a natural way. The inner core narrows as the Reynolds number increases and the Taylor microscale decreases, but the outer part of the correlations stays relatively unaffected.
The Taylor-microscale Reynolds number satisfies except for very flat or short boxes. This agrees approximately with Pumir’s data Pumir (1996) and the latest high-Reynolds-number DNS by Gualtieri, et al. Gualtieri et al. (2007), although their earlier data Gualtieri et al. (2002) are 10–20% smaller than in our simulations. The difference is too small to decide whether the reason is numerical or statistical.
III.2 Long boxes, the bursting period, and box resonances
The results up to now show that statistically-stationary shear flow is mostly limited by the spanwise dimension of the box, but that very short, , or very flat boxes, , should be avoided because they are also minimal in the streamwise or vertical direction. Figs. 4 and 6 show that there is an additional effect of very long boxes, which have stronger and longer fluctuations of and, to some extent, of . This is the subject of this section.
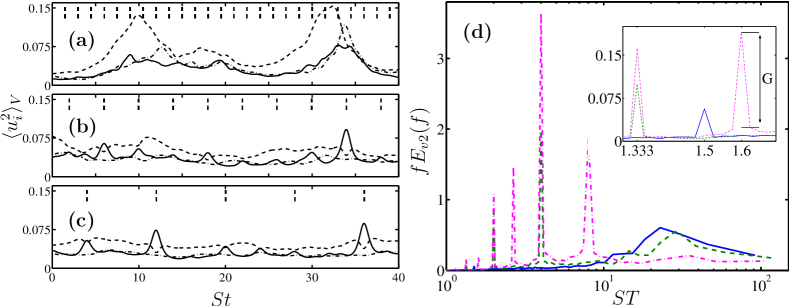
The most obvious property of the SS-HST flows is that they burst intermittently. This is seen in the time histories of the box-averaged velocity fluctuations, given in Fig. 7(a-c) for three boxes of different streamwise elongation. The character of the bursting changes with . For the relatively short box in Fig. 7(a) the bursts are long, and predominantly of the streamwise velocity . They are followed some time later by a somewhat weaker rise of and . This relation between velocity components is reminiscent of the bursting in minimal channels analyzed in Ref. Jiménez, 2013b, and the bursting time scale (–20) is also of the same order. The longer boxes in Fig. 7(b,c) undergo a different kind of burst, sharper , and predominantly of . These sharp bursts always occur at the top of the box cycle, which is marked by the vertical dashed ticks in the upper part of the figures. There is little sign of interaction of the box cycle with the history in Fig. 7(a).
The frequency spectra of the histories of are given in Fig. 7(d). They have two well-differentiated components: a broad peak around that corresponds to the width of the bursts in Fig. 7(a), and sharp spectral lines that represent the average distance between the shorter bursts in Fig. 7(b,c). We will see below that these lines are at the box period and its harmonics. Note that these are not frequency spectra of the velocity , but of the temporal fluctuations of its box-averaged energy, and that their dimensions are proportional to . Note also that the broad ‘turbulent’ frequency peak is still present in the resonant cases, although it weakens progressively as the resonant component takes over.

The resonant lines correspond to the narrow bursts of Fig. 7(b,c), and get stronger with increasing . Fig. 8(a) shows that they are characterized by a temporary increase in the two-dimensionality of the flow. The open symbols in that figure show the fraction of contained in the first few two-dimensional -harmonics , plotted against . They account for a relatively constant fraction (approximately 20%) of the total energy. The solid symbols are the same quantity computed at the top of the box cycle, . It begins to grow at elongations of the order of , and accounts for almost 60% of the total energy for the longest boxes. Note that the data collapse relatively well with , rather than with .
The growth of the two-dimensionality interferes with the overall behavior of the flow. The average length of individual bursts is given in Fig. 8(b), computed as the width of the temporal autocorrelation function of , measured at (see Ref. Jiménez, 2013b). For short boxes , the period stays relatively constant, . But it decreases when the two-dimensionality begins to grow in Fig. 8(a). The diagonal dashed line in Fig. 8(b) is , and strongly suggests that the effect of the long boxes is associated with the interaction of the box period with the bursting. Note that the bursting width for tends to be that of a linearized two-dimensional Orr burst. Orr (1907)
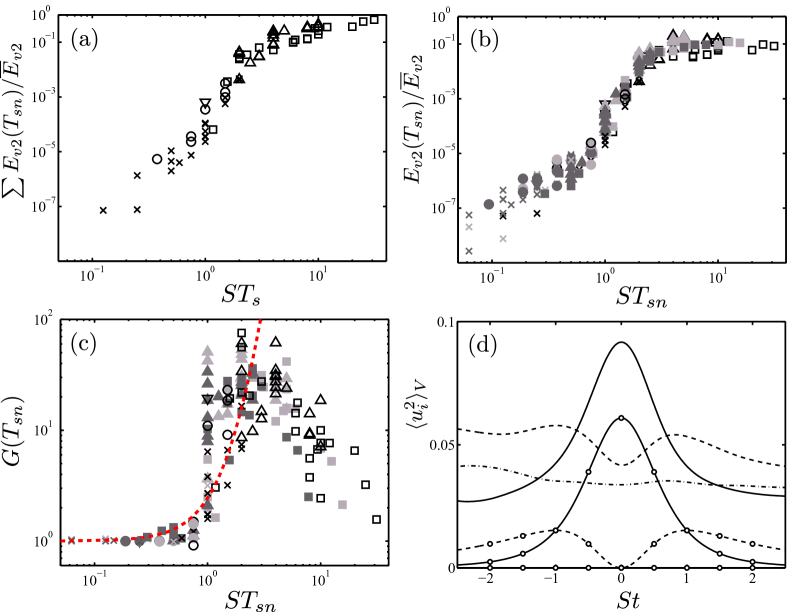
That the spikes are associated with the box period is shown in Fig. 9(a), which displays the total spectral energy of the temporal evolution of at period and its harmonics . It is negligible for boxes with , but increases rapidly after that threshold. It then keeps increasing slowly until most of the fluctuations are due to the spectral spikes.
The reason for the residual growth after resonance is seen in Fig. 9(b), where the energy in each harmonics is plotted separately versus . Each harmonic resonates with its own box period, , after which its amplitude decreases slightly (note the wide vertical scale of these two figures). The slow growth of the spike energy beyond the resonance in Fig. 9(a) is due to the accumulation of new resonant harmonics.
In fact, if we accept that the spikes are due to the amplification of pre-existing background fluctuations, Fig. 9(c) shows that the maximum amplification takes place at . This is true for each individual harmonic. The quantity in this figure is sketched in the inset of Fig. 7(b), and is the ratio between the energy in the spectral spike, and the energy in the background spectrum at the same frequency when the spike is removed by linear interpolation across the sharp spectral line, .
It is tempting to hypothesize that a phenomenon with the same periodicity as the box-passing period is due to the interaction between structures from neighboring shear copies. Fig. 9(d) shows that this is not the case. It displays the details of the velocity amplitudes during one of the spikes, and it agrees almost exactly with the linearized Orr burst included in the figure as a comparison. Orr (1907) The overtaking of shear-periodic copies advected by the mean velocities in neighboring boxes is not very different from the shearing mechanism in Orr’s. For example, the characteristics dip in during the burst of is the same in both cases, Umurhan and Regev (2004); Jiménez (2007, 2013b) and the essence of the interaction is the tilting of the structures due to the shear. However, the details are different. In the case of the shear-periodic boundary condition, the interacting structures pass each other at a constant vertical distance. It can then be shown that both the period and the width of the velocity fluctuations are of order , and that their amplitude decays very fast as increases, essentially because the shear-periodic copies move farther from each other.Jiménez (2013b) In the case of the shear, the mechanism is local tilting, and the time scale of the amplification is . The width of each burst is , but the distance between bursts is still . It is clear from Fig. 9(d) that this is the case here. Inspection of the sharp bursts in Figs. 9(b,c) shows that their width is a few shear times, independently of .

On the other hand, Orr bursts are not periodic. The Orr mechanism is a linear amplification process that works on preexisting initial conditions of the right shape (backwards tilting wavefronts), even when they are only one component of a more complex flow. In turbulence, these conditions are created ‘randomly’ by nonlinear processes, and Orr-like bursts, not necessarily two-dimensional, occur whenever that happens. But the observed two-dimensional quasiperiodic bursting with the passing frequency of the box requires a more deterministic explanation. We have seen that the flow during the spikes is two-dimensional in the plane. Taking the origin of time at the top of the burst, the inviscid solution of the linearized equations (see Ref. Jiménez, 2013b) for two-dimensional perturbations with and is a single burst,Moffatt (1967); Townsend (1976)
| (10) |
where is the initial vertical velocity at the top of the burst, and are the initial and time-evolving wave numbers. Fig. 10 shows the the evolution near the bottom of the box cycle of the two-point correlation function of the harmonic within the fundamental numerical box. A band of is tilted forward, as in an infinite shear, and can only extend across the box boundaries by connecting with one of the several periodic copies of itself in the boxes immediately above and below the fundamental box. It does so linking with the closest copy. Consider the top boundary. In the first part of the box cycle, , the upper-box structure closest to the fundamental one is the one ahead of it, and the band keeps evolving as an infinitely long forward-tilted sheet. At the distance from the fundamental to the two copies ahead and behind it is the same, and after that moment the trailing copy is the closest one. The figure shows that the correlation condenses into an oval structure and reconnects itself to the trailing copy. The result is a backwards-tilting layer that restarts the shearing amplification cycle.
A rough estimate of the amplifications in Fig. 9(c) can be obtained from this mechanism. The amplitude of in an Orr burst, , depends almost exclusively of the front inclination angle (see Ref. Jiménez, 2013b). The tilting of the velocity fronts at the moment of reconnection is given by . The vertical velocity is amplified as the layer moves towards the vertical (), and the maximum amplification is . Remembering that the amplification in Fig. 9(c) is proportional to , we obtain
| (11) |
In essence, longer boxes have stronger two-dimensional bursts because the longer box period gives the primary wavelength more time to amplify. Eq. (11) is plotted as a dashed line in Fig. 9(c), and captures reasonably well the rise of the amplification. Note that a similar estimate holds for the higher two-dimensional Fourier harmonics if is substituted by the wavelength , and by . It is harder to explain why the spikes cease to be amplified beyond . The most likely reason is nonlinearity. Fig. 9(b) shows that the amplitude of the spikes at is already about 10% of the total, and it is probably inconsistent to describe them with a linear theory. Also, the spectra in Fig. 7(d) show that the spectrum of the turbulent bursts begins to grow beyond –4, so that the spikes and the normal turbulence begin to interact directly. In fact, the reason why the amplitude of the spikes does not decrease beyond in Fig. 9(b), even if the amplifications in Fig. 9(c) decrease, is that the Orr mechanism has stronger baseline perturbations on which to work. It is conceivable that the background turbulence acts as a eddy viscosity that prevents further growth of the Orr bursts.
III.3 The numerical regeneration of linear Orr bursting
Although it is tempting to interpret the reconnection process in physical terms, it is clear that it is an artifact of simulating the flow in a shear-periodic finite box. Homogeneous shear flow has no implied temporal periodicity, even for flows that are periodic in , and the interactions described above do not exist. It is important to stress that only the averaged correlations in Fig. 10 are smooth. The instantaneous flow has smaller scales and is less ordered. It should also be noted that this two-dimensional linear bursting is unrelated with the streak instability in the self-sustaining process of shear turbulence,Waleffe (1997) which is intrinsically three-dimensional.
To understand the numerical regeneration process we should go back to the sketch of the implied Fourier grid in Fig. 1(b). Note that the temporal evolution of the Fourier modes in Eq. (9), , is the same as for those in the linearized RDT solution in Eq. (10). Therefore, the amplitude of in each grid mode approximately satisfies the linearized RDT, which can be recast as . The decrease in as the boundary condition approaches the top of the box cycle is the Orr amplification mechanism.
Consider the first streamwise Fourier mode, . Near the bottom of the box cycle, the two modes responsible for the largest-scale structures are those marked as Q and Q’ in Fig. 1(b). The top mode, Q, whose wave-vector points upwards , is a backwards-tilted front such as the one in Fig. 10(e). The bottom mode Q’ is a forward-tilted front. Statistically, both modes are similarly forced by the nonlinearity, and their respective amplitudes are due to the linear processes associated with their changing wavevector. For , mode Q’ is closest to and is therefore the strongest of the two. As time increases, Q’ moves away from and weakens, while mode Q moves closer and strengthens. At both modes are equally intense on average. After that moment, the upper, backwards-tilted mode predominates, and the structures flips backwards.
The linear Orr bursting is not restricted to long boxes. Whenever a particular Fourier mode crosses the axis, the linear amplification process occurs to some extent, even at moderate box aspect ratios. There are two time scales involved that correspond to the two spectral components in Fig. 7(d). Two-dimensional linear bursts have widths of the order , and are triggered by the boundary conditions at longer intervals determined by the aspect ratio of the particular wavelength involved. The strongest resonance is for wavelengths of the order of , because they are the largest ones, and interact most strongly with their periodic copies. They are triggered at intervals determined by the box aspect ration , and are the ones discussed in this section. Shorter harmonics also burst linearly, but they are seldom two-dimensional, and their behavior tends to be dominated by nonlinearity. The direct detection of the linear bursting in minimal channels is investigated in Ref. Jiménez, 2015. The result is that, once a burst is initiated by other causes, its evolution can be predicted linearly over times of the order of 10–20% of an eddy turnover, corresponding to a tilting interval to . Two-dimensional linear bursts become dominant in long boxes because there are few nonlinear structures at the scale of the box length, and those that exist are only the ones triggered by the two-dimensional boundary conditions.
IV Comparison with other shear flows
The previous section delimits the set of box aspect ratios in which the flow is as free as possible from the artifacts of a finite simulation domain. The ‘acceptable’ region is summarized in Fig. 2(a) as the trapezoidal central region in which cases are marked as circles (see also Table 1). Note that very tall and long boxes are defined by a further uncertain limit that has not been discussed up to now. Very long and tall boxes satisfy all the above criteria, but the single example tested in that region at marked as a down-pointing triangle in Fig. 2(a)) behaved strangely, with very deep three-dimensional bursts that could not be described as Orr bursts. Those simulations are expensive to run. They are still minimal in the spanwise direction, but otherwise very far from our desired range of minimal flows, and this range was not pursued further.
A full discussion of what can be learned about the physics of shear turbulence from such simulations is left to a later paper, but we briefly review in this section how similar the statistically stationary HST is to other shear-dominated flows, particularly the logarithmic layer of wall-bounded turbulence and the initial shearing of isotropic turbulence.
| Run | |||||||||
|---|---|---|---|---|---|---|---|---|---|
| L32 | 2000 | 190, 192, 94 | 1706 | 47 | 6.82 | 5.36 | 0.41 | 0.092 | 0.104 |
| L34 | 2000 | 190, 384, 94 | 1581 | 48 | 6.97 | 5.30 | 0.42 | 0.095 | 0.105 |
| L38 | 2000 | 190, 768, 62 | 3177 | 48 | 7.02 | 5.34 | 0.43 | 0.097 | 0.106 |
| L44 | 2000 | 190, 384, 94 | 1570 | 48 | 7.10 | 5.28 | 0.43 | 0.093 | 0.100 |
| M32 | 12500 | 766, 512, 254 | 1029 | 105 | 7.53 | 10.9 | 0.38 | 0.101 | 0.108 |
| M34 | 12500 | 766, 1536, 382 | 1953 | 111 | 7.70 | 11.2 | 0.41 | 0.105 | 0.111 |
| H32 | 48000 | 2046, 2048, 1022 | 334 | 243 | 7.57 | 24.8 | 0.45 | 0.096 | 0.102 |

Some of those comparisons have already been made in previous sections or publications. The numerical parameters and some basic statistics of the acceptable cases among our runs are summarized in Table 2. When discussing Fig. 4, we mentioned that the velocity fluctuation intensities are similar in SS-SHT and in the logarithmic layer. The correspondence improves if we center our attention on the acceptable cases marked as circles, with the exception of , which is stronger in the SS-HST than in channels (–1.3 against 1.1). The relation between the different intensities is best expressed by the Lumley invariants of the Reynolds-stress anisotropy tensor , which are shown in Fig. 11(a) in the modified form, , (see Ref. Pope, 2000). The figure includes results for large channels. They vary from roughly axisymmetric turbulence, dominated by , near the wall, which is mapped in the upper-left part of the figure, to approximate isotropy in the center of the channel, mapped in the lower-right corner. The logarithmic layer is characterized by an approximately constant second-order invariant, which is also where the SS-HST tends to concentrate. The tendency of the latter to be more isotropic than the channel reflects its stronger . The velocities tend to be more isotropic as the Reynolds number increases, although there is a residual effect of the aspect ratios for the SS-HST. Numerical values are given in Table 2.
The strongest connection between the SS-HST and the logarithmic layer is that both are approximately equilibrium flows in which the energy production equals dissipation. The local energy balance can then be expressed as (see Ref. Jiménez, 2013a), and links quantities that are usually associated with large and small scales. One example is the Corrsin parameter , which was shown in Ref. Jiménez, 2013a to be in various shear flows, including some of the present SS-HST simulations (see Table 2). Another example is the ratio , also listed in Table 2, which is shown in Fig. 11(b) as a function of . The SS-HST and the channels agree well. For both quantities, the energy equation can be manipulated to give exact expressions: and . The agreement in Fig. 11(b) and the approximate universality of are then equivalent to the agreement of the intensities in Fig. 4. Nonequilibrium flows, such as the initial shearing of isotropic turbulence, Rogers and Moin (1987); Lee, Kim, and Moin (1990); Sarkar (1995); Isaza and Collins (2009) do not agree either with the channels or with the SS-HST. Most of them do not even fall within the ranges represented in Figs. 11(a,b).

A more diagnostic property is the geometry of the structures. Fig. 12(a) shows the premultiplied two-dimensional spectrum of the vertical velocity of the SS-HST (M32 in Table 2), compared with those of a large channel Hoyas and Jiménez (2006) and of a minimal one. Flores and Jiménez (2010) The wall distance of the channels is chosen to match the three Reynolds numbers to , and falls within the logarithmic layer. The boxes of the SS-HST simulation and of the minimal channel are too small to capture the largest scales of , but the agreement of the three cases is surprisingly good. The small scales of the spectrum of and (not shown) also agree well, although both quantities, which are typically larger than , are severely truncated in the two minimal boxes.
It is hard to define spectra in the non-periodic vertical direction, but Fig. 12(b) displays the two-point correlation function for the same three cases, centered at the same location as in Fig. 12(a). The upper part of the correlations agrees relatively well for the SS-HST and the large channel, even if the top of the outermost solid contour is at , where the shear in the channel is three times weaker than at the reference point. The upper part of the minimal channel agrees worse, probably because its computational box is too narrow to allow good statistics above (see Ref. Flores and Jiménez, 2010).
The lower part of the correlations agree well for the two channels, but the SS-HST extends much farther than any of the other two. The lower part of the outermost contour of the two channels is very near the wall, but the SS-HST has no wall, and is symmetric with respect to its center. It is interesting that, in spite of the large differences in their lower part, the geometry of the upper part of the turbulent structures is so similar between the three flows. The extra freedom of the vertical velocity in the absence of the wall is probably responsible for the slightly higher intensities of this velocity component in the SS-HST case. As in the spectra, the small scales of and agree well, but the differences of the simulation boxes are too large to allow a useful comparison between these larger structures.
The length scale to be used in normalizing Fig. 12 is not immediately obvious. Viscous wall units are not relevant for the SS-HST, and it is indeed found that they collapse the correlations poorly. The integral length works better but, after some experimentation, the best normalization is found to be the Corrsin scale. This is probably physically relevant. That length was introduced in Ref. Corrsin, 1958 as the limit for small-scale isotropy in shear flows, and it is roughly the scale of the smallest tangential Reynolds stresses. It can be interpreted as the energy-injection scale for shear flows, and it is related to the integral scale by . We have mentioned that is fairly similar in SS-HST and channels, but the differences are enough to substantially improve the collapse of the correlations and of the spectra.

We finally compare the bursting behavior of SS-HST and wall-turbulence. Fig. 13 shows the evolution of the streamwise-velocity streak in SS-HST during a burst. Comparison with the logarithmic layer of a minimal channel in Fig. 3 of Ref. Flores and Jiménez, 2010 strongly suggests that the two phenomena are related.
Previous investigations of SS-HST have suggested that the growth phase of bursts is qualitatively similar to the shearing of initially isotropic turbulence. Pumir (1996); Gualtieri et al. (2002) Fig. 14(a) provides some quantitative evidence and qualifications. It contains probability density functions (p.d.f.) for the logarithmic growth rate of the kinetic energy, , in SS-HST and minimal channels. This quantity has been widely discussed for the shearing of initially isotropic turbulence, and is believed to settle asymptotically to –0.15 in weakly sheared cases , Rogers and Moin (1987); Sarkar (1995) and to somewhat higher values, , in strongly sheared ones. Lee, Kim, and Moin (1990); Isaza and Collins (2009) In statistically stationary flows, the mean value of vanishes, but the distribution of its instantaneous values can be used as a measure of how fast bursts grow during their generation phase, or otherwise decay.

The p.d.f.s for the SS-HST flows in Fig. 14(a) are for three cases with the same aspect ratios, , but different Reynolds numbers. Those for the minimal channels are compiled over the range of height –0.25, which is known to be roughly minimal for the largest structures of the logarithmic layer. Flores and Jiménez (2010) By changing and the width of the simulation box, the Taylor-microscale Reynolds number of the three channels are also made different. The agreement of the different p.d.f.s again supports that the dynamics of bursting in minimal channels and in SS-HST is similar. The range of initial growth rates found in weakly sheared turbulence is marked in Fig. 14(a) by a horizontal bar. It spans the near-tail of the p.d.f.s, consistent with the interpretation mentioned above that the growth of individual bursts is similar to the weak shearing of initially isotropic turbulence. The values of in Table 2 confirm that SS-HST is in the weakly sheared regime.
The p.d.f. of depends on the size of the computational box. Taller SS-HST boxes or channel heights closer to the wall produce narrower distributions. The common property of the boxes in Fig. 14(a) is that they are minimal, in the sense that they are expected to contain a single large structure on average. Taller boxes can be expected to contain several structures, evolving roughly independently. The same is true of near-wall planes in the channel, where several small near-wall structures fit within the simulation box. In those cases, the energy of the individual structure add to the total energy and the standard deviation of the total growth rate should decrease roughly as the square root of the expected number of structures. This is confirmed by the SS-HST simulations. The standard deviation of in cases L32, L34 and L38, expected to contain one, two and four structures, are in the ratio 1.96, 1.39 and 1, which are almost exactly powers of .
The situation is the opposite for the temporal correlation functions used to compute the bursting period in Fig. 8(b), a few of which are displayed in Fig. 14(b). It was shown in Ref. Jiménez, 2013a that the width of the temporal correlation of is of the same order of magnitude in both flows, but Fig. 8(b) shows that the correlations of the SS-HST are somewhat wider than in the channels. They also widen with increasing Reynolds number. Two of the SS-HST simulations in Fig. 8(b) (L32 and M32) have the same aspect ratios and different . The higher Reynolds number is substantially wider than the lower one. Two other simulations (M32 and M34) have similar Reynolds numbers and different aspect ratios, and their correlations agree. It can be shown that the wider correlations are due to the different behavior of the higher Fourier modes. If these are filtered out, the temporal correlations of the longest Fourier mode collapse for all Reynolds numbers.
The width of individual bursts, , is thus determined by the linear transient amplification of random nonlinear perturbations, as already shown in Refs. Jiménez, 2013b, a. On the other hand, the time between consecutive bursts is determined by how often these particular initial conditions are generated, and is beyond the scope of the present paper. The long-term behavior of sheared turbulence is a controversial subject, Cambon and Scott (1999) but the wider consensus seems to be that it grows indefinitely, both in intensity and in length scale. Rogers and Moin (1987); Tavoularis and Karnik (1989); Isaza and Collins (2009) In simulations, the growth of the length scale will eventually interfere with any finite computational box, and simulations of the initial shearing have traditionally been discontinued at that moment. It is generally believed that the periodic bursting of statistically stationary HST is due to the periodic filling of the computational box by the growing length scales. We have seen in Sec. III.3 a particular numerical artifact leading to the regeneration of linear bursts, and there is circumstantial evidence from our simulations that some of the length scales reach the box limit before the collapse of the intensities. On the other hand, Fig. 8(b) shows that the temporal width of the bursts is relatively independent of the box dimensions within certain limits, and that it scales well with the shear. A similar argument about length scales could be made about channels, although inhomogeneity and the wall may play a role similar to geometry in that case. However, we have just shown that channels share many properties with SS-HST, and it was shown in Ref. Jiménez, 2013a that the bursting period of minimal channels, which are geometrically constrained, is similar to the lifetime of individual structures in larger simulations, Lozano-Durán and Jiménez (2014b) which are not. Both are of the same order as the bursting width of SS-HST (Fig. 14b). In summary, it appears that bursting is a property of shear flows in general, not linked to the presence of a wall, but its properties require further work.
V Conclusions
We have performed direct numerical simulations of homogeneous shear turbulence (HST) to explore the parameter range of statistically stationary HST (SS-HST). Our code uses a shear-periodic boundary condition in the vertical direction that requires no periodic remeshings, and that is implemented directly on the compact finite difference. The other directions are spectral. Validations collected in Appendix C of the supplementary material Sup confirm that the code maintains its designed accuracy, and reproduces well previous simulations. In all those cases, our small-scale statistics are slightly higher than those in remeshing codes using the same Fourier modes,Rogallo (1981) probably because the lack of remeshing prevents the loss of some enstrophy. We have given a simple theoretical analysis for why that should be so.
The statistics of SS-HST are strongly dependent on the geometry of the computational box, represented by its two aspect ratios, and . We have shown that the relevant length scale is the spanwise width of the box, , and that the velocity scale is . The relevant Reynolds number is therefore , but the characteristics of the largest-scale motions in SS-HST are found to be fairly independent of . It is interesting that is also the dimension that determines the range of valid wall distances in minimal turbulent channels. Flores and Jiménez (2010) Since it is believed that the large scales of theoretical homogeneous shear flow have no characteristic length, flows simulated over long enough times tend to ‘fill’ any computational box, and long-term simulations of SS-HST are always ‘minimal’ in the sense that there are only a few largest-scale structures in the computational box.
The empirical evidence is that the effect of the geometry can be reduced by ensuring that box dimensions other than do not constrain further these minimal structures. The limits identified are and . A similar argument can be made for minimal channels, Flores and Jiménez (2010) even though ‘natural’ structures are always influenced by the wall in that case. The effect of minimal boxes is to override that constraint when the box becomes too narrow far enough from the wall. It follows that the limit in which the channel is ‘just minimal’ (see Ref. Flores and Jiménez, 2010) should have similar properties to ‘just minimal’ SS-HST.
That turns out to be approximately true. The one-point statistics of SS-HST in the suitable range of the aspect ratios agree surprisingly well with those of the logarithmic layer in turbulent channel flows, particularly when scaled with the friction velocity derived from the measured Reynolds stresses. The same is true for the wall-parallel spectra of the wall-normal velocity, although the length scales of the other two velocity components are typically too large to be fruitfully compared either with SS-HST or with minimal channels. The wall-normal spatial correlation of also agrees well with channels and boundary layers, but only in the direction away from the wall. The correlations of channels in the direction of the wall are limited by impermeability, but those of the SS-HST are not, and extend symmetrically downwards. It is interesting that even this strong difference does not influence the top part of the correlation.
An interesting limit of SS-HST that does not appear to exist in minimal channels is that of very long boxes . Their bursting is dominated by a two-dimensional numerical regeneration process associated with the interaction between shear-periodic copies of the numerical box. It can be treated analytically to a large extent, but appears to be unrelated to physics.
A common characteristic of SS-HST and wall-bounded turbulence is quasi-periodic bursting, and we have shown that it shares many common characteristics in both flows. Besides strong similarities of the flow fields, the lifetime of individual bursts, defined from the temporal autocorrelation function, scales with the shear in both cases as . In contrast with the numerical two-dimensional bursts described in the previous paragraph, these ones involve the quasi-simultaneous growth of the three velocity components, and presumably originate from the linear amplification of three-dimensional ‘dangerous’ initial conditions Schmid (2007); Jiménez (2013b) randomly found as parts of the nonlinear turbulent field. The probability distribution of the growth rates of the intensities suggests that the amplification phase of the bursts is similar to the weak shearing of initially isotropic turbulence, where the generation of initial conditions is presumably the same. In general, it is concluded that the similarities between SS-HST and other shear flows, particularly with the logarithmic layer of wall turbulence, make it a promising system in which to study shear turbulence in general.
Acknowledgements
This work was partially funded by the ERC Multiflow project. S. Dong was supported by the China Scholarship Council. The authors gratefully acknowledge the computing time granted by the Prace European initiative on the supercomputer JUQUEEN at the Jülich Supercomputing Center, and by the Red Española de Supercomputación on Marenostrum at the Barcelona Supercomputing Centre. We are grateful to R.R. Kerswell for a careful critique of the original manuscript.
Appendix A Three-step fully-explicit Runge–Kutta with analytical integration of the shear convective terms
Applying the Fourier transform to the governing equations (Eqs. (1,2) in the manuscript), we have in general,
| (12) |
where represent any of , , , or . We analytically absorb the linear shear convective term in Eq. (12) by multiplying it by the integrating factor ,
| (13) |
The semi-discrete form of the three-step fully-explicit Runge–Kutta scheme Spalart, Moser, and Rogers (1991) to advance from to leads to,
| (14) | |||||
| (15) | |||||
| (16) | |||||
| (17) | |||||
| (18) |
where , , , and represent the intermediate variables at each Runge-Kutta sub-step, ={1,2,3}, and corresponds to the next time step. The coefficients are:
| (19) |
This scheme is third-order consistent. The additional operations over a traditional integrator are the five ‘unmapping’ multiplications in Eqs. (14)-(18) by (). In our simulations, the cost of mapping is roughly 10% of the total, but it reduces the advective CFL by the ratio , which can be considerable, especially for tall computational boxes, .
A semi-implicit scheme for the viscous term could also be used (e.g., Ref. Spalart, Moser, and Rogers, 1991), but it is useful only at very low Reynolds numbers (roughly in the present case) for which the viscous CFL leads to a smaller time step than the advective one.
Appendix B Compact finite differences with a shear-periodic boundary condition
In order to compute derivatives in the vertical direction (), we use a compact-finite-differences scheme Lele (1992) based on a seven-point stencil with 6th- and 8th-order resolution accuracy for the first and second derivative, respectively. Exact spectral behavior is enforced at the wavenumbers for the first derivative, and for the second one. The modified wavenumber estimated by Fourier analysis for the compact finite differences described in this section stays close to the exact differentiation over a range of wavenumbers , which is used for the estimation of the resolution requirements of the DNS. The consistency errors, for the first derivative, and for the second one, are and , respectively, at the adopted resolving efficiency .
The discretized form of the -th derivative of in the -direction, where , is written as
| (20) |
where represents the -th derivative of . Assuming an even derivative, the structure of the matrix is
| (31) |
and has the same structure of non-zero entries, with different coefficients. Note that , , and are constant real values. The application of the shear-periodic boundary condition
| (32) |
to the compact finite difference matrices appears in its off-band-diagonal elements, which are complex , , , and their complex conjugates , , and . Specifically, , etc., which is used to substitute off-grid elements by their shifted copies near the opposite boundary. I.e., , , etc., where is the mean velocity difference between the two boundaries. Therefore, and are time-dependent Hermitian and need to be updated at each Runge–Kutta sub-step. Odd derivatives are handled similarly with a skew-Hermitian .
The linear system (20) is directly solved by applying the modified Cholesky decomposition ,
| (43) |
and
| (49) |
The modification in the time-marching in DNS is done only for the three complex lines , and for the matrix , and their complex-conjugates for . Note that the band-diagonal elements , , and the diagonal elements are real constant.
The one-dimensional Helmholtz equation, expressed generally as (where is real) leads to a linear system , which can be solved for by applying the modified Cholesky decomposition of the Hermitian operator .
Appendix C Validations
C.1 Rapid distortion theory
When the velocity gradient fluctuations are small with respect to the mean shear, the Navier–Stokes equations can be linearized. In this ‘rapid distortion’ limit,
| (50) |
where u and are infinitesimal. Note that when these linearized equations are written in terms of the variables and , they reduce to the classical Orr–Sommerfeld and Squire equations, respectively.
For individual Fourier modes in a pure shear, the velocities can be expressed as , and Eq. (50) becomes
| (51) | |||||
where and are the initial and time-evolving wave vectors. These equations can be solved analytically Moffatt (1967); Townsend (1976); Farrell and Ioannou (1993), and are used to exercise the linear parts of the code.


Fig. 15 shows the time-integrated relative error, , between the streamwise velocity in the present DNS and the corresponding RDT solution. Both in DNS and RDT, and . The initial condition is a sine wave, , with initial wavenumbers . In the DNS, the initial amplitude is , and the box aspect ratios are , so that the box always contains a single wavelength in the horizontal plane. The simulations run from to , by which time the magnitude of the vertical wavenumber reaches for . This is a typical minimum resolution in later turbulence simulations. Note that the cases in Fig. 15 imply run times of roughly 2 box periods, in spite of which the figure shows that the numerical scheme retains its third- and sixth-order consistency in time and space, respectively.
C.2 Initial shearing of isotropic flow
To validate the nonlinear terms of the code, the short-term shearing of an initially isotropic turbulent flow is compared with the classical results of Rogers and Moin, Rogers and Moin (1987) as given in the dataset HOM23 of the AGARD database, AGARD (1998) whose naming notation we use. The initial conditions are random isotropic fields with a top-hat one-dimensional energy spectrum, as in Ref. Rogallo, 1981, adjusted to the same parameters as in Ref. Rogers and Moin, 1987. They all agree well with the reference data, but the energy dissipation of our DNSes is slightly higher than in the reference cases after (see later Fig. 16b), probably because of the periodic loss of the enstrophy in the remeshing process of Rogallo’s Fourier code. Lee, Kim, and Moin (1990); Rogallo (1981) Note that the reference simulations in Ref. Rogers and Moin, 1987 were remeshed every . Other quantities, such as the two-point velocity correlation functions, were checked in detail against case HOM23U (Fig. 17). They also agree well, confirming that the large scales of the present DNS are consistent with those of the three-dimensional Fourier spectral simulations.
The previous results do not test the effect of dealiasing in , which is applied in Ref. Rogers and Moin, 1987 but not in our case. This is tested in Fig. 16 by comparing the results of simulating case HOM23U in its original grid with a much finer grid with . Fig. 16(a) shows the temporal evolution of the effective resolutions , where is the instantaneous Kolmogorov scale, and the maximum effective wavenumbers are and . Fig. 16(b) shows the evolution of the dissipation rate of the two simulations. The finer grid case has a slightly larger dissipation rate at around , but the agreement is excellent considering that the larger grid is at least twice as fine as the coarser one. As an added test, the coarser grid was run at CFLs from 0.05 to 0.6, but the results agree within the thickness of the lines in Fig. 16(b).
| Run | |||||||||||
|---|---|---|---|---|---|---|---|---|---|---|---|
| L11 | 2600 | 1.5 | 1.9 | 802 | 52.9 | 6.4 | 0.452 | 0.154 | 0.990 | 6.38 | |
| run2 | 2632 | 1.5 | 1.5 | 210 | 51.6 | 6.6 | 0.446 | 0.152 | 1.004 | ||
| M11 | 1.1 | 1.40 | 831 | 91.0 | 6.9 | 0.454 | 0.142 | 0.989 | 10.1 | ||
| run10 | 1.2 | 1.2 | 106 | 83.4 | 7.1 | 0.430 | 0.141 | 1.000 | 9.10 |
C.3 Statistically stationary homogeneous shear turbulence
Closer to the subject of this paper than any of the previous tests is the long-term behaviour of small computational boxes. It was shown in Ref. Pumir, 1996 that, under those circumstances, turbulence grows in size, fills the box, and collapses intermittently, while reaching a statistically steady state that resembles the bursting cycle of wall-bounded turbulence Jiménez (2013a); Jiménez et al. (2005). We will see below that a typical bursting period is , so that reasonable statistics require, depending on the box geometry, running times of the order of hundreds of box periods. In this section we test the ability of our code to run for long times by repeating two of the simulations in Ref. Pumir, 1996.
Both simulations run in a cubical box , and start from initially turbulent conditions. In each case, we accumulate statistics for , after discarding the initial . The energy input by action of the the shear on the stress, , balances the dissipation rate within 1%.
Table 3 compares our two simulations (L11 and M11) with those in Ref. Pumir, 1996. It includes both small- and large-scale quantities, which agree well. It is probably significant that the quantities that depend on the small scales, such as or , tend to be somewhat higher in our simulations than in Ref. Pumir, 1996. This is consistent with the loss of enstrophy in the spectral code due to remeshing, although the difference is too small to decide whether the reason in this particular case is numerical or statistical.
References
- Kaneda et al. (2003) Y. Kaneda, T. Ishihara, M. Yokokawa, K. Itakura, and A. Uno, “Energy dissipation rate and energy spectrum in high resolution direct numerical simulations of turbulence in a periodic box,” Phys. Fluids 15, L21–L24 (2003).
- Lozano-Durán and Jiménez (2014a) A. Lozano-Durán and J. Jiménez, “Effect of the computational domain on direct simulations of turbulent channels up to .” Phys. Fluids 26, 011702 (2014a).
- Bernardini, Pirozzoli, and Orlandi (2014) M. Bernardini, S. Pirozzoli, and P. Orlandi, “Velocity statistics in turbulent channel flow up to .” J. Fluid Mech. 742, 171–191 (2014).
- Rogers and Moin (1987) M. M. Rogers and P. Moin, “The structure of the vorticity field in homogeneous turbulent flows.” J. Fluid Mech. 176, 33–66 (1987).
- Lee, Kim, and Moin (1990) M. J. Lee, J. Kim, and P. Moin, “Structure of turbulence at high shear rates.” J. Fluid Mech. 216, 561–583 (1990).
- Jiménez (2013a) J. Jiménez, “Near-wall turbulence.” Phys. Fluids 25, 101302 (2013a).
- Jiménez and Moin (1991) J. Jiménez and P. Moin, “The minimal flow unit in near-wall turbulence,” J. Fluid Mech. 225, 213–240 (1991).
- Jiménez (1994) J. Jiménez, “On the structure and control of near wall turbulence,” Phys. Fluids 6, 944–953 (1994).
- Hamilton, Kim, and Waleffe (1995) J. M. Hamilton, J. Kim, and F. Waleffe, “Regeneration mechanisms of near-wall turbulence structures,” J. Fluid Mech. 287, 317–348 (1995).
- Waleffe (1997) F. Waleffe, “On a self-sustaining process in shear flows,” Phys. Fluids 9, 883–900 (1997).
- Kida and Tanaka (1994) S. Kida and M. Tanaka, “Dynamics of vortical structures in a homogeneous shear flow.” J. Fluid Mech. 274, 43–68 (1994).
- Tavoularis and Karnik (1989) S. Tavoularis and U. Karnik, “Further experiments on the evolution of turbulent stresses and scales in uniformly sheared turbulence.” J. Fluid Mech. 204, 457–478 (1989).
- Isaza and Collins (2009) J. C. Isaza and L. R. Collins, “On the asymptotic behaviour of large-scale turbulence in homogeneous shear flow,” J. Fluid Mech. 637, 213–239 (2009).
- Cambon and Scott (1999) C. Cambon and J. F. Scott, “Linear and nonlinear models of anisotropic turbulence,” Ann. Rev. Fluid Mech. 31, 1–53 (1999).
- Pumir (1996) A. Pumir, “Turbulence in homogeneous shear flows.” Phys. Fluids 8, 3112–3127 (1996).
- Jiménez et al. (2005) J. Jiménez, G. Kawahara, M. P. Simens, M. Nagata, and M. Shiba, “Characterization of near-wall turbulence in terms of equilibrium and ‘bursting’ solutions,” Phys. Fluids 17, 015105 (2005).
- Gualtieri et al. (2002) P. Gualtieri, C. M. Casciola, R. Benzi, G. Amati, and R. Piva, “Scaling laws and intermittency in homogeneous shear flow,” Phys. Fluids 14(2), 583–596 (2002).
- Rogallo (1981) R. S. Rogallo, “Numerical experiments in homogeneous turbulence,” Tech. Memo 81315 (NASA, 1981).
- Schumacher and Eckhardt (2000) J. Schumacher and B. Eckhardt, “On statistically stationary homogeneous shear turbulence,” Europhys. Lett. 52(6), 627–632 (2000).
- Horiuchi and Ozawa (2011) K. Horiuchi and T. Ozawa, “Multimode stretched spiral vortex and nonequilibrium energy spectrum in homogeneous shear flow turbulence.” Phys. Fluids 23, 035107 (2011).
- Brucker et al. (2007) K. A. Brucker, J. C. Isaza, T. Vaithianathan, and L. R. Collins, “Efficient algorithm for simulating homogeneous turbulent shear flow without remeshing,” J. Comput. Phys. 225, 20–32 (2007).
- Baron (1982) F. Baron, Macro-simulation tridimensionelle d’écoulements turbulents cisaillés, Ph.D. thesis, U. Pierre et Marie Curie (1982).
- Schumann (1985) U. Schumann, “Algorithms for direct numerical simulation of shear-periodic turbulence,” in Ninth Int. Conf. on Numerical Methods in Fluid Dyn., Lecture Notes in Physics, Vol. 218, edited by Soubbaramayer and J. Boujot (Springer Berlin Heidelberg, 1985) pp. 492–496.
- Gerz, Schumann, and Elghobashi (1989) T. Gerz, U. Schumann, and S. E. Elghobashi, “Direct numerical simulation of stratified homogeneous turbulent shear flows,” J. Fluid Mech. 200, 563–594 (1989).
- Balbus and Hawley (1998) S. A. Balbus and J. F. Hawley, “Instability, turbulence, and enhanced transport in accretion disks,” Rev. Mod. Phys. 70, 1–53 (1998).
- Johansen, Youdin, and Klahr (2009) A. Johansen, A. Youdin, and H. Klahr, “Zonal flows and long-lived axisymmetric pressure bumps in magnetorotational turbulence,” Astrophys. J. 697, 1269 (2009).
- Salhi et al. (2014) A. Salhi, F. G. Jacobitz, K. Schneider, and C. Cambon, “Nonlinear dynamics and anisotropic structure of rotating sheared turbulence,” Phys. Rev. E 89, 013020 (2014).
- Kim, Moin, and Moser. (1987) J. Kim, P. Moin, and R. D. Moser., “Turbulent statistics in fully developed channel flow at low Reynolds number.” J. Fluid Mech. 177, 133–166 (1987).
- (29) “See supplementary material at [url will be inserted by aip] for details of the numerical implementation, and validations of the code.” .
- Lele (1992) S. K. Lele, “Compact finite difference schemes with spectral-like resolution,” J. Comput. Phys. 103, 16–42 (1992).
- Spalart, Moser, and Rogers (1991) P. R. Spalart, R. D. Moser, and M. M. Rogers, “Spectral methods for the Navier-Stokes equations with one infinite and two periodic directions,” J. Comput. Phys. 96, 297–324 (1991).
- Corrsin (1958) S. Corrsin, “Local isotropy in turbulent shear flow,” NACA Research Memo. 58B11 (1958).
- Jiménez (2013b) J. Jiménez, “How linear is wall-bounded turbulence?” Phys. Fluids 25, 110814 (2013b).
- Moin (2001) P. Moin, Fundamentals of engineering numerical analysis (Cambridge U. Press, 2001).
- AGARD (1998) AGARD, ed., A selection of test cases for the validation of large-eddy simulations of turbulent flows, Advisory Rep. No. 345 (1998) http://torroja.dmt.upm.es/ftp/AGARD.
- Gualtieri et al. (2007) P. Gualtieri, C. M. Casciola, R. Benzi, and R. Piva, “Preservation of statistical properties in large-eddy simulation of shear turbulence,” J. Fluid Mech. 592, 471–494 (2007).
- Jiménez et al. (1993) J. Jiménez, A. A. Wray, P. G. Saffman, and R. S. Rogallo, “The structure of intense vorticity in isotropic turbulence,” J. Fluid Mech. 255, 65–90 (1993).
- Flores and Jiménez (2010) O. Flores and J. Jiménez, “Hierarchy of minimal flow units in the logarithmic layer.” Phys. Fluids 22, 071704 (2010).
- Hoyas and Jiménez (2006) S. Hoyas and J. Jiménez, “Scaling of the velocity fluctuations in turbulent channels up to = 2003,” Phys. Fluids 18, 011702 (2006).
- Toh and Itano (2005) S. Toh and T. Itano, “Interaction between a large-scale structure and near-wall structures in channel flow.” J. Fluid Mech. 524, 249–262 (2005).
- Sillero, Jiménez, and Moser (2014) J. Sillero, J. Jiménez, and R. Moser, “Two-point statistics for turbulent boundary layers and channels at Reynolds numbers up to ,” Phys. Fluids 26, 105109 (2014).
- Waleffe (2003) F. Waleffe, “Homotopy of exact coherent structures in plane shear flows.” Phys. Fluids 15, 1517–1534 (2003).
- Lozano-Durán, Flores, and Jiménez (2012) A. Lozano-Durán, O. Flores, and J. Jiménez, “The three-dimensional structure of momentum transfer in turbulent channels,” J. Fluid Mech. 694, 100–130 (2012).
- Orr (1907) W. M. Orr, “The stability or instability of the steady motions of a perfect liquid and of a viscous liquid. Part I: a perfect liquid.” Proc. R. Irish Acad. A 27, 9–68 (1907).
- Umurhan and Regev (2004) O. Umurhan and O. Regev, “Hydrodynamic stability of rotationally supported flows: Linear and nonlinear 2D shearing box results.” Astr. Astrophys. 427, 855–872 (2004).
- Jiménez (2007) J. Jiménez, “Simulation of homogeneous and inhomogeneous shear turbulence,” in CTR Ann. Res. Briefs (Stanford Univ., 2007) pp. 367–378.
- Moffatt (1967) H. K. Moffatt, “Interaction of turbulence with strong wind shear,” in Atmospheric Turbulence and Radio Wave Propagation, edited by A. M. Yaglom and V. I. Tatarski (Nauka, Moscow, 1967) pp. 139–156.
- Townsend (1976) A. A. Townsend, The Structure of Turbulent Shear Flows, 2nd ed. (Cambridge U. Press, 1976).
- Jiménez (2015) J. Jiménez, “Direct detection of linearized bursts in turbulence,” Phys. Fluids 27, 065102 (2015).
- Pope (2000) S. B. Pope, Turbulent flows (Cambridge U. Press, 2000).
- del Álamo and Jiménez (2004) J. del Álamo and J. Jiménez, “Scaling of the energy spectra of turbulent channels,” J. Fluid Mech. 500, 135–144 (2004).
- Sarkar (1995) S. Sarkar, “The stabilizing effect of compressibility in turbulent shear flow.” J. Fluid Mech. 282, 163–186 (1995).
- Lozano-Durán and Jiménez (2014b) A. Lozano-Durán and J. Jiménez, “Time-resolved evolution of coherent structures in turbulent channels: characterization of eddies and cascades,” J. Fluid Mech. 759, 432–471 (2014b).
- Schmid (2007) P. J. Schmid, “Nonmodal stability theory,” Ann. Rev. Fluid Mech. 39, 129–162 (2007).
- Farrell and Ioannou (1993) B. F. Farrell and P. J. Ioannou, “Optimal excitation of three-dimensional perturbations in viscous constant shear flow,” Phys. Fluids A 5, 1390–1400 (1993).
- Lumley (1979) J. L. Lumley, “Computational models of turbulent flows,” Adv. Appl. Mech. 18, 123–176 (1979).