The Fundamental Plane of the Broad-line Region in Active Galactic Nuclei
Abstract
Broad emission lines in active galactic nuclei (AGNs) mainly arise from gas photoionized by continuum radiation from an accretion disk around a central black hole. The shape of the broad-line profile, described by , the ratio of full width at half maximum to the dispersion of broad H, reflects the dynamics of the broad-line region (BLR) and correlates with the dimensionless accretion rate () or Eddington ratio (). At the same time, and correlate with , the ratio of optical Fe ii to H line flux emission. Assembling all AGNs with reverberation mapping measurements of broad H, both from the literature and from new observations reported here, we find a strong bivariate correlation of the form where , and . We refer to this as the fundamental plane of the BLR. We apply the plane to a sample of quasars to demonstrate the prevalence of super-Eddington accreting AGNs are quite common at low redshifts.
Subject headings:
black holes: accretion – galaxies: active – galaxies: nuclei1. Introduction
Broad emission lines are a hallmark feature of type 1 active galactic nuclei (AGNs) and quasars (Osterbrock & Mathews, 1986). As pervasive as they are, many basic properties of the broad-line region (BLR), such as its basic geometry, dynamics, and physical connection to the accretion disk around the supermassive black hole (BH), remain ill-defined. AGN spectra exhibit both tremendous diversity as well as discernable patterns of systematic regularity. Principal component analysis has isolated several dominant relationships among emission-line properties (Boroson & Green, 1992; Sulentic et al., 2000). The main varying trend of those properties, which is so-called Eigenvector 1 (EV1), has been demonstrated to be driven by Eddington ratios, , where is the bolometric luminosity and the Eddington luminosity (Boroson & Green, 1992; Sulentic et al., 2000; Shen & Ho, 2014). As one of the most prominent variables in EV1, the relative strength of broad optical Fe ii emission, expressed as
| (1) |
may correlate with . Sources with high Eddington ratios (accretion rates), for instance so-called narrow-line Seyfert 1 galaxies (Osterbrock & Pogge, 1985), emit exceptionally strong Fe ii lines compared with the normal ones (Boroson & Green, 1992; Hu et al., 2008; Dong et al., 2011). However, the underlying physical mechanism that controls remains unclear, as the formation of Fe ii is very complex (e.g., Baldwin et al. 2004). It may be influenced by different hydrogen density of BLR gas (Verner et al., 2004), or diverse contribution from microturbulence (Baldwin et al., 2004). In addition, Fe ii lags are generally longer by a factor of a few than H in broad-line Seyfert 1 galaxies (Barth et al., 2013; Chelouche et al., 2014) and roughly equal to H lags in narrow-line Seyfert 1s (Hu et al., 2015), implying the potential connection of with the distribution or structure of line-emitting gas. The correlation indicates that Eddington ratios probably regulate all above mentioned properties of BLR. It should be noted that also correlates with some other properties like X-ray spectral slopes (e.g., Wang et al. 1996; Laor et al. 1997; Sulentic et al. 2000), but it likely originates from relation of those properties and Eddington ratios (e.g., Wang et al. 2004; Risaliti et al. 2009; Shemmer et al. 2006; Brightman et al. 2013).
The overall breadth of the broad emission lines, notably H, reflects both the virial velocity and inclination of the BLR (Kollatschny & Zetzl, 2011; Shen & Ho, 2014). The shape of the line profile may encode more information on the detailed dynamics of the BLR (e.g., Collin et al. 2006; Kollatschny & Zetzl 2011), which itself may depend on fundamental properties such as the accretion or outflow rate. The broad H lines of NLS1s tend to have more sharply peaked (Lorentzian) profiles compared to type 1 AGNs with more normal Eddington ratios (Véron-Cetty et al., 2001; Zamfir et al., 2010). As a non-parametric description of the line profile, one can define
| (2) |
where is the dispersion (second moment) of the H line. The value of is 2.35, 3.46, 2.45, 2.83 and 0 for a Gaussian, a rectangular, a triangular, an edge-on rotating ring, and a Lorentzian profiles (for a pure Lorentzian profile and thus ), respectively (e.g., Collin et al. 2006). The quantity correlates loosely with Eddington ratio (Collin et al., 2006) and, as the ratio of the rotational and turbulent components of the line-emitting clouds (Kollatschny & Zetzl, 2011), gives a simple, convenient parameter that may be related to the dynamics of the BLR.
While and each correlates separately with Eddington ratio, we demonstrate that both and combined correlate even more tightly with Eddington ratio (and dimensionless accretion rate). This bivariate relation, which we call the “fundamental plane”111Borrowing the terminology from galaxy formation (e.g., Djorgovski & Davis 1987) and accreting BHs (e.g., Merloni et al. 2003) of the BLR links two direct observables, plausibly related to the structure and dynamics of the BLR, with the dimensionless accretion rate. Applying the BLR fundamental plane to a large sample of Sloan Digital Sky Survey (SDSS) quasars, we find that a large fraction of quasars at have super-Eddington accretion rates.
| Objects | FWHM | Ref. | ||||||
|---|---|---|---|---|---|---|---|---|
| ( | () | () | ||||||
| Mrk 335 | 1, 2, 3, 4 | |||||||
| 4, 5, 6a | ||||||||
| 4, 5, 6a | ||||||||
| 4, 7a | ||||||||
| … | … | 4 | ||||||
| PG 0026+129 | 4, 5, 8a | |||||||
| PG 0052+251 | 4, 5, 8a |
Note. — All the values of , and are compiled from Du et al. (2015). Values in boldface are the weighted averages of all the measurements for this object.
Ref.: (1) Du et al. 2014; (2) Wang et al. 2014; (3) Hu et al. 2015; (4) Du et al. 2015; (5) Collin et al. 2006; (6) Peterson et al. 1998; (7) Grier et al. 2012; (8) Kaspi et al. 2000.
The superscript for references indicates that is measured in this paper; indicates that FWHM and are measured from SDSS spectra (the H width of SEAMBHs is significantly broadened by the 5′′ longslit of our campaign; see details in Ref. 4); means the MCMC BH mass is used (see Section 2.2); means that is taken from the latest measurements in Kollatschny & Zetzl (2011). NGC 5548 marked with is measured from its mean annual spectra in the AGN watch database; the average value is provided here. We first calculate for each measurement, and then average. In the main text, we use these averaged numbers for the objects with multiple RM measurements (treated as one point in all figures). For NGC 7469, which was mapped twice Collier et al. (1998) and Peterson et al. (2014), the H lags are not very different but the H FWHM is very different; take the values of FWHM measured by Kollatschny & Zetzl (2011). NGC 4051 and PG 1700+518 have very small values of in Ref. 5, but Kollatschny & Zetzl (2011) provides new measurements, which are used here.
This table is available in its entirety in a machine-readable form in the online journal. A portion is shown here for guidance regarding its form and content.
2. Measurements
2.1. The Reverberation-mapped AGN sample
We select all AGNs with reverberation mapping (RM) data (here only broad H line), which yield robust BH mass estimates needed for our analysis. All RM AGNs before 2013 are summarized by Bentz et al. (2013). We took all of 41 AGNs from Bentz et al. (2013). Three additional sources (Mrk 1511, NGC 5273, KA1858+4850) were subsequently published. Our project to search for super-Eddington accreting massive black holes (SEAMBHs) has monitored about 25 candidates and successfully measured H lags () in 14 AGNs to date (Du et al., 2015) and other five objects monitored between 2014-2015 (to be submitted). We measure Fe ii using the same approach as Hu et al. (2008) and Hu et al. (2015). For reverberation-mapped AGNs without published measurements of Fe ii and H flux, we fit the mean spectra from the monitoring campaigns, using the fitting scheme described in Hu et al. (2015). In short, the spectrum is fitted with several components simultaneously: (1) a power law for continuum, (2) Fe ii template from Boroson & Green (1992), (3) host galaxy template if necessary, (4) broad H, (5) broad He ii emission line, and (6) several Gaussians for narrow lines such as [O iii] 4959, 5007. The flux of broad optical Fe ii is measured by integration from 4434 Å to 4684 Å. Table 1 lists the 63 RM AGNs we consider, along with the BH mass, 5100 Å luminosity, dimensionless accretion rate, FWHM, , and data sources.
The sample covers a wide range of accretion rates, , from the regime of a Shakura & Sunyaev (1973) standard disk to a slim disk (Abramowicz et al., 1988). We take from the published literature if available; otherwise, we measure it from the averaged spectra following the spectral fitting scheme of Hu et al. (2008, 2015). As the variability of H is unusually much larger than that of Fe ii in sub-Eddington AGNs, the uncertainties of are mainly governed by H variability, which on average is %.
2.2. Accretion rates and Eddington ratios
We derived accretion rates from the disk model of Shakura & Sunyaev (1973), which has been extensively applied to fit the spectra of quasars and Seyfert 1 galaxies (Czerny & Elvis, 1987; Sun & Malkan, 1989; Laor & Netzer, 1989; Collin et al., 2002; Brocksopp et al., 2006; Kishimoto et al., 2008; Davis & Laor, 2011; Capellupo et al., 2015). The effective temperature distribution is given by K, where , is mass accretion rates, , and cm (Frank et al., 2002). Here the effect of the inner boundary is neglected because the region emitting optical radiation is far from the boundary. Introducing , we have the spectral luminosity by integrating over the entire disk,
| (3) |
where is the disk inclination relative to the observer and Hz. Since long-wavelength photons are radiated from large disk radii, the integral term in Equation (3) can be well approximated by 1.93 for (Davis & Laor, 2011). We thus have , and the dimensionless accretion rate222The applicability of Eq. (4) to SEAMBHs can be justified by the self-similar solution of slim disks (Wang et al., 1999; Wang & Zhou, 1999). The solution shows that the 5100 Å photons are emitted from , and the photon trapping radius , where is the Schwartzschild radius. Eq. (4) holds provided that , or . No SEAMBH so far has exceeded this limit.
| (4) |
where is the 5100 Å luminosity in units of . This convenient expression can easily convert luminosity and BH mass into dimensionless accretion rates. In this paper, we take an average value of , which corresponds to the opening angle of the dusty torus (e.g., Davis & Laor 2011; Du et al. 2015). The uncertainties of due to () are from Equation (4), where we took . This uncertainty is significantly smaller than the average error bars of (), and is thus neglected.
The dimensionless accretion rate is related to the more widely used Eddington ratio via , where is the radiative efficiency, and (Kaspi et al., 2000). The uncertainties of Eddington ratios result from the fact that the bolometric correction depends on both accretion rates and BH mass (Jin et al., 2012). In our following discussion, we will use both and .
3. Fundamental plane of the BLR
3.1. Correlations
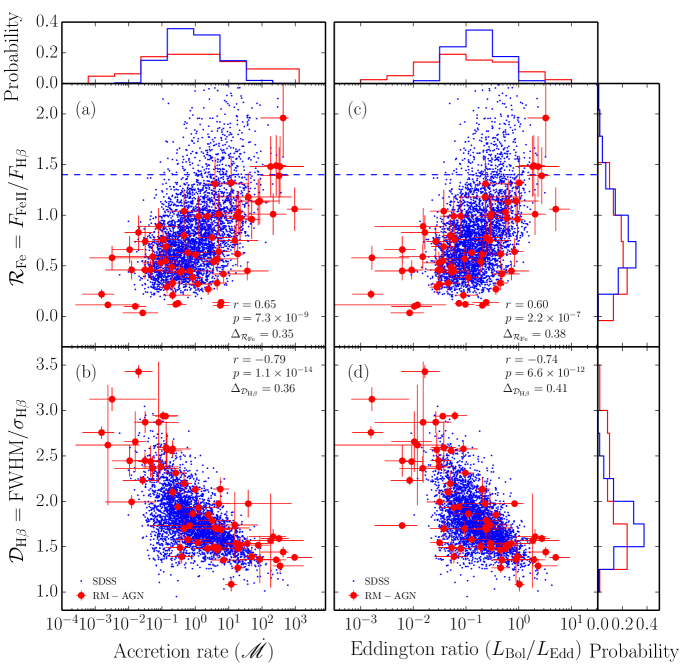
Figure 1a and 1c show the plots and yield the following correlations:
| (5) |
We define the scatter of a correlation as , where is the number of objects, and represents , , , or . The Pearson’s correlation coefficient (), null-probability (), and scatters are indicated in the plots. By comparing in panels (a) and (c), we find that the correlation is slightly stronger than that of . In high- AGNs, both H and continuum variability are significantly smaller than those in sub-Eddington AGNs. On the other hand, Fe ii reverberates in a very similarly fashion to H with respect to the continuum (Hu et al., 2015). Indeed, it can be seen that the scatter of the correlation gets larger with decreasing or . The correlations supports the idea that Fe ii strength is not governed by metallicity but by the ionizing flux and hydrogen density (Verner et al., 2004).
We plot the relations in Figure 1b and 1d and find
| (6) |
The above two correlations are similar, but the former is slightly stronger than the latter. Collin et al. (2006) also found a correlation between and (see their Figure 6), but their results are much weaker than ours. This is mainly due to the lack of high AGNs in their sample. We would like to emphasize that the correlations cannot be an artifact of the inclusion of FWHM in . For a constant of RM AGNs, the accretion rates span over about 5 dex whereas luminosities span over 4.5; however, the relation has a scatter of only . The correlations are intrinsic.
Figure 1 also shows, as background, the SDSS DR5 sample of Hu et al. (2008). The sample comprises 4037 quasars with criteria of S/N and EW(Fe ii) Å (this excludes Fe ii-weak quasars). BH masses assume and a standard relation333 This is an empirical relation between the BLR size and the continuum. From the recent work of Bentz et al. (2013), it has the form ltd. However, Du et al. (2015) found that it only applies to sub-Eddington AGNs; it depends on for super-Eddington AGNs. We do not consider the dependence of the relation on for the SDSS sample in this paper.. The RM AGNs overlap very well with the SDSS sample, on both the and the plots. We note that among the mapped AGNs there is a small population (; Figure 1a and c) of AGNs with of what appear to be super-Eddington sources. Their values of are likely underestimated because their black hole masses were estimated using the standard relation.
3.2. Fundamental Plane
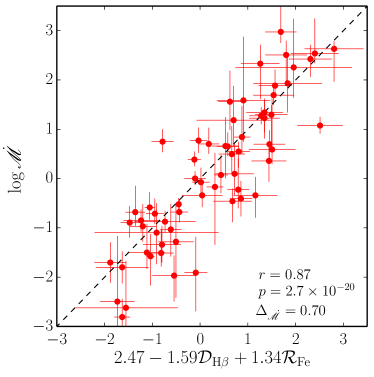
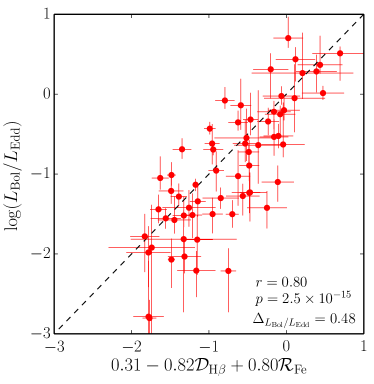
The relations reflect connections between the BLR structure and dynamics with BH accretion. We investigate whether these two univariate correlations can be unified into a single bivariate correlation of the form
| (7) |
where are coefficients to be determined by data (). We define
| (8) |
where , and are the error bars of , , and of the th object, respectively. Minimizing , we obtain
The error bars of are derived from bootstrap simulations. The bivariate correlations, plotted in Figure 2, are much stronger than individual corrections of Figure 1 (see the correlation coefficients and null-probability). We call these new correlations as the fundamental plane of the BLR.
The implications of Equation (7) are exciting. From two simple measurements of a single-epoch spectrum of a quasar—strength of Fe ii and shape of broad H—we can deduce the status of its accretion flow. This can be very useful when applied to large samples of quasars to investigate the cosmological growth of BHs. Our method can be usefully applied to quasars with suitable spectroscopy in the rest-frame H region, for which the strength of Fe ii can be measured or constrained.
3.3. Application to SDSS sample
We apply the plane (Equation 7) to a sample of 4037 objects Hu et al. (2008), which were selected from the SDSS DR5 sample composed of quasars with . We calculate fractions of quasars with , , where is the number of quasars and is the critical accretion rate in question. For objects with , we find . Similarly, we have and . These numbers show that super-Eddington accreting AGNs are quite common in the Universe at . We should note that these fractions are lower limits, as a result of the selection criteria imposed by Hu et al. Detailed results of the application of our technique to the latest sample of SDSS quasars will be carried out in a separate paper.
4. Conclusions
This paper studies correlations among three dimensionless AGN parameters: accretion rate (or Eddington ratio), shape of the broad H line, and flux ratio of optical Fe ii to H. A strong correlation among them is found, which we denote as the fundamental plane of AGN BLRs (Equation 7). The BLR fundamental plane enables us to conveniently explore the accretion status of the AGN central engine using single-epoch spectra, opening up many interesting avenues for exploring AGNs, including their cosmological evolution. A simple application of the BLR fundamental plane shows that super-Eddington accreting AGNs are quite common in among low-redshift quasars.
References
- Abramowicz et al. (1988) Abramowicz, M. A., Czerny, B., Lasota, J.-P., & Szuszkiewicz, E. 1988, ApJ, 332, 646
- Baldwin et al. (2004) Baldwin, J. A., Ferland, G. J., Korista, K. T., Hamann, F., & LaCluyzé, A. 2004, ApJ, 615, 610
- Barth et al. (2013) Barth, A. J., Pancoast, A., Bennert, V. N. et al. 2013, ApJ, 769, 128
- Bentz et al. (2013) Bentz, M. C., Denney, K. D., Grier, C. J., et al. 2013, ApJ, 767, 149
- Brightman et al. (2013) Brightman, M., Silverman, J. D., Mainieri, V., et al. 2013, MNRAS, 433, 2485
- Brocksopp et al. (2006) Brocksopp, C., Starling, R. L. C., Schady, P., et al. 2006, MNRAS, 366, 953
- Boroson & Green (1992) Boroson, T. A., & Green, R. F. 1992, ApJS, 80, 109
- Capellupo et al. (2015) Capellupo, D. M., Netzer, H., Lira, P. et al., 2015, MNRAS, 446, 3427
- Chelouche et al. (2014) Chelouche, D., Rafter, S. E., Cotlier, G. I. & Barth, A. J. 2014, ApJ, 783, L34
- Collier et al. (1998) Collier, S. J., Horne, K., Kapsi, S., et al. 1998, ApJ, 500, 162
- Collin et al. (2002) Collin, S., Boisson, C., Mouchet, M., et al. 2002, A&A, 388, 771
- Collin et al. (2006) Collin, S., Kawaguchi, T., Peterson, B. M., & Vestergaard, M. 2006, A&A, 456, 75
- Czerny & Elvis (1987) Czerny, B., & Elvis, M. 1987, ApJ, 321, 305
- Davis & Laor (2011) Davis, S. W. & Laor, A. 2011, ApJ, 728, 98
- Djorgovski & Davis (1987) Djorgovski, S., & Davis, M. 1987, ApJ, 313, 59
- Dong et al. (2011) Dong, X.-B., Wang, J.-G., Ho, L. C., et al. 2011, ApJ, 736, 86
- Du et al. (2014) Du, P., Hu, C., Lu, K.-X., et al. 2014, ApJ, 782, 45
- Du et al. (2015) Du, P., Hu, C., Lu, K.-X., et al. 2015, ApJ, 806, 22
- Frank et al. (2002) Frank, J., King, A. R., & Raine, D. J. 2002, Accretion Power in Astrophysics: Third Edition (Cambridge: Cambridge Univ. Press)
- Grier et al. (2012) Grier, C. J., Peterson, B. M., Pogge, R. W., et al. 2012, ApJ, 755, 60
- Ho & Kim (2014) Ho, L. C. & Kim, M. 2014, ApJ, 789, 17
- Hu et al. (2015) Hu, C., Du, P., Lu, K.-X., et al. 2015, ApJ, 804, 138
- Hu et al. (2008) Hu, C., Wang, J.-M., & Ho, L. C. et al. 2008, ApJ, 687, 78
- Jin et al. (2012) Jin, C., Ward, M., & Done, C. 2012, MNRAS, 425, 907
- Kaspi et al. (2000) Kaspi, S., Smith, P. S., Netzer, H., et al. 2000, ApJ, 533, 631
- Kishimoto et al. (2008) Kishimoto M., Antonucci R., Blaes O., et al. 2008, Nature, 454, 492
- Kollatschny & Zetzl (2011) Kollatschny, W., & Zetzl, M. 2011, Nature, 470, 366
- Laor & Netzer (1989) Laor, A. & Netzer, H. 1989, MNRAS, 238, 897
- Laor et al. (1997) Laor, A., Fiore, F., Elvis, M., Wilkes, B. J., & McDowell, J. C. 1997, ApJ, 477, 93
- Merloni et al. (2003) Merloni, A., Heinz, S., & di Matteo, T. 2003, MNRAS, 345, 1057
- Onken et al. (2004) Onken, C. A., Ferrarese, L., Merritt, D., et al. 2004, ApJ, 615, 645
- Osterbrock & Mathews (1986) Osterbrock, D. E., & Mathews, W. G. 1986, ARA&A, 24, 171
- Osterbrock & Pogge (1985) Osterbrock, D. E., & Pogge, R. W. 1985, ApJ, 297, 166
- Peterson et al. (2014) Peterson, B. M., Grier, C. J., Horne, K., et al. 2014, ApJ, 795, 149
- Peterson et al. (1998) Peterson, B. M., Wanders, I., Bertram, R., et al. 1998, ApJ, 501, 82
- Risaliti et al. (2009) Risaliti, G., Young, M., & Elvis, M. 2009, ApJL, 700, L6
- Shakura & Sunyaev (1973) Shakura, N. I., & Sunyaev, R. A. 1973, A&A, 24, 337
- Shemmer et al. (2006) Shemmer, O., Brandt, W. N., Netzer, H., Maiolino, R., & Kaspi, S. 2006, ApJL, 646, L29
- Shen & Ho (2014) Shen, Y. & Ho, L. C. 2014, Nature, 513, 210
- Sulentic et al. (2000) Sulentic, J. W., Marziani, P., & Dultzin-Hacyan, D. 2000, ARA&A, 38, 521
- Sun & Malkan (1989) Sun, W.-H., & Malkan, M. A. 1989, ApJ, 346, 68
- Verner et al. (2004) Verner, E., Bruhweiler, F., Verner, D., et al. 2004, ApJ, 611, 780
- Véron-Cetty et al. (2001) Véron-Cetty, M.-P., Véron, P., & Gonçalves, A. C. 2001, A&A, 372, 730
- Wang et al. (2004) Wang, J.-M., Watarai, K. & Mineshige, S. 2004, ApJL, 607, L107
- Wang et al. (2014) Wang, J.-M., Du, P., Hu, C., et al. 2014a, ApJ, 793, 108
- Wang et al. (1999) Wang, J.-M., Szuszkiewicz, E., Lu, F.-J., & Zhou, Y.-Y. 1999, ApJ, 522, 839
- Wang & Zhou (1999) Wang, J.-M., & Zhou, Y.-Y. 1999, ApJ, 516, 420
- Wang et al. (1996) Wang, T., Brinkmann, W., & Bergeron, J. 1996, A&A, 309, 81
- Zamfir et al. (2010) Zamfir, S., Sulentic, J. W., Marziani, P., & Dultzin, D. 2010, MNRAS, 403, 1759