Quantitative scaling of magnetic avalanches
Abstract
We provide the first quantitative comparison between Barkhausen noise experiments and recent predictions from the theory of avalanches for pinned interfaces, both in and beyond mean-field. We study different classes of soft magnetic materials: polycrystals and amorphous samples, characterized by long-range and short-range elasticity, respectively; both for thick and thin samples, i.e. with and without eddy currents. The temporal avalanche shape at fixed size, and observables related to the joint distribution of sizes and durations are analyzed in detail. Both long-range and short-range samples with no eddy currents are fitted extremely well by the theoretical predictions. In particular, the short-range samples provide the first reliable test of the theory beyond mean-field. The thick samples show systematic deviations from the scaling theory, providing unambiguous signatures for the presence of eddy currents.
pacs:
89.75.Da, 75.60.Ej, 75.60.Ch, 75.70.AkBarkhausen noise in soft magnets originates from the jerky motion of magnetic domain walls (DWs), and is characterized by scale-free power-law distributions of magnetization jumps BAR-19 ; UrbachMadisonMarkert1995 ; KimChoeShin2003 ; RepainBauerJametFerreMouginChappertBernas2004 ; DUR-06 ; PapanikolaouBohnSommerDurinZapperiSethna2011 . It is the earliest and most scrutinized probe for avalanche motion, an ubiquitous phenomenon present in other systems such as fluid contact-line depinning LeDoussalWieseMoulinetRolley2009 ; MoulinetGuthmannRolley2002 , brittle fracture fronts BonamySantucciPonson2008 ; LaursonIllaSantucciTallakstadyAlava2013 , and pinned vortex lines SHA-15 . In all these systems the motion of an overdamped elastic interface (of internal dimension ) driven in a quenched medium was proposed as an efficient mesoscopic description. However, until now, analytical predictions, allowing for a detailed comparison with experiments, have been scarce, due to the difficulty in treating collective discontinuous jumps in presence of many metastable states.
Toy models have thus been developed, capturing essential features at the level of mean-field (MF). One celebrated example is the ABBM model, where the domain wall is modeled as a single point in an “effective” random force landscape performing a (biased) Brownian motion AlessandroBeatriceBertottiMontorsi1990 ; AlessandroBeatriceBertottiMontorsi1990b ; Colaiori2008 . Refinements based on infinite-range models were later proposed DSFisher1998 , leading to similar physics ZapperiCizeauDurinStanley1998 ; Colaiori2008 . These MF toy models predict an avalanche-size distribution with and a duration distribution with .
The theory of interface depinning provides a predictive universal framework for the avalanche statistics. It involves two independent exponents, the roughness exponent and the dynamical exponent . The distribution exponents and were conjectured from scaling, as in the Narayan-Fisher (NF) conjecture and , where describes the range of interactions. The upper-critical dimension at which and below which mean-field models fail is for short-range elasticity (SR, ) and for long-range elasticity (LR, ) ZapperiCizeauDurinStanley1998 .
In Barkhausen noise experiments, two distinct families of samples were identified, consistent with these predictions DurinZapperi2000 . In polycrystaline materials, the DW experiences strong anisotropic crystal fields leading to LR elasticity. In the geometry this system behaves according to MF theory. In amorphous samples, SR elasticity prevails over a negligible LR elasticity, and the avalanche exponents agree with the NF prediction. In both cases, a relevant role is played by the demagnetizing field, which acts as a cutoff for large avalanches DurinZapperi2000 . These mean-field predictions were tested in soft magnetic thin films, where the retarding effects of eddy currents (ECs) of bulk samples are negligible PapanikolaouBohnSommerDurinZapperiSethna2011 .
Recently, it became possible to compare theory and experiments of avalanches well beyond scaling and the value of exponents. On the theoretical side, the functional renormalization group of depinning was extended to calculate a host of avalanche observables LeDoussalWiese2008c ; RossoLeDoussalWiese2009a ; LeDoussalWiese2011a ; DobrinevskiLeDoussalWiese2011b ; LeDoussalWiese2012a ; DobrinevskiLeDoussalWiese2014a . Examples are the avalanche shape at fixed size and duration, the joint size distribution, both in mean-field and beyond, even including retardation effects due to eddy currents DobrinevskiLeDoussalWiese2013 . On the experimental side, the avalanche shape was studied in magnetic systems PapanikolaouBohnSommerDurinZapperiSethna2011 ; ZAP-05 , in fracture and imbibition LAU-13 . Despite these experiments, most of the recent predictions of the theory have not yet been tested quantitatively, especially not to high accuracy.
The aim of this Letter is to provide new and sensitive tests of these theoretical predictions in soft ferromagnets. This is possible since in our Barkhausen experiment we detected a high number of avalanches, getting a robust statistics. Diverse magnetic samples have been explored, corresponding to the two universality classes (LR and SR), with and without EC effects. We focus our attention on the avalanche shape at fixed size, and observables linked to the joint distribution of sizes and durations. The SR and LR samples with no ECs fit extremely well with the theoretical predictions. In particular, the SR samples for the first time provide a significant test of the theory beyond mean-field. The effect of eddy currents on the scaling properties is also investigated.
We start by presenting the predictions from the theory of elastic interfaces that we aim to test LeDoussalWiese2011a ; LeDoussalWiese2012a ; DobrinevskiLeDoussalWiese2011b ; DobrinevskiLeDoussalWiese2014a . These predictions are calculated for avalanches following an infinitesimal increase in the field (kick). They also apply to the stationary, quasi-static regime in the limit of slow driving, as performed in experiments LeDoussalWiese2012a . The interface model involves a (small) mass , which flattens the interface beyond the scale , playing the same role as the demagnetizing field in setting the cutoff scale. Associated to the two independent exponents and are two independent scales and , for sizes and durations. The size scale can be directly measured in the experiments as
| (1) |
where denotes expectation values w.r.t. . On the other hand, the time scale cannot be determined analytically, and has to be guessed from data, as we explain later. We denote by the displacement field of the interface, and by the time derivative of the total swept area. The avalanche size is .
The simplest observables we can consider are the moments of the average size at fixed duration
| (2) |
whose universal behavior for small avalanches defines the exponent . Here, is the rescaled avalanche duration. In mean field, one finds
| (3) |
and the scaling functions are
| (4) | |||||
Beyond mean-field, one finds
| (5) |
where the expression for has been calculated to first order in . This leads to for , as in the case of and ().
Another observable of interest is the averaged avalanche duration at fixed size. In mean field, it is given by
| (6) |
which is consistent with the general expected scaling , with . Remarkably, within mean-field, Eq. (6) holds for any value of the ratio .
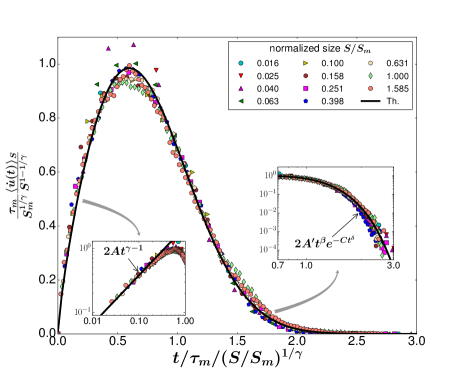
Let us now consider the average temporal avalanche shape at fixed size, , which takes the form
| (7) |
where is a universal scaling function, and . In mean field, is independent of DobrinevskiLeDoussalWiese2013 and reads
| (8) |
Beyond MF, the function has been obtained to for SR elasticity. Here, we use the convenient form
| (9) |
where the function is displayed in Eq. (34) of Ref. DobrinevskiLeDoussalWiese2014a and chosen s.t. , an approximation exact to . Eq. (9) has asymptotic behaviors
| (10) | ||||
| (11) |
with , , , , and .
To compare these theoretical predictions to our experimental results, we first need to make use of dimensionless units, thus rescaling sizes and durations by and , respectively. The parameter is analytically defined by Eq. (1); we tested that it leads to a consistent comparison of the measured size distribution with the theory, see Supplemental Material unp . In particular, we verified that the cutoff occurs at , as predicted. On the other hand, can only be inferred using (i) the expression of Eqs. (2) and (6); and (ii) the data of the average shape . In absence of ECs, the estimation of is made by matching both kind of data with the analytical expressions, giving a consistent and robust estimation of the parameter tau_m . In presence of ECs, we use the procedure (i) to estimate .
We analysed the avalanche statistics in different classes of materials. Two of them are thin films with negligible eddy current effects: a LR polycrystalline Ni81Fe19 Permalloy (Py) with a thickness of nm (s) and a SR amorphous Fe75Si15B10 (FeSiB) alloy, with a thickness of nm (s) BOH-14 ; BOH-13 . The other two samples are ribbons with a thickness of about m, where eddy current retarding effects are well known: a LR polycristalline FeSi alloy with Si=%, ( ms), and a SR amorphous Fe64Co21B15 (FeCoB) alloy, measured under a small tensile stress of MPa ( ms) DurinZapperi2000 ; DUR-06 . All samples have a space dimension ; the two LR materials show MF exponents, while the other ones have NF exponents, with . Further details on the samples and the experiments are given in the Supplemental Material unp .
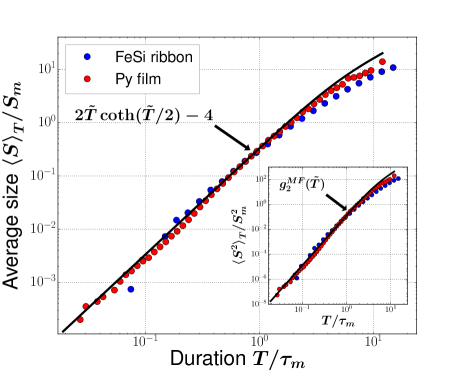
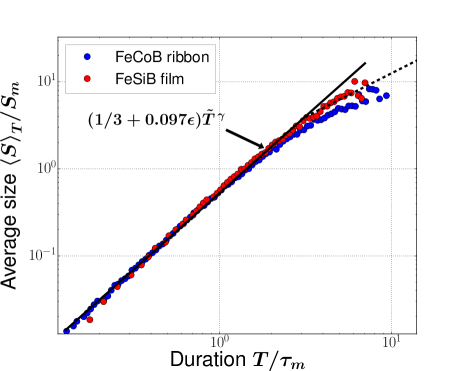
Figures 1 and 2 report the average size as a function of avalanche duration for LR and SR samples, respectively, compared to the theoretical prediction of Eqs. (4) and (5). In the absence of eddy currents, the correspondence is almost perfect, except for the highest values. For LR samples (Fig. 1), the mean-field prediction (4) crosses over from to at large avalanche sizes, a trend which seems to agree with our data. It is often argued that a linear dependence can also arise from the superposition of a multiplicity of active DWs. Indeed some of the largest avalanches are a superposition of smaller avalanches occurring in different parts of the sample, triggered by the relatively large change of the magnetization WHI-03 . Furthermore, the retarding effect of eddy currents makes large avalanches (say, for ) even longer, so that the average size further deviates from the theoretical prediction, especially in samples with more EC, as seen from Fig. 1. Note that the agreement with the MF predictions is also quite good at the level of fluctuations (i.e. the second moment in the inset of Fig. 1). For the SR samples in Fig. 2, we plot the prediction for small , in good agreement with the data up to the size cutoff , i.e. . At large we expect a similar bending to a linear behavior, although there are presently no detailed predictions for the crossover.
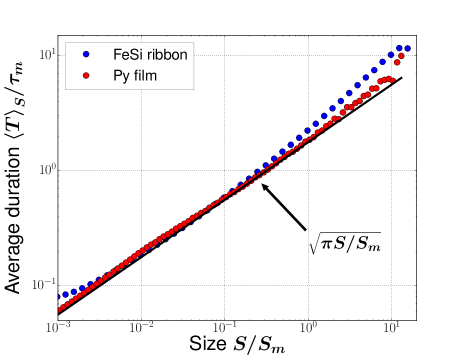
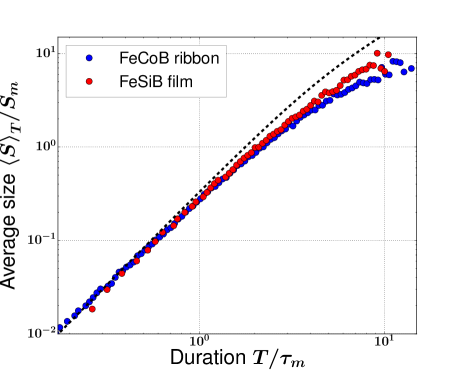
The mean avalanche duration at fixed size, , is shown in Fig. 3 for LR samples. For the film, it shows an almost perfect agreement with the MF prediction of Eq. (6), indicating that ECs are indeed negligible, while the effect of ECs is clearly visible in the ribbon.
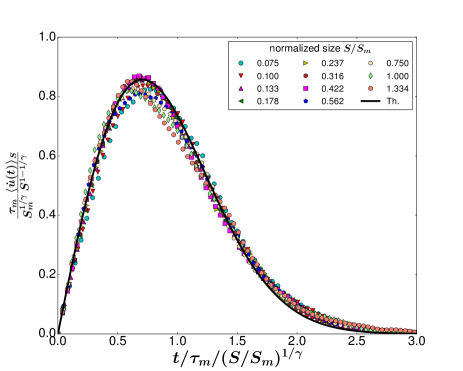
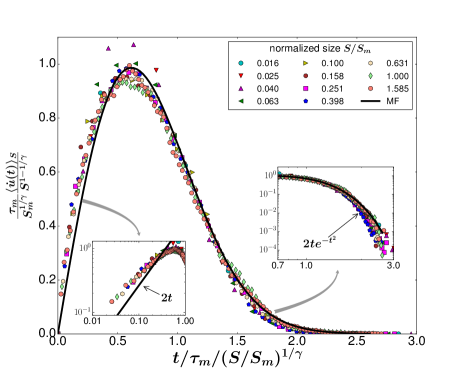
Collapsing the experimental data of the average shapes at fixed size gives an alternative powerful way to estimate the exponent , as reported in Figs. 4 and 5. Here we obtain the same exponents as from the average size measurements , i.e. , and , for LR and SR respectively. The collapsed average shapes correspond remarkably well to the theoretical predictions of Eqs. (8) and (9), including the behavior in the tails (shown in the SR case in the insets of Fig. 5). In the Supplemental Material unp , we further verify that neither the collapse, nor the quantitative fit can be achieved using the MF prediction.
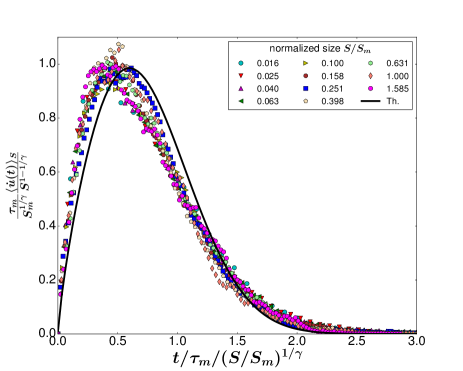
Finally, it is well known that relaxation of eddy currents introduces a slow time scale into the dynamics, stretching avalanches in time DobrinevskiLeDoussalWiese2013 . In Fig. 6, we have obtained an approximate collapse for the SR case in presence of eddy currents, using the theoretical value of . It is a manifest that the resulting curve is different from the one predicted in absence of retardation effects. Hence, this is another unambiguous method to detect the presence of ECs, similarly to the leftward asymmetry of the temporal avalanche shapes at fixed durations ZAP-05 . To go further and obtain predictions for the average shape in presence of ECs is difficult, as the shape strongly depends on the detailed parameters of the eddy currents. A step in that direction was obtained within MF in Ref. DobrinevskiLeDoussalWiese2013 for a particular model of retardation. Detailed comparison with experiments involve non-universal scales, and is left for a future pubblication.
In conclusion we have shown how the data from Barkhausen noise experiments can be analyzed and confronted to the most precise recent theoretical predictions. This provides very quantitative and fundamental tests of the theory of avalanches beyond scaling exponents. The prediction of universality will also lead to a better characterization of magnetic systems, allowing to measure its dimensionality and, via the deviations from the theory, effects of multiple avalanches or eddy currents.
Acknowledgements.
This work was supported by PSL grant ANR-10-IDEX-0001-02-PSL and CNPq (Grants No. /-, No. /-, No. /-, and No. /-). We acknowledge hospitality of the KITP with support in part by the National Science Foundation under Grant No. NSF PHY11-25915.References
- (1) H. Barkhausen, Zwei mit Hilfe der neuen Verstärker entdeckte Erscheinugen, Physik Z. 20 (1919) 401–403.
- (2) J. S. Urbach, R. C. Madison and J. T. Markert, Interface depinning, self-organized criticality, and the Barkhausen effect, Phys. Rev. Lett. 75 (1995) 276–279.
- (3) D.H. Kim, S.-B. Choe and S.-C. Shin, Direct observation of Barkhausen avalanche in Co thin films, Phys. Rev. Lett. 90 (2003) 087203.
- (4) V. Repain, M. Bauer, J.-P. Jamet, J. Ferré, A. Mougin, C. Chappert and H. Bernas, Creep motion of a magnetic wall: Avalanche size divergence, EPL 68 (2004) 460–466.
- (5) G. Durin and S. Zapperi, The Science of Hysteresis: Physical Modeling, Micromagnetics, and Magnetization Dynamics, Volume II, chapter III “The Barkhausen noise”, pages 181–267, Academic Press, Amsterdam, 2006.
- (6) S. Papanikolaou, F. Bohn, R.L. Sommer, G. Durin, S. Zapperi and J.P. Sethna, Universality beyond power laws and the average avalanche shape, Nat. Phys. 7 (2011) 316–320.
- (7) S. Zapperi, C. Castellano, F. Colaiori, and G. Durin, Signature of effective mass in crackling-noise asymmetry, Nat. Phys. 1 (2005) 46-49.
- (8) P. Le Doussal, K.J. Wiese, S. Moulinet and E. Rolley, Height fluctuations of a contact line: A direct measurement of the renormalized disorder correlator, EPL 87 (2009) 56001.
- (9) S. Moulinet, C. Guthmann and E. Rolley, Roughness and dynamics of a contact line of a viscous fluid on a disordered substrate, Eur. Phys. J. E 8 (2002) 437–443.
- (10) D. Bonamy, S. Santucci and L. Ponson, Crackling dynamics in material failure as the signature of a self-organized dynamic phase transition, Phys. Rev. Lett. 101 (2008) 045501.
- (11) L. Laurson, X. Illa, S. Santucci, K.T. Tallakstad, K.J. Måløy and M.J. Alava, Evolution of the average avalanche shape with the universality class, Nat. Commun. 4 (2013) 2927.
- (12) N. Shapira, Y. Lamhot, O. Shpielberg, Y. Kafri, B. J. Ramshaw, D. A. Bonn, Ruixing Liang, W. N. Hardy and O. M. Auslaender, Disorder-induced power-law response of a superconducting vortex on a plane, Phys. Rev. B 92 (2015) 100501(R).
- (13) B. Alessandro, C. Beatrice, G. Bertotti and A. Montorsi, Domain-wall dynamics and Barkhausen effect in metallic ferromagnetic materials. I. Theory, J. Appl. Phys. 68 (1990) 2901.
- (14) B. Alessandro, C. Beatrice, G. Bertotti and A. Montorsi, Domain-wall dynamics and Barkhausen effect in metallic ferromagnetic materials. II. Experiments, J. Appl. Phys. 68 (1990) 2908.
- (15) F. Colaiori, Exactly solvable model of avalanches dynamics for Barkhausen crackling noise, Advances in Physics 57 (2008) 287.
- (16) D.S. Fisher, Collective transport in random media: From superconductors to earthquakes, Phys. Rep. 301 (1998) 113–150.
- (17) S. Zapperi, P. Cizeau, G. Durin and H.E. Stanley, Dynamics of a ferromagnetic domain wall: Avalanches, depinning transition, and the Barkhausen effect, Phys. Rev. B 58 (1998) 6353–6366.
- (18) G. Durin and S. Zapperi, Scaling exponents for Barkhausen avalanches in polycrystalline and amorphous ferromagnets, Phys. Rev. Lett. 84 (2000) 4705–4708.
- (19) P. Le Doussal and K.J. Wiese, Size distributions of shocks and static avalanches from the functional renormalization group, Phys. Rev. E 79 (2009) 051106.
- (20) A. Rosso, P. Le Doussal and K.J. Wiese, Avalanche-size distribution at the depinning transition: A numerical test of the theory, Phys. Rev. B 80 (2009) 144204.
- (21) P. Le Doussal and K.J. Wiese, Distribution of velocities in an avalanche, EPL 97 (2012) 46004.
- (22) A. Dobrinevski, P. Le Doussal and K.J. Wiese, Non-stationary dynamics of the Alessandro-Beatrice-Bertotti-Montorsi model, Phys. Rev. E 85 (2012) 031105.
- (23) P. Le Doussal and K.J. Wiese, Avalanche dynamics of elastic interfaces, Phys. Rev. E 88 (2013) 022106.
- (24) A. Dobrinevski, P. Le Doussal and K.J. Wiese, Avalanche shape and exponents beyond mean-field theory, EPL 108 (2014) 66002.
- (25) L. Laurson, X. Illa, S. Santucci, K.F T. Tallakstad, K. J. Måløy and M. J. Alava, Evolution of the average avalanche shape with the universality class, Nat. Commun. 4 (2013) 2927.
- (26) A. Dobrinevski, P. Le Doussal and K.J. Wiese, Statistics of avalanches with relaxation and Barkhausen noise: A solvable model, Phys. Rev. E 88 (2013) 032106.
- (27) Its actual value depends on the threshold which defines the start of the avalanche DUR-06 , however the latter can safely be set within a range where the critical exponents’ estimation is robust, as explained in LAU-09a .
- (28) L. Laurson, X. Illa and M. J. Alava, The effect of thresholding on temporal avalanche statistics, J. Stat. Mech. 2009 (2009) P01019.
- (29) F. Bohn, M. A. Corrêa, M. Carara, S. Papanikolaou, G. Durin and R. L. Sommer, Statistical properties of Barkhausen noise in amorphous ferromagnetic films, Phys. Rev. E 90 (2014) 032821.
- (30) F. Bohn, M. A. Corrêa, A. Da Cas Viegas, S. Papanikolaou, G. Durin and R. L. Sommer, Universal properties of magnetization dynamics in polycrystalline ferromagnetic films, Phys. Rev. E 88 (2013) 032811.
- (31) R. A. White and K. A. Dahmen Driving Rate Effects on Crackling Noise, Phys. Rev. Lett. 91 (2003) 085702
- (32) G. Durin, F. Bohn, M. A. Corrêa, R. L. Sommer, P. Le Doussal, K. J. Wiese, Supplemental Material.

Supplemental material of
Quantitative scaling of magnetic avalanches
G. Durin, F. Bohn, M. A. Corrêa, R. L. Sommer, P. Le Doussal, K. J. Wiese
In this supplemental material, we
-
(A)
Provide information on the investigated samples and details on the experiments;
-
(B)
Further characterize the samples, and discuss distributions of avalanche sizes and universality classes;
-
(C)
Provide additional comparison of the data with the theoretical mean-field predictions.
A. Samples and experiments
We employ thin films and ribbons to perform Barkhausen noise experiments.
The thin films correspond to a polycrystalline Ni81Fe19 Permalloy (Py) film with thickness of nm and an amorphous Fe75Si15B10 (FeSiB) film with the thicknesses of nm. The films are deposited by magnetron sputtering onto glass substrates, with dimensions mm mm, covered with a nm thick Ta buffer layer. The deposition process is carried out with the following parameters: base vacuum of Torr, deposition pressure of mTorr with a % pure Ar at sccm constant flow. The Ta layer is deposited using a DC source with current of mA, while the ferromagnetic layers are deposited using a W RF power supply. During the deposition, the substrate moves at constant speed through the plasma to improve the film uniformity, and a constant magnetic field of kOe is applied along the main axis of the substrate in order to induce magnetic anisotropy. Detailed information on the structural and magnetic characterizations is found in Refs. BOH-14 ; BOH-13 .
The ribbons are a polycrystalline FeSi alloy with Si=7.8% and an amorphous Fe64Co21B15 (FeCoB), both with thickness of about m. The experiments are performed with ribbons of dimensions of about cm cm, and the FeCoB one is measured under a small tensile stress of MPa in order to enhance the signal-noise ratio. Further information on the ribbons is found in Refs. DurinZapperi2000 ; DUR-06 .
We record Barkhausen noise time series using the traditional inductive technique in an open magnetic circuit, in which one detects time series of voltage pulses with a sensing coil wound around a ferromagnetic material submitted to a slow-varying magnetic field. In our setup, the sample and pick up coils are inserted in a long solenoid with compensation for the borders, to ensure an homogeneous applied magnetic field on the sample. The sample is driven by a triangular magnetic field, applied along the main axis of the sample, with an amplitude high enough to saturate it magnetically. Barkhausen noise is detected by a sensing coil wound around the central part of the sample. A second pickup coil, with the same cross section and number of turns, is adapted in order to compensate the signal induced by the magnetizing field. The Barkhausen signal is then amplified, filtered, and finally digitalized. For the thin films, Barkhausen noise measurements are performed using a sensing coil with turns, mm long and mm wide, and under similar conditions, i. e., mHz triangular magnetic field, kHz low-pass filter set in the preamplifier and signal acquisition with sampling rate of samples per second BOH-14 ; BOH-13 . For the ribbons, the experiments are carried out using a sensing coil with turns, mm long and cm wide, triangular magnetic field with frequency of - mHz, and low pass preamplifier filter chosen in the - kHz range, roughly half of the sampling rate DurinZapperi2000 ; DUR-06 . All the time series are acquired just around the central part of the hysteresis loop, near the coercive field, where the domain wall motion is the main magnetization mechanism DUR-06 . For each experimental run, the statistical properties are obtained from at least measured Barkhausen noise time series.
B. Distribution of avalanche sizes
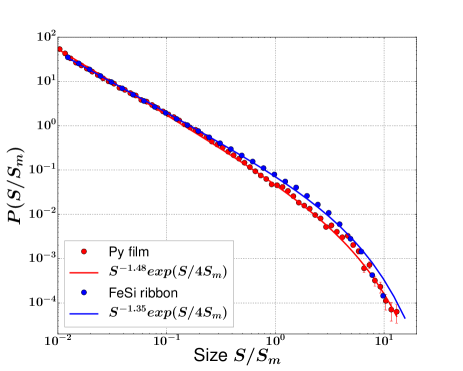
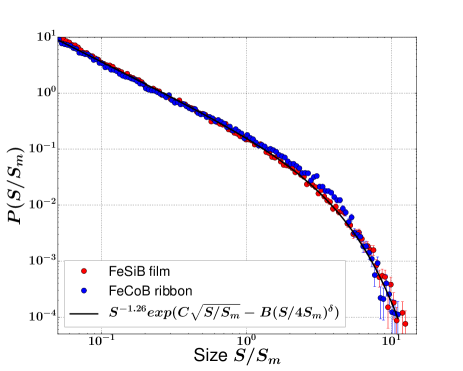
Here, we further characterize the investigated samples and show why they belong to different universality classes. Figure S2 presents the distributions of avalanche sizes for the LR and the SR samples. All the distributions follow a cutoff-limited power-law scaling behavior, as expected. The LR samples, i.e. the polycrystalline Py thin film and FeSi ribbon, are characterized by mean-field exponent, , and well described by the theoretical prediction of Ref. RossoLeDoussalWiese2009a . Due to finite rate effects, the experimental exponents are a little smaller than the prediction, although the cutoff of the distribution is perfectly predicted at . The SR samples, i.e. the FeSiB thin film and the FeCoB ribbon, present the Narayan-Fisher exponent , and are well described by the theoretical prediction of Ref. LeDoussalWiese2008c , Eqs. ()-(), in which , with , , , , where and .
C. Additional comparison with mean-field predictions
The aim of this section is to show that the data for the SR samples cannot be fit consistently with the mean-field predictions.
Let us start with the average normalized size as a function of the normalized duration . When compared with the MF prediction , we need to adapt the value of the , as explained in the main paper. Here we need to increase its value by 30% (see Fig. S1, left) up to 50% (right) compared to the value of Fig. 2 of the paper. It is clear that the MF curve, having , larger than the experimental data, either follows low value data but fails for the higher ones or intersects them at some point. In practice, it cannot correctly describe the experiments.
Let us now discuss the data for the avalanche shapes.
The main question is whether the data for the SR samples can be fitted by the MF predictions, which means (i) , and (ii) a scaling function . In Fig. S3 (left) we present the data rescaled with the choice . Obviously there is no data collapse for various sizes. This feature is clearly independent of the choice of as depends on only. This rules out the MF prediction to compare with the data.
Another question, mostly of theoretical interest, is how the scaling function of the rescaling of the data with in Fig. 5 of the main paper differs quantitatively from the MF prediction . In Fig. S3 (right) to compare the two curves we need to artificially change the value, which is smaller and incompatible with the values of Fig. S1. More striking, the scaling function is linear at low values, while the data follow a law.
In conclusion, it is important to emphasize that a quantitative comparison of the experimental data with the theoretical predictions is only possible when the values of the parameters are fixed, and compatible with the theoretical curves. In other words, a single visual comparison may not be enough to establish the universality class. Here we demonstrated that the use of at least two independent measurements (such as the average size, and the average shapes at fixed sizes) set constrains that unambiguously determine the universality class. This is particularly important when applied to other systems showing a similar crackling noise, or in more general displaying a dynamical phase transition.
References
- (1) F. Bohn, M. A. Corrêa, M. Carara, S. Papanikolaou, G. Durin and R. L. Sommer, Statistical properties of Barkhausen noise in amorphous ferromagnetic films, Phys. Rev. E 90 (2014) 032821.
- (2) F. Bohn, M. A. Corrêa, A. Da Cas Viegas, S. Papanikolaou, G. Durin and R. L. Sommer, Universal properties of magnetization dynamics in polycrystalline ferromagnetic films, Phys. Rev. E 88 (2013) 032811.
- (3) G. Durin and S. Zapperi, The Science of Hysteresis: Physical Modeling, Micromagnetics, and Magnetization Dynamics, Volume II, chapter III “The Barkhausen noise”, pages 181–267, Academic Press, Amsterdam, 2006.
- (4) G. Durin and S. Zapperi, Scaling exponents for Barkhausen avalanches in polycrystalline and amorphous ferromagnets, Phys. Rev. Lett. 84 (2000) 4705–4708.
- (5) S. Papanikolaou, F. Bohn, R.L. Sommer, G. Durin, S. Zapperi and J.P. Sethna, Universality beyond power laws and the average avalanche shape, Nat. Phys. 7 (2011) 316–320.
- (6) A. Rosso, P. Le Doussal and K.J. Wiese, Avalanche-size distribution at the depinning transition: A numerical test of the theory, Phys. Rev. B 80 (2009) 144204.
- (7) P. Le Doussal and K.J. Wiese, Size distributions of shocks and static avalanches from the functional renormalization group, Phys. Rev. E 79 (2009) 051106.