No evidence of intrinsic optical/near-infrared linear polarization for V404 Cygni during its bright outburst in 2015: Broadband modeling and constraint on jet parameters
Abstract
We present simultaneous optical and near-infrared (NIR) polarimetric results for the black hole binary V404 Cyg spanning the duration of its 7-day long optically-brightest phase of its 2015 June outburst. The simultaneous and -band light curves showed almost the same temporal variation except for the isolated ( min duration) orphan -band flare observed at MJD 57193.54. We did not find any significant temporal variation of polarization degree (PD) and position angle (PA) in both and bands throughout our observations, including the duration of the orphan NIR flare. We show that the observed PD and PA are predominantly interstellar in origin by comparing the V404 Cyg polarimetric results with those of the surrounding sources within the field-of-view. The low intrinsic PD (less than a few percent) implies that the optical and NIR emissions are dominated by either disk or optically-thick synchrotron emission, or both. We also present the broadband spectra of V404 Cyg during the orphan NIR flare and a relatively faint and steady state by including quasi-simultaneous Swift/XRT and INTEGRAL fluxes. By adopting a single-zone synchrotron plus inverse-Compton model as widely used in modeling of blazars, we constrained the parameters of a putative jet. Because the jet synchrotron component cannot exceed the Swift/XRT disk/corona flux, the cutoff Lorentz factor in the electron energy distribution is constrained to be , suggesting particle acceleration is less efficient in this microquasar jet outburst compared to AGN jets. We also suggest that the loading of the baryon component inside the jet is inevitable based on energetic arguments.
Subject headings:
polarization — binaries: general — radiation mechanisms: non-thermal — stars: jets — infrared: stars — stars: individual (V404 Cyg)1. Introduction
A relativistic collimated outflow (known as a jet) emerging from a black hole (BH) is ubiquitously observed in various spatial scales from stellar mass () to supermassive () BHs. Polarimetry in the optical and near-infrared (NIR) bands is a powerful method to unveil the emission mechanism and investigate the magnetic field structure inside the jet (e.g., Marscher et al., 2008). In Active Galactic Nuclei (AGN) and Gamma-Ray Burst (GRB) jets, it is well accepted that the optical and NIR lights are produced by high-energy electrons through optically-thin synchrotron emission. High degrees of linear polarization in the optical/NIR band observed from AGN and GRB jets (% up to 30–40%; see e.g., Ikejiri et al., 2011; Uehara et al., 2012) indicate that the synchrotron process is operating, with highly ordered magnetic fields in the emission regions. Measurements of polarization position angle (PA) are also useful to determine the magnetic field direction at the emission region. In addition, the detection of a polarization PA swing may manifest from the presence of a helical magnetic field along a jet or curved structure indicating the global jet geometry (e.g. Marscher et al., 2008; Abdo et al., 2010).
It is also known that the jet emission in stellar-mass BHs appear in the NIR band. While emission in the optical-band is dominated by the accretion disk, an excess with respect to the Rayleigh-Jeans tail of the disk blackbody component is often found in the NIR-band. Hence, if the NIR emission is due to optically-thin synchrotron emission, a high polarization degree (PD) is theoretically expected. However, reliable optical/NIR polarimetric measurements for Galactic BH binary jets are still very limited mainly due to the difficulty in eliminating the interstellar polarization caused by large amounts of dust clouds in our Galaxy in the target directions. Another reason for the paucity of intrinsic polarization measurements is that the objects are often not sufficiently bright to perform polarimetry. In this regard, we note that clear NIR polarization was detected from Cyg X-2 and Sco X-1 based on spectro-polarimetry (Shahbaz et al., 2008).
An opportunity to study the BH binary jet through optical/NIR polarimetry was presented when V404 Cygni (a.k.a., GS 2023+338; hereafter V404 Cyg) produced an exceptionally bright outburst in June 2015. This object is one of the famous low-mass X-ray binaries (LMXBs) because a similar huge outburst was detected in 1989 with intensive multi-wavelength observations performed at that time (e.g., Makino, 1989). The distance is accurately determined as kpc from parallax measurement using astrometric VLBI observations (Miller-Jones et al., 2009). In this paper, aimed at studying the non-thermal jet emission and constraining the physical parameters in a microquasar jet, we present results of linear polarization measurements in the optical and NIR bands for V404 Cyg during the brightest outburst in June 2015 performed by the Kanata 1.5 m and Pirka 1.6 m telescopes in Japan. Observations and data reductions are described in §2. We show the results in §3, and the implications of our findings are presented in §4.
2. Observations and Data Reductions
2.1. Kanata/HONIR
We performed simultaneous optical and NIR imaging polarimetry for V404 Cyg using the Hiroshima Optical and Near IR camera (HONIR; Akitaya et al., 2014) mounted on the Kanata 1.5-m telescope in Higashi-Hiroshima, Japan. The data presented here were taken on MJD 57193 and 57194. The HONIR polarization measurements utilize a rotatable half-wave plate and a Wollaston prism. We selected and bands as the two simultaneous observing filters. To study the wavelength dependence of polarization properties for the target, we also took imaging polarimetric data on MJD 57194.50–57194.55 (the “C” subscripts are herein suppressed). Each observation consisted of a set of four exposures at half-wave plate position angles of 00, 225, 450, and 675. Typical exposures in each frame were 30 s and 15 s for the - and -bands, respectively, but these exposures were sometimes modified depending on weather conditions (decreased when seeing became good, and increased when cirrus clouds passed over the target). - and -band exposures on MJD 57194 were 30 s and 15 s, respectively.
To calibrate these data, we observed standard stars on MJD 57195 that are known to be unpolarized (HD 154892) and strongly-polarized (HD 154445 and HD 155197; Turnshek et al., 1990; Wolff et al., 1996). We thereby confirmed that the instrumental PD is less than 0.2% and determined the instrumental polarization PA against the celestial coordinate grid. Absolute flux calibration, which is needed to construct the optical and NIR SEDs, was performed by observing standard stars on the photometric night MJD 57200.
2.2. Pirka/MSI
We also performed optical -band imaging polarimetry monitoring for V404 Cyg using the Multi-Spectral Imager (MSI; Watanabe et al. 2012) mounted on the 1.6-m Pirka telescope located in Hokkaido, Japan, from MJD 57190–57193. The MSI observations were performed in a similar manner to the Kanata/HONIR ones, namely the MSI utilizes a rotatable half-wave plate and a Wollaston prism, and a series of four exposures were taken for each polarization measurement. The typical exposure time of each frame was 15 s. To remove the instrumental polarization (%) and to calibrate the polarization PA, we used past MSI data of the two unpolarized stars (BD+32 3739 and HD 212311; Schmidt et al., 1992) and three strongly-polarized stars (HD 154445, HD 155197, and HD 204827; Schmidt et al., 1992) obtained on MJD 57167 and 57169. We also confirmed the polarization efficiency of % using a polarizer and flat-field lamp.
2.3. Swift/XRT
We analyzed X-ray data for V404 Cyg taken with XRT onboard the Swift satellite using HEASoft version 6.16. The Swift/XRT data analyzed here were taken on MJD 57193 and 57194 (observation IDs: 00031403040 and 00031403046), which were almost simultaneous (within less than 1 hour) with the Kanata/HONIR multi-band photo-polarimetry data. Clean events of grade 0–12 within the source rectangle region (because the observation was in window-timing mode) were selected. After subtracting background counts selected from both sides of the source with rectangle shapes, the 0.5–10 keV events were utilized for spectroscopy. We generated ancillary response files with the xrtmkarf tool. Using XSPEC version 12.8.2, we roughly fit the data by assuming a disk blackbody plus power-law model, both modulated by Galactic absorption (i.e., wabs*(diskbb+pow)), and converted the deabsorbed spectra to fluxes.
3. Results
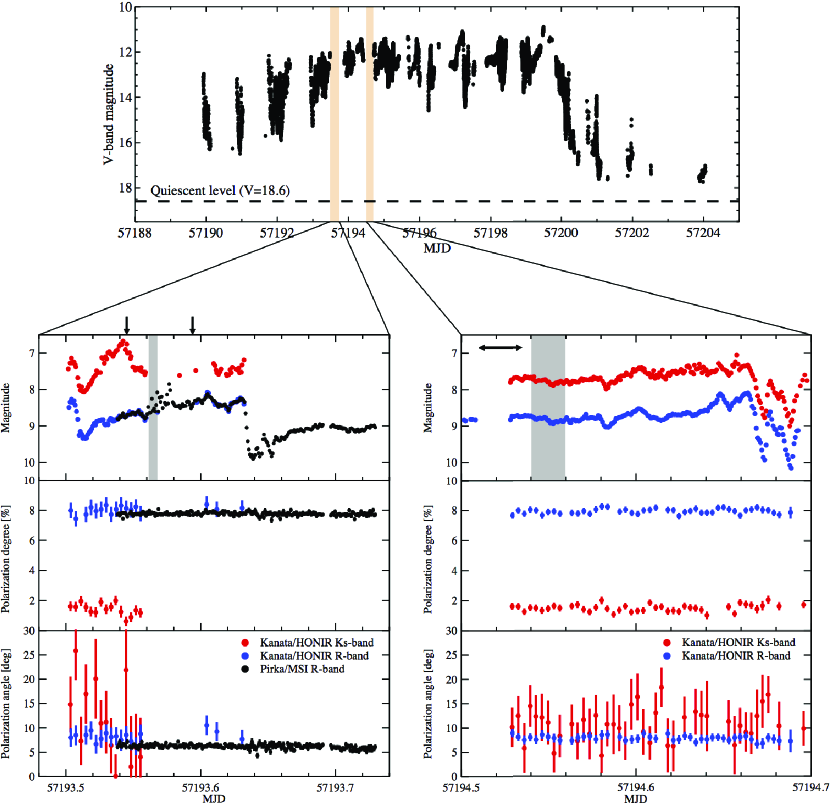
Fig. 1 (top panel) shows the -band light curve of V404 Cyg during the bright outburst (Kimura et al., 2016) after the detection of burst-like activities by Swift/BAT, Fermi/GBM, and MAXI/GSC on 2015 June 15 (MJD 57188) (Negoro et al., 2015; Kuulkers et al., 2015). The optical flux increased by mag compared to the quiescent level ( mag, Wagner et al., 1991) with a maximum around MJD 57194 and the highest flux level continued for about one week. During this brightest phase, the source showed large-amplitude (as much as 3 mag) and short-time variability. Fig. 1 (two bottom panels) illustrate intra-night variations of the - and -band fluxes, polarization degrees (PDs), and polarization position angles (PAs) measured by Kanata/HONIR and Pirka/MSI on MJD 57193 and 57194 (corresponding to 2015 June 19 and 20). Note that the Kanata/HONIR - and -band photometric and polarimetric observations are strictly simultaneous. On MJD 57193, the HONIR observations were interrupted by cloudy weather and stopped around MJD 57193.64, while Pirka/MSI continuously obtained -band photometric and polarimetric data over hours.
On the whole, the simultaneous - and -band light curves showed similar temporal variations. However, around MJD 57193.54, a flux increase is evident only in the band, while no corresponding enhancement was observed in the -band. During this NIR flare, the -band PD and PA did not show any significant variation despite the pronounced flux change. The -band PD and PA were constant at % and , respectively, throughout the HONIR observations that night. That same night, the -band light curve showed a rapid and large-amplitude decrease around MJD 57193.64 and then gradually recovered. During the optical dip, the PD and PA were constant and did not show any significant variations. Similarly, the -band PDs and PAs measured by Pirka/MSI on this night remained constant at % and , respectively. Note that there is a small discrepancy between the Pirka/MSI and Kanata/HONIR -band polarimetric results (see Table 1). This could be due to a lack of cross-calibration but our subsequent discussion is unaffected by this small difference.
On the next night, the observing conditions were relatively good until MJD 57194.7 and we obtained -hours of continuous, simultaneous - and -band photometric and polarimetric data for V404 Cyg. As shown in Fig. 1 (bottom-right panel), the HONIR photometric light curves in - and bands exhibited quite similar temporal profiles, including the two ‘dips’ around MJD 57194.68. The PDs and PAs in both bands were again constant over the -hour duration, even over the course of two observed flux dips. In addition, the PDs and PAs in each band were unchanged from those measured on the previous night (MJD 57193). We note the sporadic nature of the -band polarimetric data points (namely, PD and PA) after MJD 57194.64 were due to the passage of cirrus clouds (NIR observations are more heavily affected by clouds compared to the optical).
Finally, we note that in addition to the photo-polarimetric data presented here we also obtained Pirka/MSI -band data on MJD 57190, 57191, and 57192. As shown in Table 1, these data showed that the polarization parameters of the object remained constant at and over the three nights despite dramatic variability of the total flux of mag.
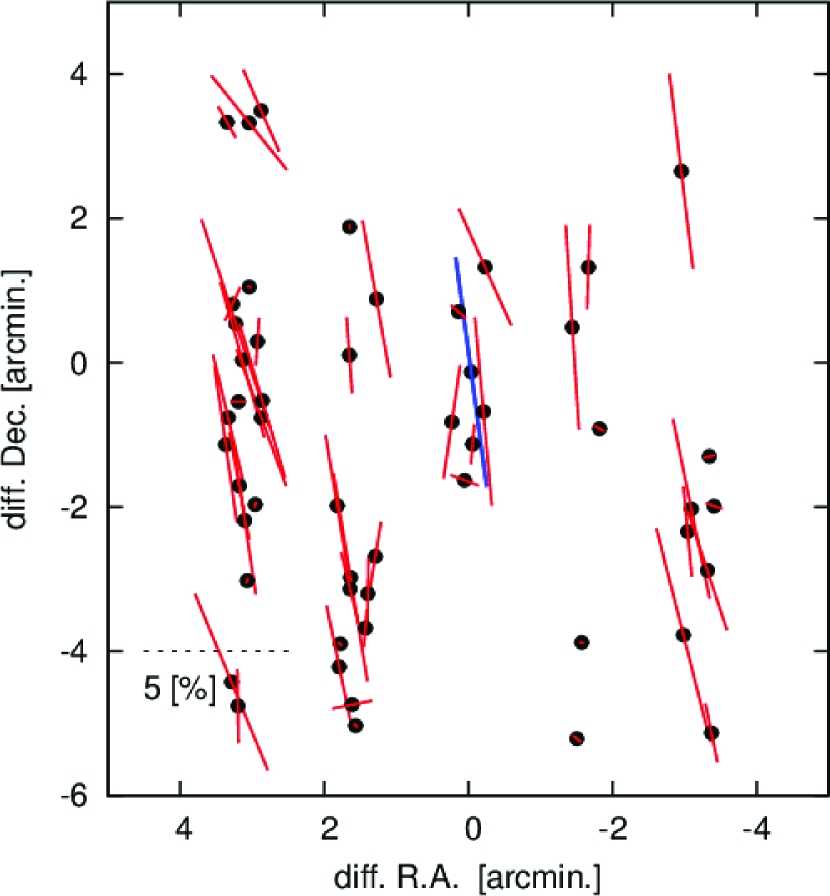
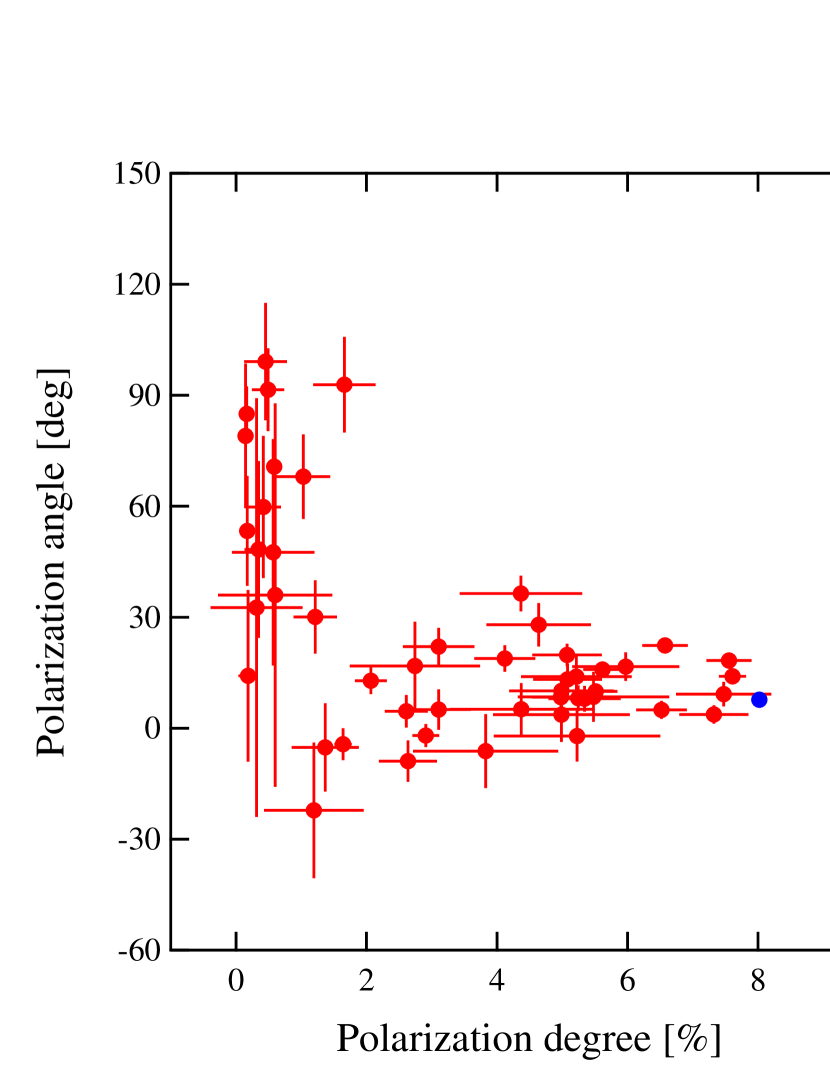
To investigate the polarization properties of the sky region in the direction of V404 Cyg, we also analyzed the Kanata/HONIR -band data taken on MJD 57194 (selected because the observing condition was much better compared to MJD 57193) and determined the PDs and PAs for the brightest field stars within the HONIR field-of-view (FoV). The results are displayed in Fig. 2. We found that the PAs of not only V404 Cyg, but also the surrounding objects, showed almost the same direction. Moreover, the measured PDs were also observed at similar levels. These findings clearly indicate that, despite the relatively large PD of % for V404 Cyg, local dust clouds located between V404 Cyg and the Earth are the likely cause of the polarized emission in this sky direction and about half of the surrounding objects (including V404 Cyg) are located beyond the dust cloud. This suggests the observed PD and PA for V404 Cyg is not intrinsic but interstellar origin. The hypothesis is supported by the non-variable PDs and PAs for V404 Cyg observed even during the large flux variations (see two bottom panels in Fig. 1). We also plot in Figure 3 the measured PA as a function of PD for each object within the FoV. Two clusterings of the data are clearly visible: objects with very small PD and a wide PA range over 180∘ are likely located in front of local dust clouds, while those with relatively large PDs of typically and broadly similar PAs of 0∘–30∘ are positioned beyond the dust clouds. We note that the slightly greater PD of V404 Cyg () with respect to the surrounding objects () implies a small level of intrinsic polarization for V404 Cyg of at most a few percent.
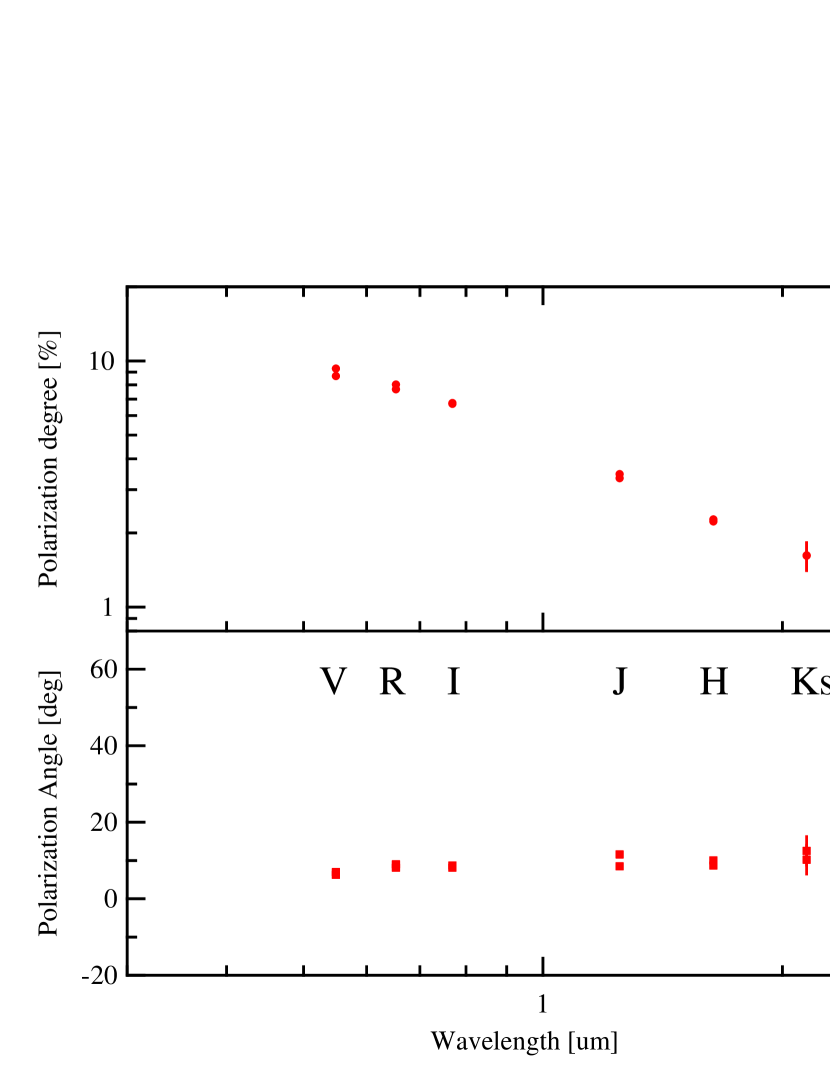
Furthermore, we show the -band PDs and PAs of V404 Cyg in Fig. 4 indicating a steep PD decrease toward longer wavelengths with constant PAs over the six observation bands. This polarization behavior is similar to that of a highly reddened star, suggesting that the polarization is interstellar origin. Detailed study of the interstellar dust based on these multi band polarimetric data will be reported in a forthcoming paper (Itoh et al. in preparation). From these observational results, we consider the measured polarization of V404 Cyg is predominantly contaminated by interstellar dust between the object and the Earth. The low intrinsic PD (less than a few percent) implies that the optical and NIR emissions are dominated by either disk or optically-thick synchrotron emission, or both.
4. Discussion
4.1. Broadband spectrum of V404 Cyg
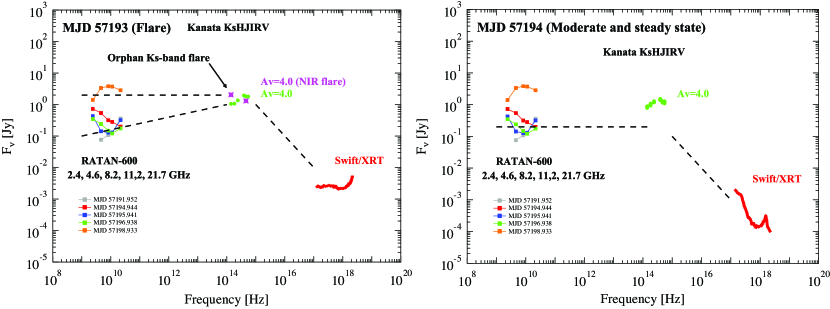
The simultaneous Kanata/HONIR - and -band light curves showed almost the same temporal evolution, except the orphan -band flare which peaked around MJD 57193.54 and lasted for mins (see Fig. 1). Apart from this orphan flare (which is discussed in detail later), the quite similar - and -band light curves naturally leads to an interpretation that the NIR and optical emissions come from the same component (or have the same origin). There are two possible options to explain the optical and NIR emissions: one is a disk origin and the other is from a jet. To gauge which is the most plausible, we constructed a broadband spectrum of V404 Cyg from the radio to X-ray bands in - representation (Fig.5). Note that the radio fluxes are not simultaneous, while the Kanata and Swift/XRT data were obtained within a one-hour timespan. The Kanata optical and NIR fluxes were dereddened by assuming and . The value of 4.0 was derived by Casares et al. (1993) from the spectral type of companion star and colors, which was also confirmed by subsequent studies (e.g., Shahbaz et al., 2003; Hynes et al., 2009). After we corrected the observed fluxes for extinction using , we found a slightly rising, but almost flat () shape in the optical and NIR spectrum. This implies optically-thick synchrotron emission from an outer jet. Indeed, the GHz radio spectrum obtained about 1.5 days before our observation (on MJD 57191.95) can be smoothly extrapolated to the Kanata/HONIR spectral data assuming a form (see Fig 5). However, the flat optical/NIR spectral shape can also be interpreted in a disk model (see e.g., Kimura et al., 2016, Extended Data Figure 6 therein). Thus, it is difficult to determine the optical/NIR emission mechanism solely from its spectral shape. No evidence of intrinsic linear polarization in the - and -bands are allowed in both scenarios because both optically-thick synchrotron and blackbody radiation only generate weak linear polarization of order %.
Here, we focus on the orphan -band flare which lasted for only mins at MJD 57193.54. The observed red color and short duration imply synchrotron emission from a jet as the most plausible origin of the flare. Indeed, the -band peak flux of the flare reached Jy, which was the same level measured during the giant radio and sub-mm flares observed by RATAN-600 and Sub Millimeter Array on MJD 57198.933 and MJD 57195.55 (Trushkin et al., 2015b; Tetarenko et al., 2015), respectively. As shown in Fig. 5 (left panel), an extrapolation of the radio spectrum observed during the giant flare at GHz-frequencies on MJD 57198.933 nicely connects to the -band peak flux by assuming a flat spectral shape (i.e., ). More interestingly, even during the orphan flare, the -band PD remains showed no significant temporal variation, indicating the NIR emission is not strongly polarized. This result would be reasonably understood if the jet synchrotron emission in the band is still in the optically-thick regime. We therefore conjecture that this orphan -band flare is produced by optically-thick synchrotron emission from an outer jet. If the optically-thick synchrotron emission extends up to the -band with a flat spectral shape and the baseline -band flux is not as high as the flaring component of Jy (after extinction correction, assuming ), it significantly contributes to the -band flux as well, making the flare visible also in the -band light curve. A spectral break between the and bands of the flaring emission component caused by the transition of synchrotron emission from optically-thick to optically-thin regimes, if present, would make the contribution of the flaring component negligible with respect to the baseline flux, as observed. The quasi-simultaneous Kanata/HONIR and Swift/XRT spectra measured on MJD 57194.52, together with the RATAN-600 non-simultaneous radio fluxes are also shown. The radio, optical/NIR, and X-ray spectra would be reasonably understood as optically-thick synchrotron emission from the outer jet, disk emission, and disk plus corona emissions, respectively.
4.2. Properties of the jet
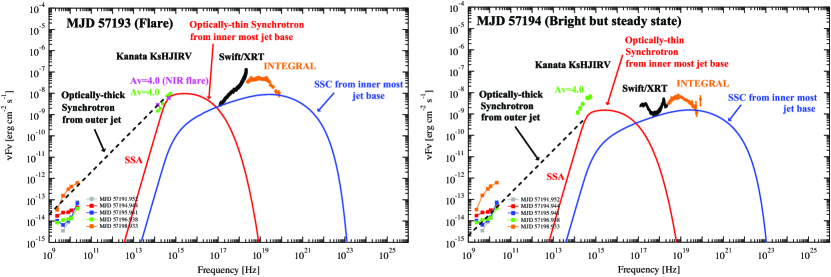
To constrain the jet parameters and physical quantities in the emission region, we attempted to model the spectral energy distribution (SED) of V404 Cyg by using a one-zone synchrotron plus synchrotron self-Compton (SSC) model (Finke et al., 2008), which is widely used for blazar SED modeling (e.g., Abdo et al., 2009, 2011; Tanaka et al., 2014, 2015). We show in Fig. 6 (left panel) the quasi-simultaneous broadband SED of V404 Cyg during the -band flare. This modeling assumes that a single emission region is located at the inner-most part of the jet. Hence, the optically-thick synchrotron emission from an outer jet, which has a flat spectrum of observed in the radio up to NIR band is not modeled, while the optically-thin synchrotron and SSC emissions at optical frequencies and higher are fitted. However, in the current case, we now know that the optical and X-ray emission are from a disk and disk plus corona, respectively. We therefore regard the Kanata/HONIR, Swift/XRT, and INTEGRAL data points (taken from Fig. 3 of Rodriguez et al., 2015) as upper limits for the jet emission. Another constraint comes from the Kanata/HONIR observation that the -band emission is not significantly polarized even during the orphan flare. This indicates that the -band emission is still in the optically-thick regime and that the break frequency (defined as ) is due to synchrotron self absorption (SSA). The transition from the optically-thick to optically-thin regime is above the -frequency band, thus Hz, and we adopt a value of Hz. We also assume that the synchrotron peak flux is 2 Jy as observed by Kanata/HONIR (and also by RATAN-600 on MJD 57198.933). We can then derive the magnetic field and the size of the emission region by using the standard formulae for synchrotron absorption coefficient and emissitivity (e.g., Rybicki & Lightman, 1979; Chaty et al., 2011; Shidatsu et al., 2011),
| (1) | |||||
| (2) |
where is the power-law index of electron distribution (see below) and is the distance to V404 Cyg. Here we assumed almost equipartition between magnetic field and electron energy density, which was confirmed by the following SED modeling.
The electron energy distribution is assumed to have a single power-law shape with exponential cutoff as for , where is the electron Lorentz factor, is the electron normalization, is the power-law index, is the cutoff energy, and are the minimum and maximum electron energies and are respectively set to 1 and . The jet inclination angle of V404 Cyg is estimated as (e.g., Shahbaz et al., 1994; Khargharia et al., 2010) and assuming a jet velocity of , the corresponding Doppler beaming factor is . We can therefore safely neglect relativistic beaming effects.
By changing the parameters of the electron energy distribution, we calculated the resultant synchrotron and SSC emissions. The calculated model curves are shown in Fig. 6 (left panel) and all the model parameters are tabulated in Table 2. The derived parameters for the electron energy distribution are , , and . Importantly, the Swift/XRT data allowed us to constrain the cutoff energy as because larger violates these upper limits in the soft X-ray band. This implies that particle acceleration in this microquasar jet is not very efficient. The electron energy distribution cutoff energy is determined by the balance between acceleration and cooling times, where the acceleration time is defined as by using an electron energy and parameter , the number of gyrations an electron makes while doubling its energy (e.g., Finke et al., 2008; Murase et al., 2014). Since dominant cooling processes for electrons of are both synchrotron and SSC, the cooling time is estimated as , where and are the energy densities of magnetic field and synchrotron photons, respectively (e.g., Finke et al., 2008). Thus, we obtain by setting and G. This is much larger than in blazar jets (e.g., Rachen & Mészáros, 1998), indicating much longer acceleration times and inefficient acceleration in this microquasar jet.
Note that the electron power-law index of 2.2 we obtained from SED modeling has already been modified by rapid synchrotron and SSC cooling. In the current situation, because the magnetic field is strong ( G) and emission region is small ( cm), we need to consider the following three energy loss processes: adiabatic cooling (this is also equivalent to particle escape from emission region), synchrotron cooling, and SSC cooling. Note here that we can neglect synchrotron cooling for electrons of because the optically-thick regime is below (e.g., Piran, 2004). Cooling timescales for these processes are estimated as and , respectively (e.g., Piran, 2004; Chaty et al., 2011). Therefore, high-energy electrons of rapidly lose their energy via SSC emission and hence the electron power-law index becomes steeper by one power of , if injection of high-energy emitting electrons continued over a few tens of minutes (which corresponds to the flare duration observed by Kanata/HONIR). Namely, the electron energy distribution at is already in a fast-cooling regime, which indicates that the original (or injected) electron power-law index is 1.2. This is much smaller than the standard power-law index of 2.0 derived by the first-order Fermi acceleration theory (e.g., Blandford & Ostriker, 1978).
We can now derive the total energy in electrons and magnetic field as erg and erg, respectively, thus the jet is Poynting-flux dominated by a factor of . The jet power in electrons () and magnetic field () is calculated as , where is the electron energy density, is assumed, and the factor of 2 is due to the assumption of a two-sided jet (e.g., Finke et al., 2008). Then, we obtain erg s-1 and erg s-1, and the summed power () amounts to erg s-1. On the other hand, we can also calculate the total radiated power using the SED modeling result as erg s-1, which is larger than the summed erg s-1. This indicates that the Poynting flux () and are not sufficient to explain and another form of power is required. The simplest and most probable solution is to assume that the jet contains enough protons which have larger power than (e.g., Sikora & Madejski, 2000; Ghisellini et al., 2014; Tanaka et al., 2015; Saito et al., 2015). This is another (though indirect) evidence of a baryon component in a microquasar jet. Note that we reached the above conclusion based on jet energetics argument, but the baryonic jet in a microquasar has already been claimed by a different, independent method based on the detection of blue-shifted emission lines in the X-ray spectra for SS 433 and 4U 163047 (Kotani et al., 1994; Díaz Trigo et al., 2013).
By assuming that the jet contains one cold proton per one relativistic (emitting) electron, we can derive the total energy of cold protons as erg, where is the proton mass. This corresponds to the cold proton power () of erg s-1 by using the relation of (e.g., Finke et al., 2008), where is the energy density of cold protons and is assumed. We therefore obtain the total jet power and radiative efficiency of the jet as (see also Table 2).
During the moderate and steady state on MJD 57194, there were no observational constraints on due to the dominance of the disk component in the optical and NIR bands, hence we assume that it remained the same as that during the bright flare, Hz. We estimated the synchrotron peak flux as 0.2 Jy, because such a flux level was observed in the GHz band during the high state (Trushkin et al., 2015a) and an extrapolation to the NIR band with a flat shape () seems reasonable. We thereby obtained the following estimates of G and cm (see Equations (1) and (2)). Important information about the non-thermal jet emission, which should be included in the SED modeling, comes from the INTEGRAL detection of an additional power-law component of in the hard X-ray band (Rodriguez et al., 2015). The Kanata/HONIR, Swift/XRT, and INTEGRAL (exponential cutoff power-law component dominant up to keV) data points are treated as upper limits. Based on these assumptions and the multi-wavelength data, we calculated the broadband non-thermal jet emission by accelerated electrons using the one-zone synchrotron and SSC model. The result is shown by solid lines in Fig. 6 (right panel) and the model parameters are tabulated in Table 2. We obtained the same parameter values of and for the electron energy distribution, but the electron normalization is smaller due to the fainter jet flux, as was observed in the radio band. We also found , suggesting again the jet is slightly Poynting-flux dominated. More interestingly, the total radiated power is again larger than the summed electron and magnetic field powers in the jet (see Table 2), implying the presence of a baryonic component even during the fainter state.
Our discussion of the jet properties of V404 Cyg in this section, particularly in relation to AGN jets can be summarized as follows.
-
1.
The SSA frequency and peak flux density enable us to estimate the magnetic field strength and size of the emission region by assuming equipartition between magnetic field and relativistic electrons. The derived magnetic field of Gauss is much stronger, and size of the emission region of cm much smaller, compared to AGN jets (typically Gauss and cm, see e.g., Ghisellini et al. (2010)).
-
2.
Based on modeling of the broadband spectrum of V404 Cyg, we found an upper limit to the cutoff Lorentz factor of electrons of . Because the cutoff is determined by the balance of the acceleration and cooling times, this result implies a longer acceleration time of in this microquasar jet, suggesting electron acceleration is much less efficient compared to AGN jets (that typically show ).
-
3.
The original (or injected) power-law index of the electron energy distribution was derived as . In the SED modeling of AGN jets, electrons are assumed to have a broken power-law shape. The power-law index below the break Lorentz factor (typically ) is estimated as (e.g., Ghisellini et al., 2010). Hence, derived here in V404 Cyg jet is comparable to that derived in AGN jets, implying that same acceleration mechanism operates in these different systems.
-
4.
To account for the total radiated power of the jet of V404 Cyg, a cold proton component is required inside the jet. This is the same situation as in AGN jets.
- 5.
References
- Abdo et al. (2009) Abdo, A. A., Ackermann, M., Ajello, M., et al. 2009, ApJ, 707, 55
- Abdo et al. (2010) —. 2010, Nature, 463, 919
- Abdo et al. (2011) —. 2011, ApJ, 736, 131
- Akitaya et al. (2014) Akitaya, H., Moritani, Y., Ui, T., et al. 2014, in Society of Photo-Optical Instrumentation Engineers (SPIE) Conference Series, Vol. 9147, 4
- Blandford & Ostriker (1978) Blandford, R. D., & Ostriker, J. P. 1978, ApJ, 221, L29
- Casares et al. (1993) Casares, J., Charles, P. A., Naylor, T., & Pavlenko, E. P. 1993, MNRAS, 265, 834
- Chaty et al. (2011) Chaty, S., Dubus, G., & Raichoor, A. 2011, A&A, 529, A3
- Díaz Trigo et al. (2013) Díaz Trigo, M., Miller-Jones, J. C. A., Migliari, S., Broderick, J. W., & Tzioumis, T. 2013, Nature, 504, 260
- Finke et al. (2008) Finke, J. D., Dermer, C. D., & Böttcher, M. 2008, ApJ, 686, 181
- Ghisellini et al. (2010) Ghisellini, G., Tavecchio, F., Foschini, L., et al. 2010, MNRAS, 402, 497
- Ghisellini et al. (2014) Ghisellini, G., Tavecchio, F., Maraschi, L., Celotti, A., & Sbarrato, T. 2014, Nature, 515, 376
- Hynes et al. (2009) Hynes, R. I., Bradley, C. K., Rupen, M., et al. 2009, MNRAS, 399, 2239
- Ikejiri et al. (2011) Ikejiri, Y., Uemura, M., Sasada, M., et al. 2011, PASJ, 63, 639
- Khargharia et al. (2010) Khargharia, J., Froning, C. S., & Robinson, E. L. 2010, ApJ, 716, 1105
- Kimura et al. (2016) Kimura, M., Isogai, K., Kato, T., et al. 2016, Nature, 529, 54
- Kotani et al. (1994) Kotani, T., Kawai, N., Aoki, T., et al. 1994, PASJ, 46, L147
- Kuulkers et al. (2015) Kuulkers, E., Motta, S., Kajava, J., et al. 2015, The Astronomer’s Telegram, 7647, 1
- Makino (1989) Makino, F. 1989, IAU Circ., 4782
- Marscher et al. (2008) Marscher, A. P., Jorstad, S. G., D’Arcangelo, F. D., et al. 2008, Nature, 452, 966
- Miller-Jones et al. (2009) Miller-Jones, J. C. A., Jonker, P. G., Dhawan, V., et al. 2009, ApJ, 706, L230
- Murase et al. (2014) Murase, K., Inoue, Y., & Dermer, C. D. 2014, Phys. Rev. D, 90, 023007
- Negoro et al. (2015) Negoro, H., Matsumitsu, T., Mihara, T., et al. 2015, The Astronomer’s Telegram, 7646, 1
- Nemmen et al. (2012) Nemmen, R. S., Georganopoulos, M., Guiriec, S., et al. 2012, Science, 338, 1445
- Piran (2004) Piran, T. 2004, Reviews of Modern Physics, 76, 1143
- Rachen & Mészáros (1998) Rachen, J. P., & Mészáros, P. 1998, Phys. Rev. D, 58, 123005
- Rodriguez et al. (2015) Rodriguez, J., Cadolle Bel, M., Alfonso-Garzón, J., et al. 2015, A&A, 581, L9
- Rybicki & Lightman (1979) Rybicki, G. B., & Lightman, A. P. 1979, Radiative Processes in Astrophysics (Wiley)
- Saito et al. (2015) Saito, S., Stawarz, Ł., Tanaka, Y. T., et al. 2015, ApJ, 809, 171
- Schmidt et al. (1992) Schmidt, G. D., Elston, R., & Lupie, O. L. 1992, AJ, 104, 1563
- Shahbaz et al. (2003) Shahbaz, T., Dhillon, V. S., Marsh, T. R., et al. 2003, MNRAS, 346, 1116
- Shahbaz et al. (2008) Shahbaz, T., Fender, R. P., Watson, C. A., & O’Brien, K. 2008, ApJ, 672, 510
- Shahbaz et al. (1994) Shahbaz, T., Ringwald, F. A., Bunn, J. C., et al. 1994, MNRAS, 271, L10
- Shidatsu et al. (2011) Shidatsu, M., Ueda, Y., Tazaki, F., et al. 2011, PASJ, 63, 785
- Sikora & Madejski (2000) Sikora, M., & Madejski, G. 2000, ApJ, 534, 109
- Tanaka et al. (2014) Tanaka, Y. T., Stawarz, Ł., Finke, J., et al. 2014, ApJ, 787, 155
- Tanaka et al. (2015) Tanaka, Y. T., Doi, A., Inoue, Y., et al. 2015, ApJ, 799, L18
- Tetarenko et al. (2015) Tetarenko, A., Sivakoff, G. R., Young, K., Wouterloot, J. G. A., & Miller-Jones, J. C. 2015, The Astronomer’s Telegram, 7708, 1
- Trushkin et al. (2015a) Trushkin, S. A., Nizhelskij, N. A., & Tybulev, P. G. 2015a, The Astronomer’s Telegram, 7667, 1
- Trushkin et al. (2015b) Trushkin, S. A., Nizhelskij, N. A., & Tsybulev, P. G. 2015b, The Astronomer’s Telegram, 7716, 1
- Turnshek et al. (1990) Turnshek, D. A., Bohlin, R. C., Williamson, II, R. L., et al. 1990, AJ, 99, 1243
- Uehara et al. (2012) Uehara, T., Toma, K., Kawabata, K. S., et al. 2012, ApJ, 752, L6
- Wagner et al. (1991) Wagner, R. M., Bertram, R., Starrfield, S. G., et al. 1991, ApJ, 378, 293
- Wolff et al. (1996) Wolff, M. J., Nordsieck, K. H., & Nook, M. A. 1996, AJ, 111, 856
| -band | -band | ||||
|---|---|---|---|---|---|
| MJD | PD (%) | PA (deg) | PD (%) | PA (deg) | Instrument |
| 57190 | (1.34/25) | (1.09/25) | – | – | Pirka/MSI |
| 57191 | (0.62/20) | (1.04/20) | – | – | Pirka/MSI |
| 57192 | (0.51/22) | (0.74/22) | – | – | Pirka/MSI |
| 57193 | (0.74/226) | (0.72/226) | – | – | Pirka/MSI |
| (0.24/16) | (0.29/16) | (1.45/14) | (1.73/14) | Kanata/HONIR | |
| 57194 | (0.58/44) | (0.32/44) | (0.78/24) | (0.69/24) | Kanata/HONIR |
| Parameter | Symbol | MJD 57193 | MJD 57194 |
| Break frequency [Hz] | |||
| Magnetic Field [G] | |||
| Size of emission region [cm] | |||
| Jet velocity [c] | |||
| Electron distribution normalization [electrons] | |||
| Electron Power-law Index | 2.2 | 2.2 | |
| Minimum Electron Lorentz Factor | |||
| Cutoff Electron Lorentz Factor | |||
| Maximum Electron Lorentz Factor | |||
| Synchrotron luminosity [] | |||
| SSC luminosity [] | |||
| Total radiation luminosity [] | |||
| Jet Power in Magnetic Field [] | |||
| Jet Power in Electrons [] | |||
| Jet Power in Cold Protons [] | |||
| Jet Radiative Efficiency [%] |