Tuning the critical magnetic field of the triplon Bose-Einstein condensation in
Abstract
The structure and magnetic interactions of the triplon Bose-Einstein condensation candidates Ba3Cr2O8 and Sr3Cr2O8 have been studied thoroughly in the literature, but little is known about a possible triplon condensation in the corresponding solid solution Ba3-xSrxCr2O8. We have prepared various members of this solid solution and systematically examined their magnetic properties in high magnetic fields up to and at low temperatures down to , by means of pulsed field and cantilever magnetometry. From these experiments for , we find that the critical fields of Ba3-xSrxCr2O8 decrease monotonically with decreasing Sr content . This change is in good agreement with the earlier reported variation of the magnetic interactions in these compounds.
I Introduction
Over the past two decades, spin dimer systems have been in the focus of intense research due to their exotic magnetic properties. Several spin dimer materials have been shown to exhibit a spontaneous increase of the magnetization upon cooling below a certain temperature in magnetic fields beyond a critical magnetic field . This spontaneous increase has been interpreted in terms of the Bose-Einstein condensation (BEC) of triplons.Nikuni et al. (2000) The longitudinal magnetization (i.e., the component parallel to the external magnetic field, which is associated with the condensate density) increases in such a way as one would expect it from an increase of the number of condensed bosons below in a typical BEC.Dell’Amore et al. (2008) Alternatively, increases, to first approximation, virtually linearly with at a fixed temperature . First discovered in TlCuCl3, this effect was found to take place in a number of compounds such as Pb2V3O9Waki et al. (2005), NiCl4SC(ND2)2Zapf et al. (2006) (DTN), BaCuSi2O6Jaime et al. (2004), Ba3Cr2O8Kofu et al. (2009a), and Sr3Cr2O8Aczel et al. (2009a). Especially the latter two materials have been examined in numerous investigations, both targeting their spin systemsKofu et al. (2009b); Aczel et al. (2009b, a); Grundmann et al. (2013, 2014) and their general electronic structure. Chapon et al. (2014); Kofu et al. (2009a); Lee and Whangbo (2006); Radtke et al. (2010) Ba3Cr2O8 and Sr3Cr2O8 are isostructural with a three-dimensional arrangement of Cr5+ dimers that feature a dominant intradimer interaction constant and weaker interdimer interactions . The crystal structure at room temperature can be described using the highly symmetric space group RmChapon et al. (2014); Kofu et al. (2009a) which leads to magnetic frustration of the spin system. Both materials undergo a Jahn-Teller induced structural phase transition upon cooling that lifts this magnetic frustration and strongly modifies the magnetic interactions in the system, thereby strengthening .Chapon et al. (2014) This phase transition has been shown to be gradually suppressed in the solid solution Ba3-xSrxCr2O8 for an intermediate Sr content .Grundmann et al. (2013) As this gradual suppression in turn strongly influences the magnetic interactions, exhibits a non-monotonous decrease from Sr3Cr2O8 to Ba3Cr2O8 with a minimum for around .Grundmann et al. (2014)
The critical magnetic field in these systems given by the spin gap ,Giamarchi et al. (2008) which in turn depends on the magnetic interaction constants and .Quintero-Castro et al. (2010) Thus, a change of should be accompanied by a corresponding modification of , thereby changing the dome-like phase boundary . However, no study of the critical fields of the solid solution Ba3-xSrxCr2O8 has been reported to date. To determine the dependence of the critical field on the Sr content, we examined several members of the solid solution Ba3-xSrxCr2O8 with at various temperatures. In this work, we describe the corresponding high-field magnetometry experiments and compare the resulting data for with the changes of the interaction constant and the reported phase diagram for pure Sr3Cr2O8.
II Experimental details
II.1 Synthesis
The samples were synthesized as polycrystalline powders using standard solid-state reaction schemes. Ba(NO3)2, Sr(NO3)2 and Cr(NO3)9H2O were mixed according to
dissolved in water and heated afterwards while continuously stirred to keep the mixture homogeneous. After evaporating the water, the remaining powder was ground and heated under flowing argon at 915 ∘C for 24 h to remove any excess water and NOx. The resulting oxide powders were ground again, pressed into pellets and sintered at 1100 ∘C for 48 h under flowing Ar.
II.2 Pulsed-field magnetometry
The data were obtained from magnetometry experiments in pulsed fields up to at the Hochfeld-Magnetlabor Dresden (HLD) of the Helmholtz-Zentrum Dresden-Rossendorf (HZDR). We used a standard 4He flow cryostat designed for temperatures down to . The samples were placed in a Teflon tube with no relevant magnetic background. To be able to compare our results directly to the heat capacity and magnetocaloric measurements of Aczel et al. on Sr3Cr2O8Aczel et al. (2009a), we first performed magnetometry experiments on a polycrystalline sample of pure Sr3Cr2O8. As our obtained values for agreed well with the published results, we proceeded to examine the susceptibility for additional samples with at temperatures between and . The magnetic field was determined by time-integration of the voltage induced by the magnetic field in a pick-up coil and applying a calibration factor provided by the HLD. The sample signal was observed using a set of compensated coils. This resulted in a pick-up voltage without the signal of the pulsed external field. The susceptibility was then obtained as the ratio of the two voltage signals . As no calibration of the pick-up signals has been performed, is not equal, but only proportional to the true sample susceptibility . However, for reasons of simplicity and as no absolute values of and are used in this work, we refer to as in the following. Measurements of the empty magnetometer did only yield a smooth, featureless background . Thus, no background correction was applied to the resulting data for any of the examined samples. For fields above T, the experimental noise was too large to perform a reliable numerical differentiation. Thus, only data for magnetic fields below T have been used for our analysis and are shown in this work.
II.3 Cantilever magnetometry
The data at temperatures below were obtained from cantilever magnetometry experiments for samples with at the High Field Magnet Laboratory (HFML) in Nijmegen. The used method is based on measuring the change of the capacitance between a reference plate and a BeCu cantilever with the sample attached as a function of the magnetic field. This change is due to a slight bending of the cantilever by the torque exerted on the sample in an external magnetic field. The capacitance was examined using a Andeen-Hagerling AH 2700A capacitance bridge and a Stanford Research SR830 lock-in amplifier and the field was applied perpendicular to the cantilever. As the samples were polycrystalline and thus very isotropic, no torque can be measured in the center of the field. Accordingly, the samples were placed outside the field center where the field exhibits a certain gradient. To improve the sensitivity at temperatures below , the samples were placed between and above the field center, depending on the desired maximum field.
Due to the geometry of the experiment, the magnetic moment of the sample can be calculated as , where is the capacitance of the cantilever setup, a constant factor and the sample position. As only relative changes of are considered in this work, the value of was not determined. The strength of the magnetic field and the gradient itself have been calculated based on the sample position and the measured current through the coils and using calibration curves provided by the HFML.
During several test measurements, the capacitance change was found to be antisymmetric with respect to the field center when placing the sample below or above. Thus, we are certain that changes of the capacitance signal are only due to variation of the sample magnetization. Similar to the case of the pulsed-field data, no background subtraction was conducted, as the BeCu cantilever itself only gives a negligible signal.
II.4 Analysis
As in the case of pure Sr3Cr2O8Aczel et al. (2009a), no hysteresis was found upon reversing the direction of the variation of for the triplon phase transition. Thus, our data analysis is based on the assumption that the triplon BEC is a second order phase transition, as expected. This implies a discontinuity in the second derivatives of the Gibbs free enthalpyNolting (2005). As the magnetization is the first derivative of the Gibbs enthalpy with respect to the external field, , a step-like feature should be observable in leading to a peak in . The position of the peak in is usually taken as the critical field (see below).Sebastian et al. (2005, 2007) The derivatives were numerically obtained as difference quotient with subsequent smoothing through a symmetric running average. The smoothing window was kept smaller than 40 of the full width at half maximum of the observed peak in , so that no significant additional broadening was introduced.
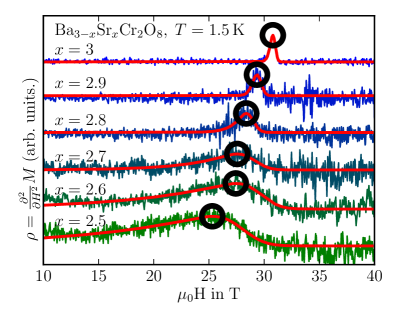
Determining the position of the peak in from the maximum value of the second numerical derivative of did not yield reliable results due to the significant noise level. The thus determined values of the critical field depended strongly on the chosen smoothing window. We have therefore decided to fit the peak in using a analytical function and determine from the maximum of this function. A common choice for fitting the peak in is a Gaussian function with a symmetric shape.Wulf et al. (2015) However, it became clear that our data are always slightly asymmetric with a tail towards lower fields, even for pure Sr3Cr3O8 (see, e.g., Fig. 1). This kind of asymmetry is not exclusive to Ba3-xSrxCr2O8, but can also be found in the compound NiCl4SC(ND2)2.Wulf et al. (2015). In our system, it becomes much more pronounced at high temperatures and especially for intermediate values of the Sr content . This temperature dependent asymmetry can be accomodated for by convoluting the Gaussian function by a temperature dependent exponential:
| (1) |
where is the complementary error function. The resulting fit to our data (with free parameters , and ) is excellent (see Fig. 1) and allows us to reliably determine the maximum of using numerical methods.
The critical fields were then taken as this maximum. The uncertainty of was defined by allowing the sum of the squared residuals, to be twice the optimal value.
III Results and Discussion
III.1 Comparison of at low temperatures
The first important result of our analysis is a change of the critical field as a function of the Sr content. In Fig. 1, we have plotted for as obtained from magnetometry experiments in pulsed fields up to 60 T at K. For all examined values of , can be well described using Eq. 1. The maximum of this function shifts towards lower magnetic fields for intermediate values of the Sr concentration , indicating a lowering of the critical field of the triplon condensation. In addition, the width of the peak increases drastically for intermediate stoichiometries, indicating a significant broadening of the transition. A similar, but less pronounced broadening of the antiferromagnetic transition has been be found in the solid solution of ungapped antiferromagnetic materials like jarositeGrohol and Nocera (2007). In the case of Ba3-xSrxCr2O8, we attribute this broadening to the increasing disorder that has been reported for this system.Grundmann et al. (2014)
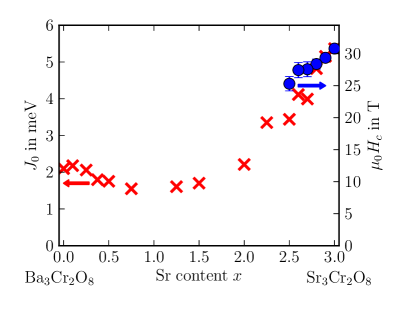
As described above, a change of the critical field can be induced by a corresponding variation of the magnetic interactions in the system. Such a variation of the intradimer interaction constant has been reported for Ba3-xSrxCr2O8 due the partial replacement of Ba by Sr.Grundmann et al. (2013) In Fig. 2, we compare this change with the variation of as a function of . As the trends for and coincide well for all examined values of , we conclude that the observed decrease of the critical fields at low temperatures can probably mainly be attributed to respective changes of the magnetic interactions.
III.2 Changes to the phase boundary
The simplest possible change of the phase boundary with varying would be a shift of the whole "dome" towards lower magnetic fields near the quantum critical point. However, our data show that this scenario does not hold for Ba3-xSrxCr2O8 and the changes to the phase boundary due to a change of the Sr content go beyond a simple shift towards lower magnetic fields. In Fig. 3, we have plotted the critical temperatures as functions of the magnetic field for Ba0.2Sr2.8Cr2O8, Ba0.1Sr2.9Cr2O8 and pure Sr3Cr2O8. The obtained phase boundaries do show a clear shift towards lower critical fields for temperatures below , in accordance with the reported change of the magnetic interaction constant .Grundmann et al. (2013) It should be noted, that besides a decrease of the intradimer interaction , any change of the interdimer interactions would also alter the triplon band, and change both the lower and upper critical fields accordingly. At present, no information about the upper critical field or about a change of the interdimer interactions in Ba3-xSrxCr2O8 as a function of is available. We note that the domes for and appear to be somewhat flatter than that for (see Fig. 3), which may be a consequence of a certain dependence of on or of the presence of disorder.
Changes in the magnetic phase diagram of quantum magnets due to variations in the chemical composition have indeed been explained based on various scenarios. A partial substitution of Ba by Sr very probably leads to structural disorderGrundmann et al. (2014) or even free defect spinsGrundmann et al. (2013) in the system. Such a chemical disorder has been suggested to lead to a Bose-Glass transition in Tl1-xKxCuCl3Yamada et al. (2011) and NiCl2-xBrx4SC(NH2)2 Yu et al. (2012) (Br-DTN), thereby reducing the critical field and changing the critical exponent. Such a reduction of is, as in the case of Br-DTN, often a simple consequence of a reduced spin gapPovarov et al. (2015). For Ba3-xSrxCr2O8 we cannot make such a comparison as detailed information about the dispersion relation of the triplons and thus a direct measure of the spin gap is not available at present. One of the most important features of a Bose-Glass is the finite compressibility, which translates to a finite magnetic susceptibility for and . The paramagnetic contributions due to free spins is too large in our samples to draw any decisive conclusion regarding the low field susceptibility of our samples, however. In any case, the magnetic phase boundary for a Bose-Glass of triplons should be tangential to the field axis for ,Fisher et al. (1989); Yamada et al. (2011) rather than perpendicular to it for a three-dimensional triplon BEC. Our data do not indicate such a behavior although measurements at even lower temperatures would be necessary for absolute confidence.
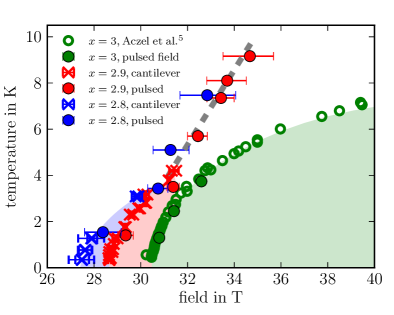
For temperatures above , our experimental data show peaks that do not fit to the expected dome-like shape of the phase boundary for the triplon-BEC transition. These features, marked by a straight dashed line in Fig. 3, are reminiscent of a phase boundary or crossover other than the appearance of a long range -order of the spin system. Such a behavior of has also been found in single crystals of pure Sr3Cr2O8.Aczel (2010) It has been suggested Zapf et al. (2014) that the closing of the spin gap can lead to similar features, e.g. in the traces when measuring the magnetocaloric effect of a gapped spin system.
We would like to point out that determining from the maximum of the observed of our samples is the common choice, but it may be not the only one. As described above, our data could be well fitted using Eq. 1. The term
can be interpreted as a Gaussian distribution of critical fields around an average critical field with variance that is given by the slight anisotropyKofu et al. (2009b) of the Landé g-value and local strain and crystal imperfections.Wulf et al. (2015) This distribution is then convoluted with an exponential decay
towards low magnetic fields. The fitting parameter gives the center of the Gaussian distribution. For a purely Gaussian fitting function, would thus be (and usually is) regarded as the actual critical field of the triplon condensation. Concordantly, we have plotted the critical field as obtained from the maximum of in comparison to in Fig. 4.
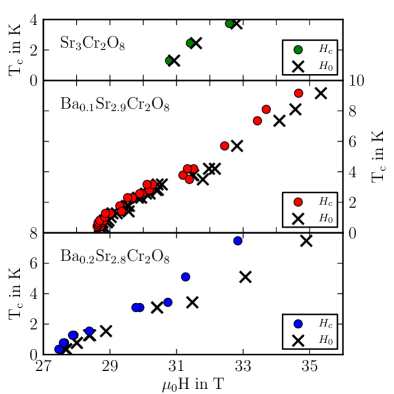
For all examined samples and temperatures, is larger than . However, for Sr3Cr2O8 and based on the literature values for the critical field for the triplon BEC, this difference is too small to decide whether or should be regarded as the actual critical field. The difference increases for higher temperatures and smaller values of the Sr content . However, both and decrease for decreasing values of in a similar fashion. Thus, the main result of a shifted phase boundary towards lower magnetic fields with decreasing does not depend on whether or is regarded as the actual critical field.
IV Summary
We have prepared polycrystalline samples of Ba3-xSrxCr2O8 based on standard solid state reaction schemes. Using pulsed field magnetometry and cantilever magnetometry experiments at temperatures down to , we observe a decrease of the critical field with decreasing Sr content . This decrease is in accordance with the reported change of the magnetic interaction constant as a function of . The observed changes in the magnetic phase diagram upon partial substitution of Sr by Ba may also be influenced by the presence of disorder, which will require further investigations.
V Ackowledgements
We thank Erik Wulf for stimulating discussions. We acknowledge the support of the HLD at HZDR, member of the European Magnetic Field Laboratory (EMFL). We also acknowledge the support of the HFML-RU/FOM, member of the European Magnetic Field Laboratory (EMFL). This work is part of the research programme of the Stichting voor Fundamenteel Onderzoek der Materie (FOM), which is financially supported by the Nederlandse Organisatie voor Wetenschappelijk Onderzoek (NWO). This work was supported by the Swiss National Science Foundation Grants No. 21-126411 and 21-140465.
References
- Nikuni et al. (2000) T. Nikuni, M. Oshikawa, A. Oosawa, and H. Tanaka, Phys. Rev. Let. 84, 5868 (2000).
- Dell’Amore et al. (2008) R. Dell’Amore, A. Schilling, and K. Krämer, Phys. Rev. B 78, 224403 (2008).
- Waki et al. (2005) T. Waki, K. Masaki, Y. Itoh, C. Michioka, K. Yoshimura, and T. Goto, Journal of Physics and Chemistry of Solids 66, 1432 (2005).
- Zapf et al. (2006) V. S. Zapf, D. Zocco, B. R. Hansen, M. Jaime, N. Harrison, C. D. Batista, M. Kenzelmann, C. Niedermayer, A. Lacerda, and A. Paduan-Filho, Phys. Rev. Lett. 96, 077204 (2006).
- Jaime et al. (2004) M. Jaime, V. F. Correa, N. Harrison, C. D. Batista, N. Kawashima, Y. Kazuma, G. A. Jorge, R. Stern, I. Heinmaa, S. A. Zvyagin, Y. Sasago, and K. Uchinokura, Phys. Rev. Lett. 93, 087203 (2004).
- Kofu et al. (2009a) M. Kofu, J.-H. Kim, S. Ji, S.-H. Lee, H. Ueda, Y. Qiu, H.-J. Kang, M. A. Green, and Y. Ueda, Phys. Rev. Lett. 102, 037206 (2009a).
- Aczel et al. (2009a) A. A. Aczel, Y. Kohama, C. Marcenat, F. Weickert, M. Jaime, O. E. Ayala-Valenzuela, R. D. McDonald, S. D. Selesnic, H. A. Dabkowska, and G. M. Luke, Phys. Rev. Lett. 103, 207203 (2009a).
- Kofu et al. (2009b) M. Kofu, H. Ueda, H. Nojiri, Y. Oshima, T. Zenmoto, K. C. Rule, S. Gerischer, B. Lake, C. D. Batista, Y. Ueda, and S.-H. Lee, Phys. Rev. Lett. 102, 177204 (2009b).
- Aczel et al. (2009b) A. A. Aczel, Y. Kohama, M. Jaime, K. Ninios, H. B. Chan, L. Balicas, H. A. Dabkowska, and G. M. Luke, Phys. Rev. B 79, 100409 (2009b).
- Grundmann et al. (2013) H. Grundmann, A. Schilling, C. A. Marjerrison, H. A. Dabkowska, and B. D. Gaulin, Mat. Res. Bull. 48, 3108 (2013).
- Grundmann et al. (2014) H. Grundmann, A. Schilling, M. Medarde, and D. Sheptyakov, Phys. Rev. B 90, 075101 (2014).
- Chapon et al. (2014) L. Chapon, C. Stock, P. Radaelli, and C. Martin, (arXiv:0807.0877v2, accessed April 14, 2014).
- Lee and Whangbo (2006) K.-S. Lee and M.-H. Whangbo, Inorg. Chem. 45, 10743 (2006).
- Radtke et al. (2010) G. Radtke, A. Saúl, H. A. Dabkowska, G. M. Luke, and G. A. Botton, Phys. Rev. Lett. 105, 036401 (2010).
- Giamarchi et al. (2008) T. Giamarchi, C. Rüegg, and O. Tchernyshov, Nature Physics 4, 198 (2008).
- Quintero-Castro et al. (2010) D. L. Quintero-Castro, B. Lake, E. M. Wheeler, A. T. M. N. Islam, T. Guidi, K. C. Rule, Z. Izaola, M. Russina, K. Kiefer, Y. Skourski, and T. Herrmannsdorfer, Phys. Rev. B 81, 014415 (2010).
- Nolting (2005) W. Nolting, Grundkurs Theoretische Physik 6: Statistische Physik (Springer Berlin Heidelberg New York, 2005).
- Sebastian et al. (2005) S. E. Sebastian, P. A. Sharma, M. Jaime, N. Harrison, V. Correa, L. Balicas, N. Kawashima, C. D. Batista, and I. R. Fisher, Phys. Rev. B 72, 100404 (2005).
- Sebastian et al. (2007) S. E. Sebastian, N. Harrison, C. Batista, L. Balicas, M. Jaime, P. Sharma, N. Kawashima, and I. Fisher, Journal of Magnetism and Magnetic Materials 310, e460 (2007).
- Wulf et al. (2015) E. Wulf, D. Hüvonen, R. Schönemann, H. Kühne, T. Herrmannsdörfer, I. Glavatskyy, S. Gerischer, K. Kiefer, S. Gvasaliya, and A. Zheludev, Phys. Rev. B 91, 014406 (2015).
- Grohol and Nocera (2007) D. Grohol and D. G. Nocera, Chem. Mater. 19, 3061 (2007).
- Yamada et al. (2011) F. Yamada, H. Tanaka, T. Ono, and H. Nojiri, Phys. Rev. B 83, 020409 (2011).
- Yu et al. (2012) R. Yu, L. Yin, N. S. Sullivan, J. S. Xia, C. Huan, A. Paduan-Filho, N. F. Oliveira Jr, S. Haas, A. Steppke, C. F. Miclea, F. Weickert, R. Movshovich, E.-D. Mun, B. L. Scott, V. S. Zapf, and T. Roscilde, Nature 489, 379 (2012).
- Povarov et al. (2015) K. Y. Povarov, E. Wulf, D. Hüvonen, J. Ollivier, A. Paduan-Filho, and A. Zheludev, Phys. Rev. B 92, 024429 (2015).
- Fisher et al. (1989) M. P. A. Fisher, P. B. Weichman, G. Grinstein, and D. S. Fisher, Phys. Rev. B 40, 546 (1989).
- Aczel (2010) A. A. Aczel, Ph.D. thesis, McMaster University (2010).
- Zapf et al. (2014) V. Zapf, M. Jaime, and C. D. Batista, Rev. Mod. Phys. 86, 563 (2014).