Proton configurations in the hydrogen bonds of KH2PO4 as seen by resonant x-ray diffraction
Abstract
KH2PO4 (KDP) belongs to the class of hydrogen-bonded ferroelectrics, whose paraelectric to ferroelectric phase transition is driven by the ordering of the protons in the hydrogen bonds. We demonstrate that forbidden reflections of KDP, when measured at an x-ray absorption edge, are highly sensitive to the asymmetry of proton configurations. The change of average symmetry caused by the ’freezing’ of the protons during the phase transition is clearly evidenced. In the paraelectric phase, we identify in the resonant spectra of the forbidden reflections a contribution related to the transient proton configurations in the hydrogen bonds, which violates the high average symmetry of the sites of the resonant atoms. The analysis of the temperature dependence reveals a change of relative probabilities of the different proton configurations. They follow the Arrhenius law and the activation energies of polar and Slater configurations are 18.6 and 7.3 meV respectively.
pacs:
61.05.cp,61.05.cj,78.70.Ck,78.70.DmI Introduction
Although potassium dihydrogenphosphate (KH2PO4, hereafter KDP) was one of the first discovered ferroelectric materials Jona and Shirane (1993), the microscopic mechanism at play during its ferroelectric phase transition has been one of the most difficult to understand. The crystals of the KDP family belong to the class of hydrogen-bonded ferroelectrics, in which protons play an important role: their PO4 molecular units are linked by hydrogen bonds, and ferroelectricity appears to be connected to the behaviour of the protons in these bonds. The generic theoretical framework describing the hydrogen-bonded ferroelectrics was introduced by Slater Slater (1941): the static and dynamic properties of these systems are described on the basis of the configuration energy determined by proton configurations (Fig. 1). In Slater’s model, each proton occupies one of two possible crystallographic positions in its bond. In the paraelectric phase, both positions are equivalent and randomly occupied, while in the ferroelectric phase one of the positions is favoured, according to the local ferroelectric polarisation. The ferroelectric transition appears thus as a classical order-disorder phase transition Slater (1941); Takagi (1948a); Senko (1961). Intensive experimental and theoretical investigation has confirmed this model Strukov et al. (1974). The proton ordering at the phase transition has been evidenced and correlated with atomic displacements along the -axis at the origin of the electric polarisation Nelmes et al. (1985). To explain the large effect of deuteration on the transition, Blinc suggested that, instead of a static proton disorder, protons are in fact delocalised and tunnel back and forth between both sites of a double-well potential Blinc (1960). Since then, the nature of the phase transition, either order-disorder or confinement-deconfinement, has been much debated (see, e.g., reviews by Schmidt Schmidt (1987), Tokunaga & Matsubara Tokunaga and Matsubara (1987) and Lines & Glass Lines and Glass (2001)). Geometrical effects have been suggested as an alternative to tunnelling to explain the modification of the phase transition of deuteration Ichikawa (1981); Ichikawa et al. (1987). Nowadays there is growing evidence for a combination of both effects Nelmes (1988); Bussmann-Holder and Michel (1998). Indeed, recent ab initio calculations Koval et al. (2002, 2005) confirm the interplay of geometrical and tunneling effects, and provide a more accurate view of the tunneling mechanism, which involves not only protons but larger clusters including heavy atoms. Experimentally, recent neutron Compton scattering experiments have shown strong evidence for the deconfinement of the protons in the paraelectric phase Reiter et al. (2002). While the role of the protons during the phase transition is now well established, not much attention has been given to their behaviour in the paraelectric phase. In particular, a number of different proton configurations have been proposed Slater (1941); Takagi (1948b) and are expected to coexist with different probabilities, but a quantitative experimental evaluation of their probabilities is still lacking.
In the present paper, we report on a spectroscopic study of the forbidden reflections of KDP with resonant x rays. We recently demonstrated that such forbidden reflections show spectacular effects across the phase transition Beutier et al. (2014). Here we go further by carefully modeling the spectra and their temperature dependence in the paraelectric phase; we determine the relative probabilities of various proton configurations and show that they change with temperature. Recently, a similar effect has been studied in rubidium dihydrogen phosphate (hereafter RDP), whose structure is isomorphic to that of KDP Richter et al. (2014). Due to the limited number of data sets and the limited temperature range, only one particular proton configuration (the so-called Slater configuration - see below) was evidenced. Here, by studying two different types of forbidden reflections (the and reflections) at two different azimuths and over a large temperature range, we are able to extract the contributions of all three main proton configurations. To this purpose, we present a methodology to deal quantitatively with the influence of defects in resonant elastic x-ray scattering (REXS), the scope of which goes well beyond the particular case of KDP.
II Forbidden reflections in the para- and ferroelectric phases
II.1 General structure factor for the forbidden reflections
The paraelectric-ferroelectric phase transition of KDP occurs at the Curie temperature K. The paraelectric and ferroelectric phases have, respectively, body-centered tetragonal (, ) and face-centered orthorhombic (, ) systems, and ferroelectricity appears along the -axis. In the paraelectric (tetragonal) phase of KDP, each proton tunnels back and forth between two sites of equal probabilities related by symmetry. The disordered distribution of each proton between two oxygen atoms of the hydrogen bond has been confirmed by neutron diffraction Nelmes et al. (1982). The description of the paraelectric phase by the group corresponds to the structure averaged over the proton distribution.
The usual settings used for the description of the ferro- and paraelectric phases differ by a rotation of 45∘ around the axis accompanying a doubling of the unit cell. Below we shall use the settings which correspond to the paraelectric (disordered) phase 111unlike in Ref. Beutier et al., 2014. In these settings, Bragg reflections with Miller indices such that are forbidden in conventional x-ray diffraction in both phases, due to a glide-plane symmetry. However they appear with significant intensity when the energy of the incoming x rays is tuned close to an absorption edge, due to the anisotropy of the tensor of scattering Dmitrienko (1983): indeed we recently reported the observation of the and reflections at the potassium K edge Beutier et al. (2014). We showed that the intensity and the energy spectra of these reflections undergo huge changes across the phase transition, because the electric dipole-dipole (E1E1) resonant scattering vanishes in the higher symmetry (tetragonal) phase.
The general structure factor of the Bragg reflections with Miller indices , , is equal to
| (1) |
where and are the atomic scattering factors of two potassium atoms related by a glide plane symmetry, for instance those with coordinates and . Both atoms have essentially the same atomic scattering factors off-resonance, but they become highly sensitive to the local anisotropy when the incident x rays excite one of their electronic transitions, providing a sizable difference of atomic scattering factors, which in turn allows for the existence of these pure resonant forbidden reflections.
II.2 Resonant elastic x-ray scattering
REXS is usually described by a series of electric multipoles. In the following, Cartesian tensors will be used to describe the x-ray polarisation dependence of the atomic scattering factors and of their structure factors. The atomic scattering factor, expanded up to the quadrupolar terms, can be written Blume (1994):
| (2) |
with the implicit sum over the indices . The tensors , , and stand for the electric dipole-dipole (E1E1), dipole-quadrupole (E1E2), and quadrupole-quadrupole (E2E2) resonances, respectively. and , on one hand, and and , on the other hand, are the incident and scattered wave vectors and polarisation states. In the following we will use the usual decomposition of the x-ray polarisation onto the basis vectors and , respectively perpendicular and parallel to the scattering plane. We shall also use and .
The E1E1 term, described by the second-rank tensor , is usually largely dominant. This is the case in the ferroelectric phase, in which the twofold axial symmetry of the resonant site allows for a non vanishing tensor component () in the structure factor. But, in the paraelectric phase, the twofold axis turns into a pseudofourfold axis (symmetry ), cancelling all off-diagonal elements of symmetric second-rank tensors such as : the glide-plane extinction rule still applies Beutier et al. (2014).
In the absence of E1E1 contribution, weaker terms become important. The E1E2 and E2E2 terms, described by the third-rank tensor and the fourth-rank tensor respectively, are the most obvious candidates, and a symmetry analysis shows that they actually do not vanish at the forbidden reflections considered here. We will nevertheless ignore the E2E2 term, which is believed to be much weaker than the E1E2 term in this case, based on spectroscopic calculations with the code FDMNES Bunau and Joly (2009); fdm , and cannot account for the temperature dependence reported below.
The E1E2 term (as well as the E2E2 term) is essentially temperature-independent, despite the small variation of the crystal structure in absence of phase transition Oreshko et al. (2012), and cannot account for the temperature dependence of forbidden reflections in Ge, ZnO and GaN, in which the E1E1 term also vanishes Kokubun et al. (2001); Kirfel et al. (2002); Collins et al. (2003); Beutier et al. (2012): in these systems, the intensity of forbidden reflections increases with temperature, despite the Debye-Waller effect, and the intensity growth is accompanied by a change of spectrum that can only be explained by interference with a second scattering process Collins et al. (2003); Beutier et al. (2012). The latter was ascribed to thermal-motion induced (TMI) scattering Dmitrienko and Ovchinnikova (2000). This mechanism is also expected in KDP. Similarly to what has been done for Ge, ZnO, and GaN, we will assume that the main contribution to the TMI term comes from the displacement of the resonant ion. The TMI structure factor can be written Dmitrienko and Ovchinnikova (2000):
| (3) |
where is the displacement of the resonant atom (potassium in our case), and the implicit sum over indices and is assumed. The right part of (3) is valid for (at least) orthorhombic point symmetry, which is the case here. The mean-square components provide the temperature dependence of this term. We define for the following the TMI third-rank tensor as:
| (4) |
such that is intrinsic to the material and couples with the beam according to .
It will be shown below that the E1E2 and TMI terms alone cannot explain the experimental results in KDP. We need to consider an additional contribution to the resonant atomic factor, which is provided by transient proton configurations Mukhamedzhanov et al. (2010); Richter et al. (2014): protons occupy only half of their crystallographic positions and, in the paraelectric phase, each of them tunnels back and forth between both sites of a double-well potential at a jump rate of the order of s-1 Sugimoto and Ikeda (1996). Because the waiting time between jumps is larger by several orders of magnitude than the typical time of x-ray resonant scattering (s), x-rays "see" the crystal as a series of snapshots, producing an effect similar to thermal motion and static disorder Dmitrienko and Ovchinnikova (2000). Each transient proton configuration violates the crystal symmetry, but the space symmetry restores after averaging over all possible proton configurations. A given proton configuration induces a relaxation of the structure. The displacement of the resonant atom from its high-symmetry site is accompanied by a correction to the resonant scattering factor which is dominated by the E1E1 contribution . Similarly to the case of TMI scattering Dmitrienko and Ovchinnikova (2000), it contributes to the resonant structure factor with the partial contribution :
| (5) |
We can consider the global contribution of transient proton configurations as the coherent sum of the configurations with probabilities ,
| (6) |
Let us note that a given configuration yields a nonzero contribution only if it induces a local structure relaxation which displaces the resonant atom from its high-symmetry site.
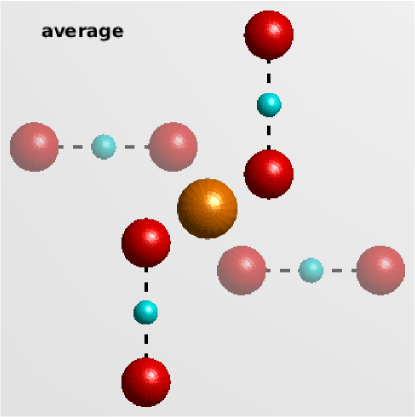
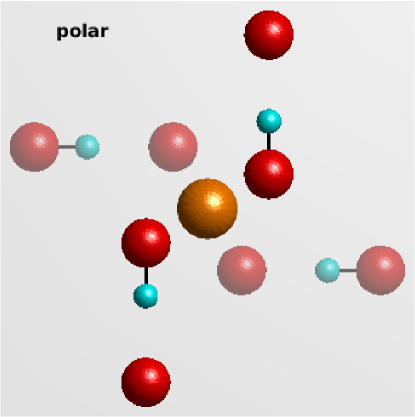
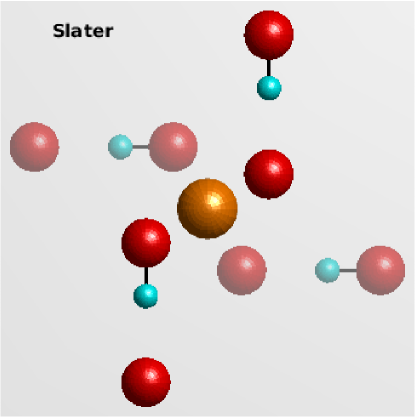
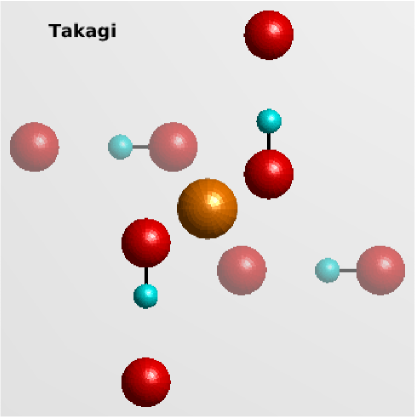
In the following, we will consider only three asymmetric proton configurations, which were proposed by Slater Slater (1941) and Takagi Takagi (1948b): the polar (), Slater (), and Takagi () configurations (Figure 1). In the polar and Slater configurations, there are two protons near each group, filling half of the four available sites. In the Takagi configurations, three protons are attached to one group and only one proton is attached to a neighbour group. In fact each of these three configurations may be decomposed into two similar and equiprobable configurations ( and , and , and ) whose sum entirely fills the crystallographic sites of the protons. In the following, we consider their contribution by pairs, i.e., , etc. Additionally, one should also consider the case of fully symmetrical configurations, when a PO4 group is surrounded by either 0 or 4 protons. Due to their high symmetry, these configurations contribute to the dipole-quadrupole term only, and not to any extra term.
Altogether, the third-rank resonant atomic factor in the paraelectric phase of KDP can thus be considered as the sum of five terms:
| (7) |
II.3 Formalism of the structure factor in the paraelectic phase
The formalism below applies only to the paraelectric phase of KDP, when the resonant atoms occupy the crystallographic sites with symmetry, i.e., the potassium (the experimental case presented here) or the phosphorus atoms.
Any third-rank tensor with point group symmetry admits six independent tensor components Authier (2003), but only three of them change sign under the glide-plane symmetry and contribute to the structure factor (1) of the forbidden reflections of the type with : =-, =-, and . It has been demonstrated Mukhamedzhanov et al. (2010) that the structure factor (1) of the dipole-quadrupole resonant scattering as well as those of the other resonant contributions considered in this paper can be written in the following matrix form:
| (8) |
where , .
Except for the dipole-quadrupole term, all terms of Eq. 7 are of E1E1 resonance origin and are thus symmetric over permutation of the polarisation indices (): thus only the dipole-quadrupole term may contribute to the antisymmetric part .
It follows from Eq. 8 that different forbidden reflections can have different energy spectra, since several independent tensor components are involved in the structure factor. In more detail, reflections are provided by the component and the antisymmetric component , while reflections are determined by the components and (i.e., and ). All three components contribute to the structure factor of forbidden reflections.
III Experimental
A single crystal of KDP was grown and cut with surface normal 001 at the Institute of Crystallography (Moscow). REXS was measured at beam line BM28 (XMaS) of the European Synchrotron Radiation Facility, with preliminary measurements and fluorescence measurements performed at beam line I16 of Diamond Light Source Collins et al. (2010). The sample was enclosed in a closed-cycle cryofurnace and the temperature varied between 15 and 320 K. The and forbidden reflections were measured at the potassium K edge (3.608 keV). The measurements were performed in vertical scattering geometry with the natural linear () polarisation of the incoming beam and without polarisation analysis of the scattered beam. The azimuthal reference is the 100 axis and the azimuth is zero when the azimuthal reference is in the scattering plane. KDP is known to suffer from radiation damage, and so great care was taken to ensure the reproducibility of the results presented here. Indeed, we observed radiation damage during the preliminary measurements at beamline I16 when the incident beam was insufficiently attenuated.
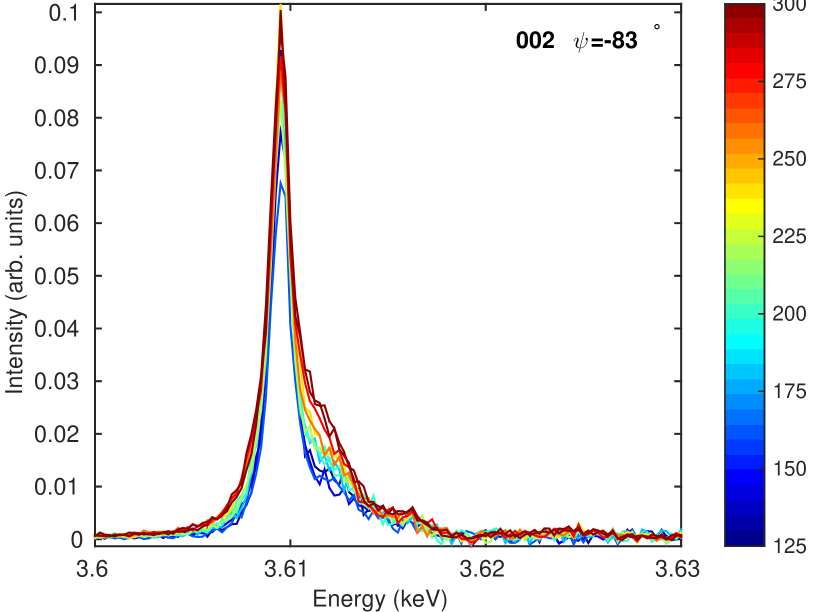
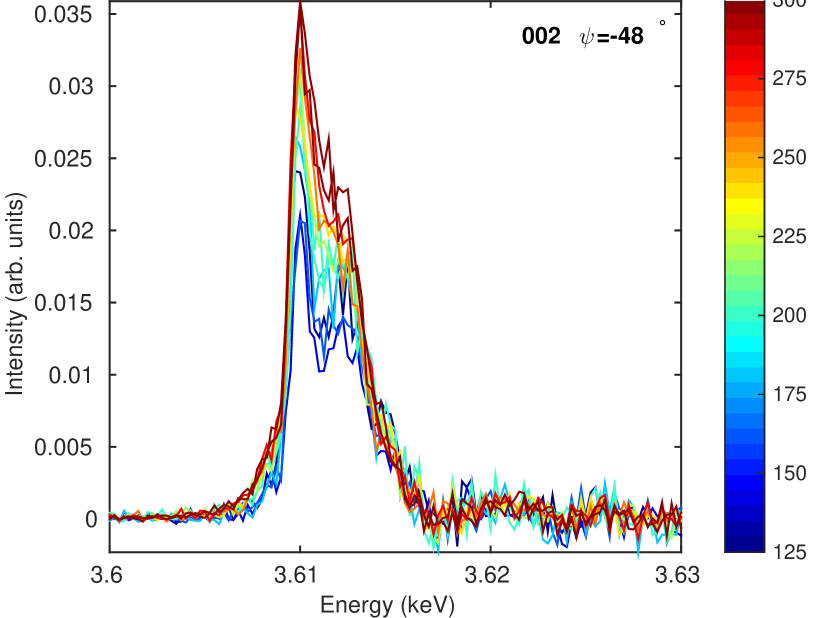
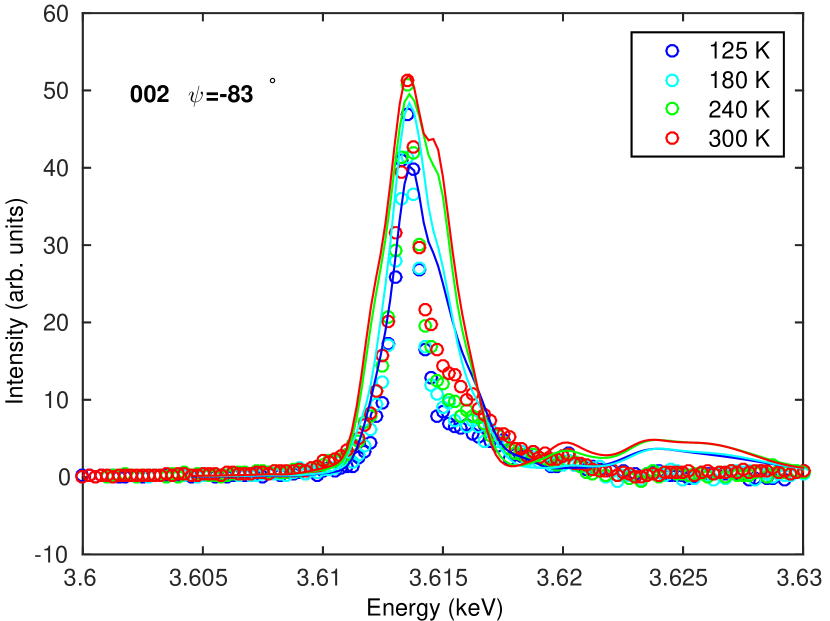
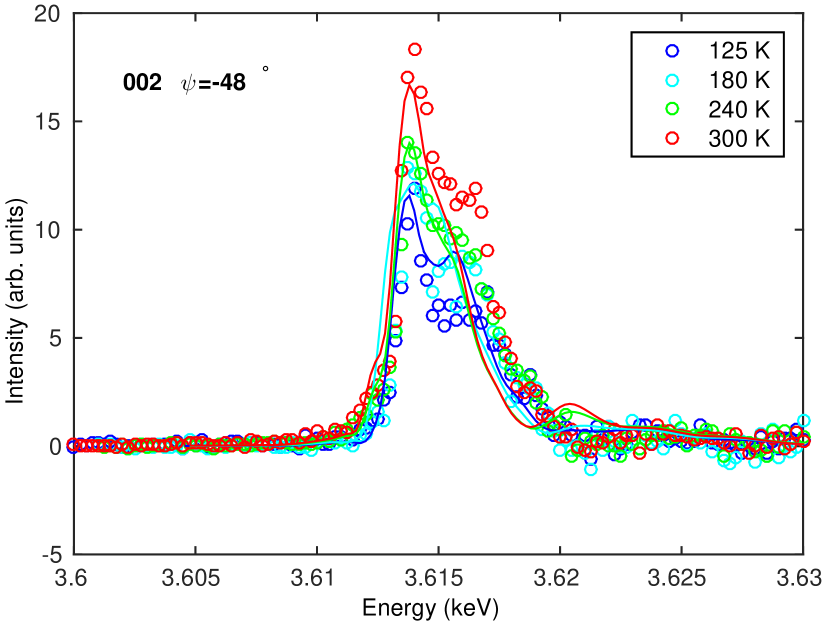
Rocking curves were recorded at 3.6095 keV and showed a Lorentzian shape with a varying width as a function of the temperature Beutier et al. (2014). Energy spectra were recorded in the same temperature loop and were corrected for the fluorescence background and for the varying ratio between integrated intensity and peak intensity of the rocking curves. The corrected spectra are shown in Fig. 2.
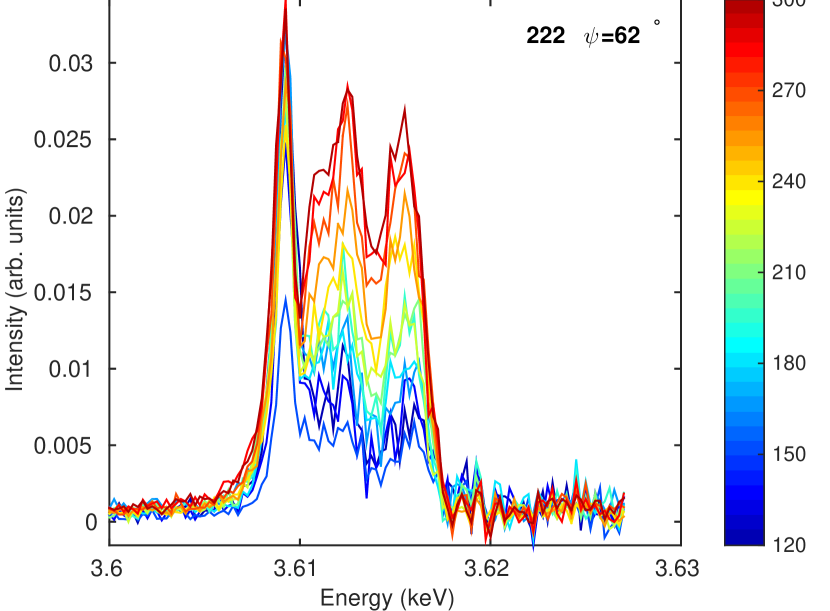
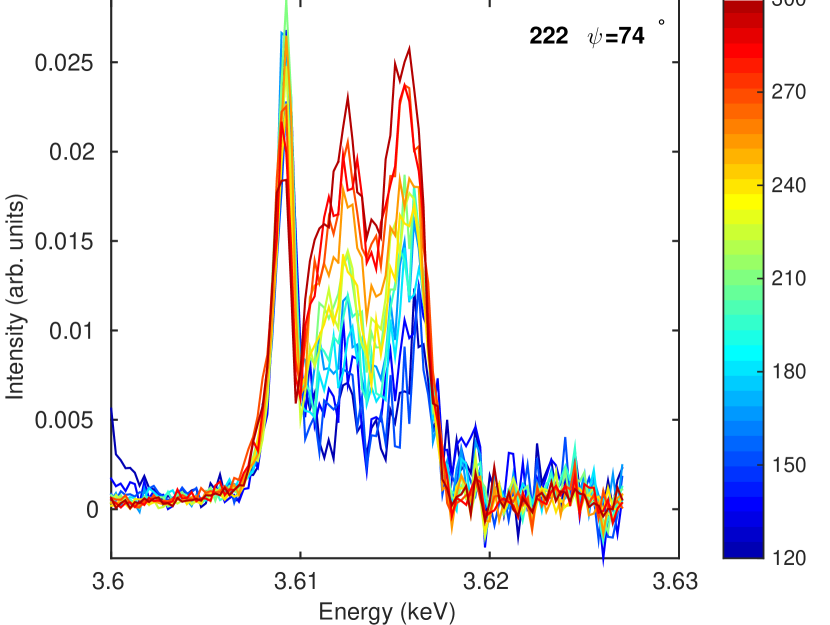
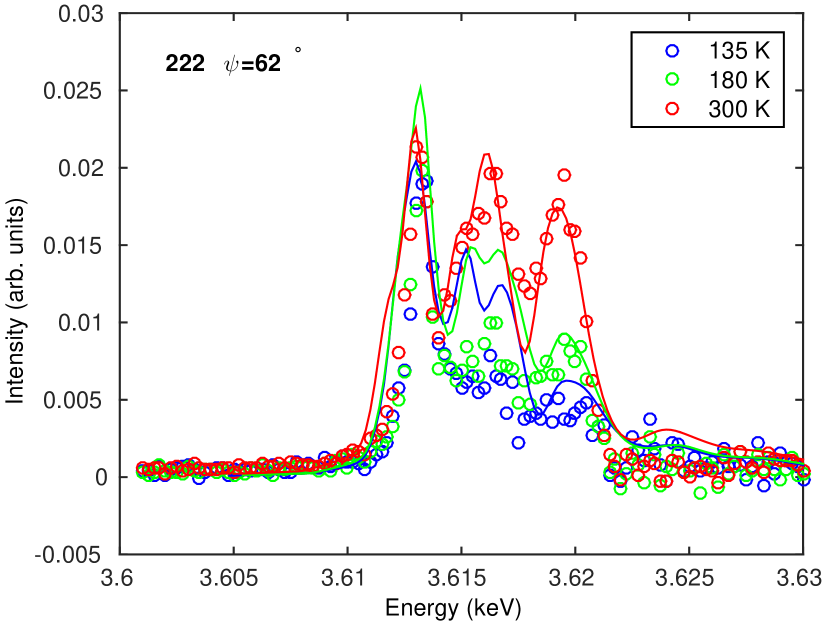
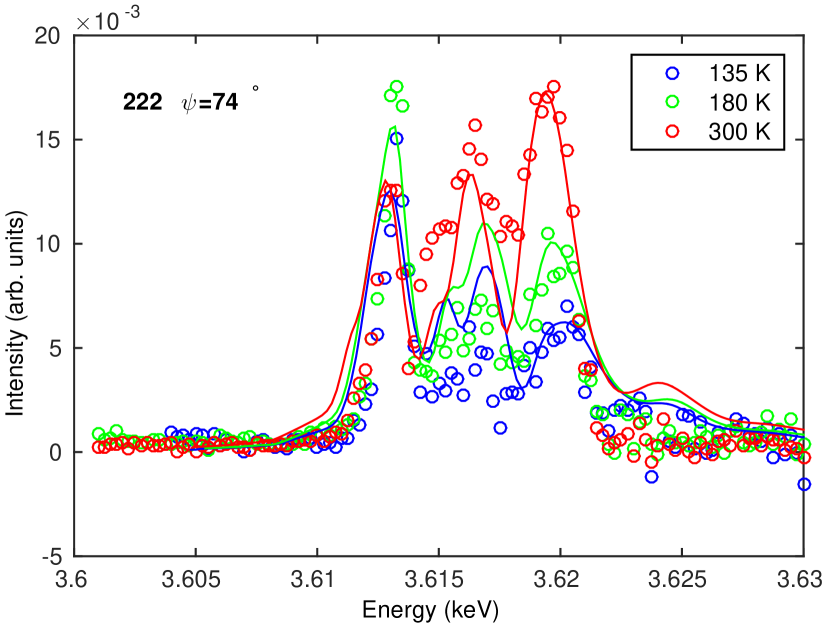
As reported in Beutier et al. (2014), a spectacular change of spectrum and intensity can be seen across the phase transition ( K), due to the switching on/off of the pure electric dipole (E1E1) component: the latter vanishes in the tetragonal phase for symmetry reasons Beutier et al. (2014); Mukhamedzhanov et al. (2010). In this paper we focus on the tetragonal phase, whose energy spectra show interesting features in their temperature dependence. Looking at the 002 reflection, we see that (1) the spectrum changes with azimuth, meaning that more than one independent component contributes to the structure factor, in agreement with the symmetry analysis presented in Sec. II; (2) the spectra at both azimuths change with temperature, revealing the contribution of more than one scattering process, with different temperature dependences (presumably one of them is independent of the temperature); and (3) the change of spectrum is stronger at than at . The case of the 222 reflection is less spectacular but essentially shows the same features. We note that both reflections have very different spectra, pointing at a very different mix of the contributing amplitudes.
IV Data analysis
An analysis of the ferroelectric phase can be found in Appendix B. Here we deal only with the paraelectric phase.
The structure amplitude (8) of forbidden reflections involves three independent complex tensor components: they interfere in the intensity and it is thus impossible to extract them directly from the four measurements (two reflections at two azimuths). The analysis of the experimental spectra is therefore based on modelling with the FDMNES code Bunau and Joly (2009); fdm . The latter calculates resonant scattering amplitudes based on an input crystallographic configuration. One should thus be able to evaluate several parameters of the crystallographic configuration, such as thermal motion and the relative probabilities of the various proton configurations, by trying to fit the experimental spectra.
In more details, we calculate the amplitudes and , which are the values of the structure factor (8) for incident polarisation and scattered polarisation and respectively. The calculations are performed with the multiple scattering method of FDMNES Joly (2001), using the convolution parameters obtained from the fits of the absorption spectra (see Appendix A).
IV.1 Self-absorption correction
In the kinematical theory of diffraction, the integrated intensity measured in Bragg geometry from a thick sample, with incident polarisation and no polarisation analysis of the scattered beam, is proportional to
| (9) |
where and are the polarisation-dependent absorption coefficients of the incident and outgoing beams respectively, is a geometrical factor given by the incident angle and exit angle with respect to the sample surface, and is the Debye-Waller factor. This expression takes into account the anisotropic absorption of the material, provided it is small enough so that the polarisation of x-rays is not modified along the propagation. In the following we will use a single absorption coefficient instead of three distinct ones, leading to the simplified expression:
| (10) |
The anisotropic character of the material is reflected by the choice of , which is chosen differently for different reflections and different azimuths. For instance, for the reflection, which is parallel to the tetragonal axis, , where is the absorption coefficient for a beam with polarisation perpendicular to the tetragonal axis, is a good approximation (for all azimuths), since in this particular case . On the other hand, for the 222 reflection at the azimuths reported here, it turns out that , where is the isotropic part of the linear absorption coefficient, is a reasonable approximation.
IV.2 Model of the resonant scattering amplitudes
According to the model described in Sec. II, the resonant scattering factor is the sum of the dipole-quadrupole, TMI and various PC contributions [Eq. (7)]. Methods to calculate the various contributions to the atomic scattering factor were developed in previous works Ovchinnikova et al. (2010); Richter et al. (2014). It is, however, easier to work directly on the structure amplitudes, which are a linear function of the tensor components of the atomic scattering factor (equation 8). We can write:
| (11) |
where the (, ) are the structure factors of the various contributions projected onto the polarisation states according to equation 8. We will justify below that the temperature dependence can be fully accounted for in the coefficients, which in turn are independent of the other parameters. In the case of the contributions of the proton configurations, the coefficients are proportional to the probability of the corresponding configurations.
The dipole-quadrupole (E1E2) contribution can be calculated directly from the average crystal structure with FDMNES, while preliminary modelling is required for the other terms. Ab initio calculations showed that its spectrum in the wurtzites is essentially temperature independent Oreshko et al. (2012). In the case of KDP, we find the same result, using the temperature-dependent structure proposed in Ref. Nelmes et al., 1982. Nevertheless, we allow for a global temperature-dependent scaling factor , which accounts for a small dependence of the E1E2 term on atomic positions.
IV.3 Model of TMI scattering
The TMI contribution to the resonant structure factor was calculated with the same method as that developed for Ge and the wurtzites Ovchinnikova et al. (2005, 2010), which has been validated by ab initio calculations Oreshko et al. (2012). We simulated a supercell in which all atoms were randomly displaced from their average positions. The displacement amplitudes were chosen according to the data given in Ref. Nelmes et al., 1982 for 125 K. This model neglects the correlations between the displacements of the various atoms. Therefore it yields similar results to a model taking into account the displacements of the resonant atoms alone. In this approximation, the TMI contribution to the atomic factor depends linearly on the displacements of the resonant atom, which are supposed to be isotropic. Moreover the calculations of the TMI spectrum show that its lineshape does not change with temperature, so that the temperature plays only as a global scalar on the spectrum. This point has been demonstrated with ab initio calculations in the case of ZnO and GaN Oreshko et al. (2012). We can thus consider the TMI contribution as the product of a temperature-independent spectrum and a temperature-dependent scalar coefficient .
IV.4 Model for the contribution of the proton configurations
A method to calculate the PC contributions has been reported Richter et al. (2014): it consists of calculating the various tensor components for each configuration according to Eq. (5) after relaxing the structure in the chosen configuration. After the calculation of the , phenomenological expressions describing the azimuthal dependence of the reflections are derived and used to fit the experimental data. This approach gives satisfactory fits to the experimental data.
In order to improve the spectra description we present here another method to simulate the energy spectra, which we believe is more reliable because all calculations are made in the same FDMNES calculation and there is no necessity to use phenomenological expressions. Instead of modelling the Cartesian components , we directly calculate the structure amplitudes of the forbidden reflections as a sum of several contributions. Similarly to the method applied in Ref. Ovchinnikova et al., 2010 we suppose that each contribution to the scattering amplitude may be considered as a temperature-independent spectrum () multiplied by a temperature-dependent coefficient . To calculate the PC contributions, we have constructed supercells, where all protons occupy the same configuration chosen among the , , and configurations. Here we consider the proton configurations as independent static defects. The ab initio code VASP Kresse and Furthmuller (1996); Kresse and Joubert (1999) was used to compute the relaxation of the structure for the chosen proton configuration and obtain new atomic coordinates. The resulting coordinates are slightly different inside each pair of configurations. Of particular interest is the displacement of the resonant atom. These calculations were made for each temperature, taking into account the change of lattice parameters and of the spacing between the two proton sites of the H-bond, in correspondence with the data given in Ref. Nelmes et al., 1982. The variation of obtained in the 125-300 K range does not exceed 5 for the three types of proton configurations considered here and provides similarly weak variations of . The variation is essentially a global scaler of the spectrum with a linear dependence in temperature. It supports our model, in which each contribution is assumed to be independent of the temperature, provided the global dependence is included in the coefficient . Then the spectra corresponding to each configuration are calculated with FDMNES, using the relaxed structures. The coefficients are obtained by fitting the experimental data at each recorded temperature.
IV.5 Spectral contributions and fits
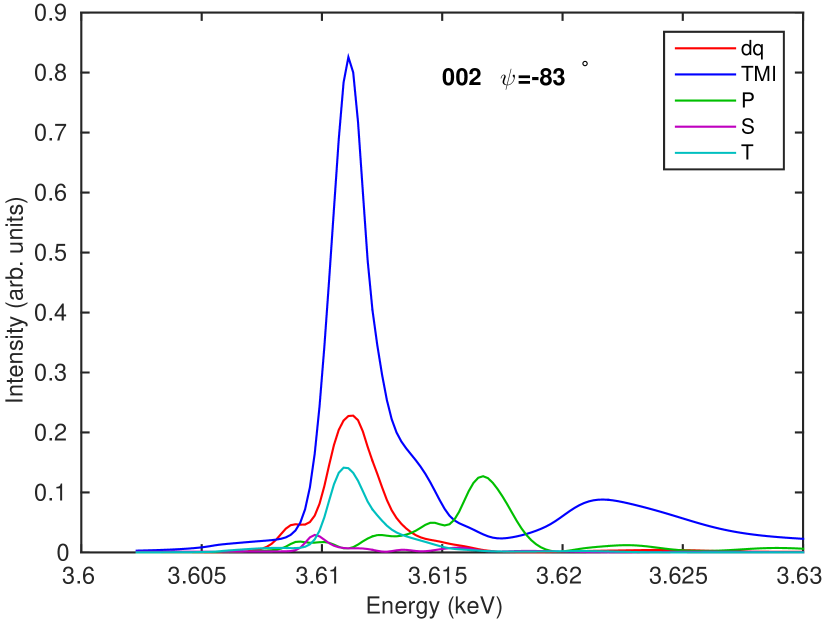
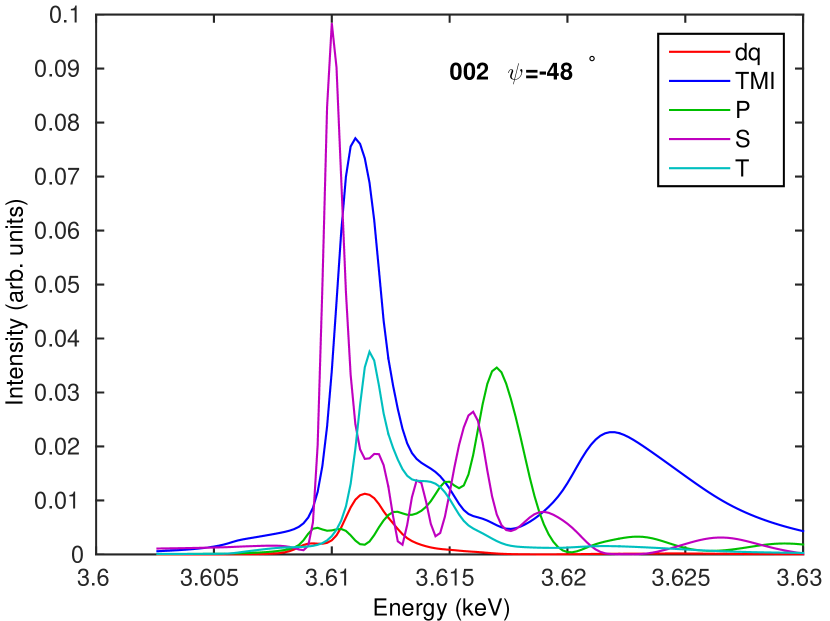
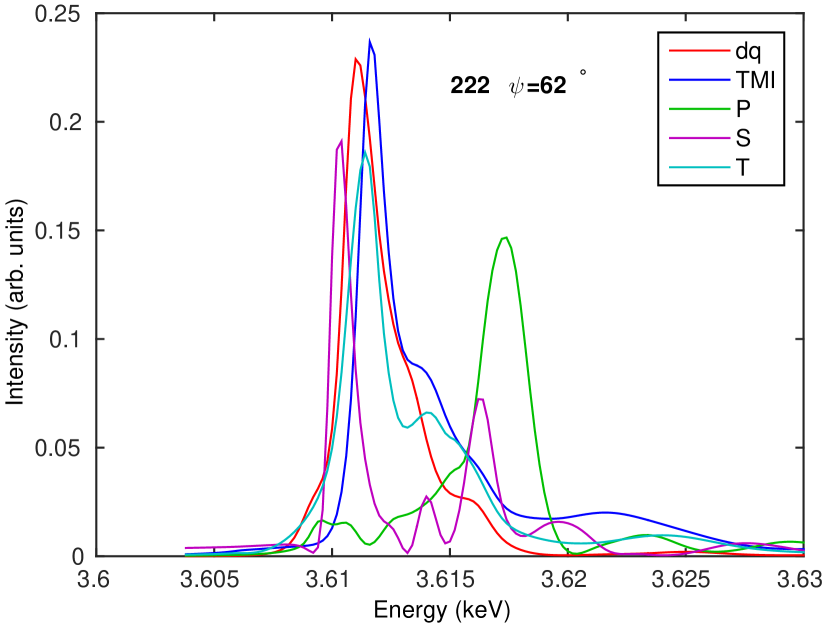
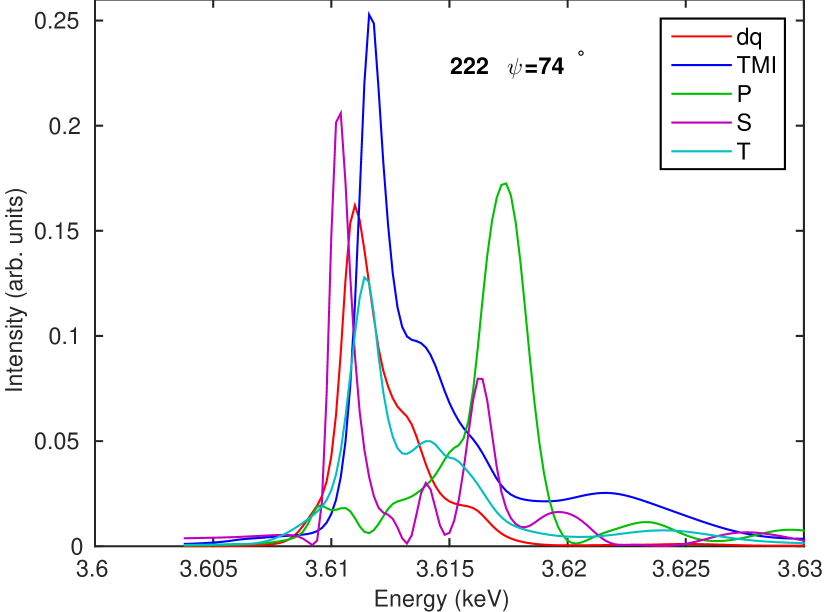
For each temperature, we have four experimental energy spectra: two reflections at two different azimuths each. The four scalar parameters of the model can thus be reliably determined by fitting the experimental spectra. The task is simplified because all contributions possess different energy dependences: it is more or less obvious which contribution is responsible for different parts of the energy spectra. This is shown in Fig. 3, which presents the contributions for the and reflections each for two azimuthal angles at 300 K. We see that the dipole-quadrupole, TMI, and Takagi configurations contribute in the structure factor mainly in the lower part of the energy spectra, while the higher-energy side is mainly provided by the polar and Slater configurations. Moreover, the dipole-quadrupole and TMI contributions predominate in the reflection, while the PC contributions become more important in the reflection.
Nevertheless, the intensity spectra of the forbidden reflections are not simple sums of these partial intensity spectra, but are determined by the interference between the complex amplitudes. By fitting the experimental spectra against Eqs. (10) and (11), we obtained the coefficients .
In Ref. Richter et al., 2014, only the Slater configurations were evidenced: the polar configurations were found to contribute to the experimental spectra and the Takagi configurations were neglected due to their higher energy. In the case of KDP, it turns out that all three types of configurations are needed to explain the experimental spectra, which are much more complex than those of RDP. However, the line shape of the Takagi configurations cannot easily be disentangled from that of the TMI and polar configurations. While they provide a sensible improvement of the fits, their coefficient lacks reliability.
IV.6 Results
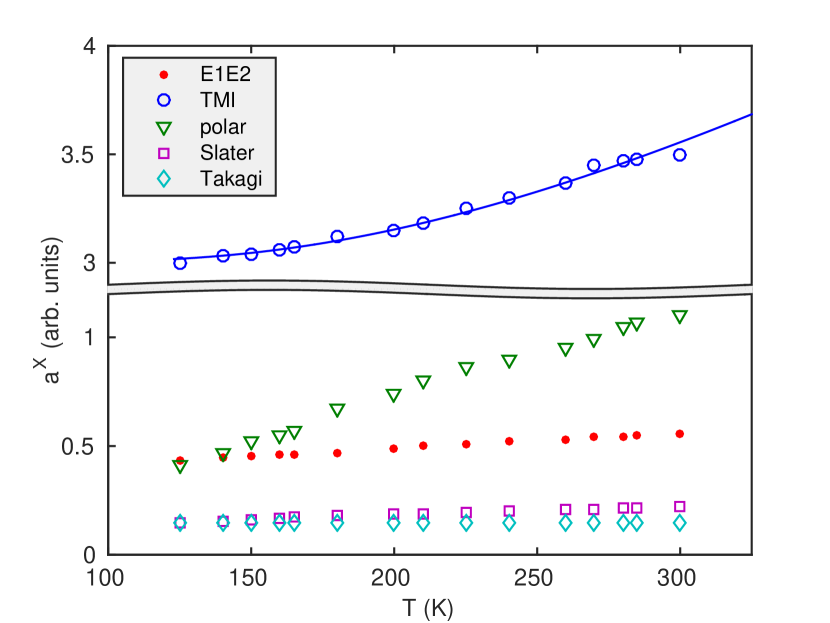
The fits were performed at each measured temperature, providing the temperature dependence of the coefficients (Fig. 4).
We see that the spectra are dominated by the TMI amplitude at all temperatures. However, its thermal growth is rather weak compared to previously reported cases Kirfel et al. (2002); Collins et al. (2003); Beutier et al. (2012). Nelmes et al. found a doubling of the thermal parameters of the potassium atoms between the phase transition and room temperature Nelmes et al. (1982), while the TMI growth that we observed in the same temperature range is much weaker. This can be explained by the fact that only part of the optical vibration modes contributes to the TMI effect. We fit the TMI growth with the usual phonon statistics model, assuming a single optical mode Kokubun et al. (2001):
| (12) |
We find meV cm-1. This value does not correspond to any reported vibration mode of KDP, but there are several modes between 150 and 500 cm-1 She et al. (1971), such that our single mode model is a too crude approximation in this case.
The dipole-quadrupole term also slightly grows with temperature, like in Ge Oreshko et al. (2011).
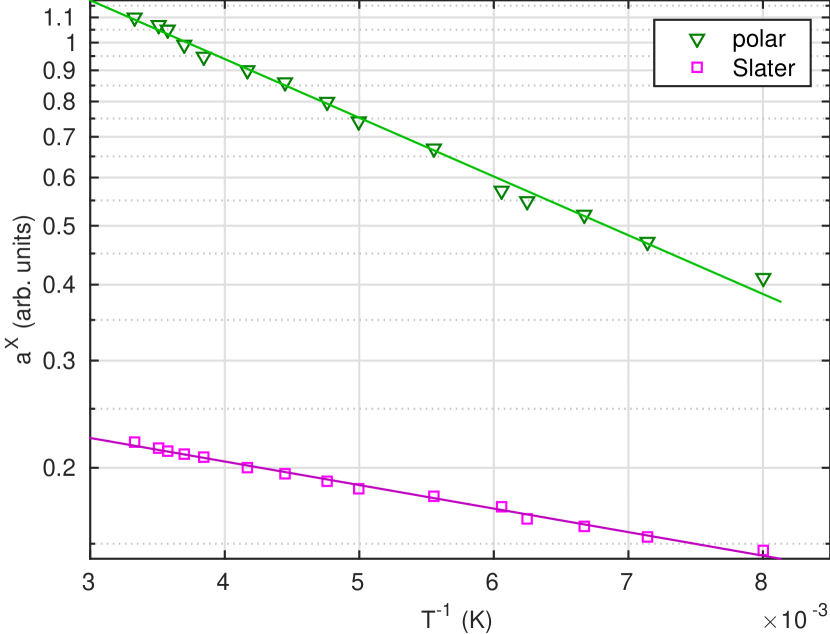
It is more interesting to explain the temperature dependence of the PC contributions. In accordance with Eq. (6) we believe that scales with the number of defects, which presumably follows the Arrhenius law:
| (13) |
where is the activation energy and is a constant. This constant contains various scaling factors related to the scattering measurements. Figure 4 shows that the polar and Slater configurations indeed follow this law. From the linear fits we extract their activation energies: meV and meV. The determination of the is not reliable enough to allow further analysis of the Takagi configurations.
In KDP, the polar configuration is usually considered as the ground state because it corresponds to the low temperature ferroelectric phase. The Slater and Takagi configurations are considered as first and second excited states respectively Fairall and Reese (1975); Lasave et al. (2005). The situation is reversed, for instance, in ammonium dihydrogen phosphate (ADP), in which the antiferroelectric order is stabilized by the Slater configurations Nagamiya (1952); Hewat (1973); Lasave et al. (2007). Our results are therefore inconsistent with the usual model. It is clear that this result must be taken carefully since the best fits reproduce only roughly the measured spectra (Fig. 5) and that some spectroscopic features are inaccurate. The quality of the fits is nevertheless standard for REXS spectra. The discrepancy is likely to originate from the evaluation of the contributing spectra, for two main reasons. First, the structural model of each proton configuration is rather simple: each configuration is simulated as a crystal of identical configurations, thus ignoring the possible interplay between different neighbour configurations. Moreover, correlations are also ignored in the simulation of the thermal effects. Second, the spectroscopic calculations of forbidden reflections are never very accurate, even in simple cases, because they involve complicated quantum calculations, such as the convolution with the width of the excited state, which is unknown. For these two reasons, it is not impossible that the contribution of the polar configurations is not well evaluated. Nevertheless, we found, maybe fortuitously, a value of the activation energy of Slater configurations (7.3 meV) that is in fair agreement with the values reported in the literature. The activation energy of Slater configurations with respect to the polar configurations has been evaluated to 5.2 meV by Fairall and Reese Fairall and Reese (1975), based on a phenomenological model and experimental polarisation curves. Recent ab initio calculations yielded values of 16.9 meV for uncorrelated Slater defects and 5.0 meV for Slater defects correlated in chains Lasave et al. (2005). The better agreement of the latter with the value of Fairall and Reese suggests the occurrence of correlated Slater clusters. Our value (7.3 meV) is also in better agreement with the correlated model, although significantly different. Rakvin and Dalal Rakvin and Dalal (1990) and Hukuda Hukuda (1975) independently found a much higher activation energy (190 meV) from electronic spin resonance measurements, but their measurements cannot attribute it to a particular configuration.
V Discussion and conclusion
The results presented above show very clearly that forbidden reflections are sensitive to proton configurations in hydrogen bonds. We have presented above a method to analyse quantitatively their spectra and extract the relative probabilities of the configurations. We find that the concentration of the polar and Slater configurations in KDP has a strong temperature dependence which follows the Arrhenius law. The resulting activation energies for polar and Slater configurations are in a reasonable order of magnitude but are in reversed order compared to the usually accepted model. This suggests that the quantitative analysis of the spectra requires further development.
By comparison with the results obtained from the and forbidden reflections of RDP Richter et al. (2014), whose crystal symmetry is isomorphic to KDP, the temperature effects are stronger in KDP. First, the phase transition from the para- to ferroelectric phase provides a much stronger intensity jump at the reflection of KDP Beutier et al. (2014) than at the reflection of RDP. Second, the energy spectra of the forbidden reflections are more complicated in KDP than in RDP and their variation with temperature is also stronger. This spectroscopic difference is the result of a structural difference: while both materials have the same symmetry, Rb atoms are heavier than potassium atoms and the lattice is possibly more rigid.
Moreover, we evidenced in KDP the contributions of the polar proton configurations, while in RDP only the presence of the Slater configurations had been observed (in the reflection). This could be achieved by collecting a larger set of experimental data in KDP, i.e., two reflections at two azimuths each, using the same simple theoretical framework. Moreover, measuring the spectra of the forbidden reflections at various azimuthal angles over a large temperature range gives additional information, which is very important for fitting the spectra. Nevertheless, the method has a limited accuracy, which is illustrated by the quality of the fits in Fig. 5. A number of simplifying assumptions contribute to this discrepancy: (a) In the calculation of the TMI term, we neglect the correlation of atomic displacements, which is equivalent to considering that only the resonant atoms vibrate; (b) proton distributions in a double-well potential are considered as static configurations of defects and the structure amplitude is considered to be a sum of coherent contributions from the supercells with different kinds of defects; and (c) the various contributions to the resonant amplitude were calculated using the multiple scattering approach (as opposed to the finite-difference method) with a limited number of atoms involved in the multiple scattering model. Nevertheless, this simple model provides a description of the main features of the forbidden reflections, their energy spectra and temperature dependence.
As such, this study raises questions about the physics of hydrogen-bonded materials, and provides a method to investigate them. We should point out that while the potassium K edge provides a convenient resonance edge to apply the technique, the phosphorus K edge could be even more sensitive. Indeed, the potassium atoms are not directly related to the hydrogen bonds, while the phosphorus atoms are located at the centre of the hydrogen-bonded oxygen tetrahedra. The phosphorus K edge could possibly provide more accurate results and more detailed information about the proton configuration. REXS at this edge would nevertheless imply experimental complications, due to the low energy (2.1455 keV).
Finally, we point out that the mechanism contributing to forbidden resonant reflections presented here, i.e., the proton disorder, is a realisation of the point-defect-induced scattering predicted in Ref. Dmitrienko and Ovchinnikova, 2000, which had not been evidenced experimentally prior to the studies of RDP and KDP. While it had been predicted as an effect of static disorder, here the protons are not static, but they are seen as such during the resonant x-ray scattering process.
Acknowledgements.
The authors acknowledge the support of the XMaS staff for the measurements performed at ESRF. XMaS is a mid-range facility supported by EPSRC. This work was supported by Grant No. RFBR 13-02-00760. The calculation have been performed using the ab initio total-energy and molecular-dynamics program VASP (Vienna ab initio simulation program) developed at the Institut für Materialphysil of the Universitat Wien. ENO is grateful to Professor B. A. Strukov for valuable discussions.Appendix A Absorption spectra
The spectra recorded in Bragg geometry are strongly modified by self-absorption Beutier et al. (2009). In order to properly analyse these spectra, the absorption spectrum must first be well characterized.
The absorption cross section of noncubic crystals is anisotropic. Tetragonal crystals, such as the paraelectric phase of KDP, display linear dichroism (in the electric dipole approximation) Brouder (1990) and the absorption cross section can be decomposed into an isotropic part and an anisotropic (dichroic) part. Though the polarisation vector is generally not an eigenstate of the optical system, we can make this approximation if the anisotropy is not too strong compared to the isotropic absorption. Within this approximation, the linear absorption coefficient is proportional to the absorption cross-section. According to Brouder’s formalism Brouder (1990), can be written as
| (14) |
where is the angle between the beam polarisation and the tetragonal axis, is the isotropic part, and is the dichroic part.
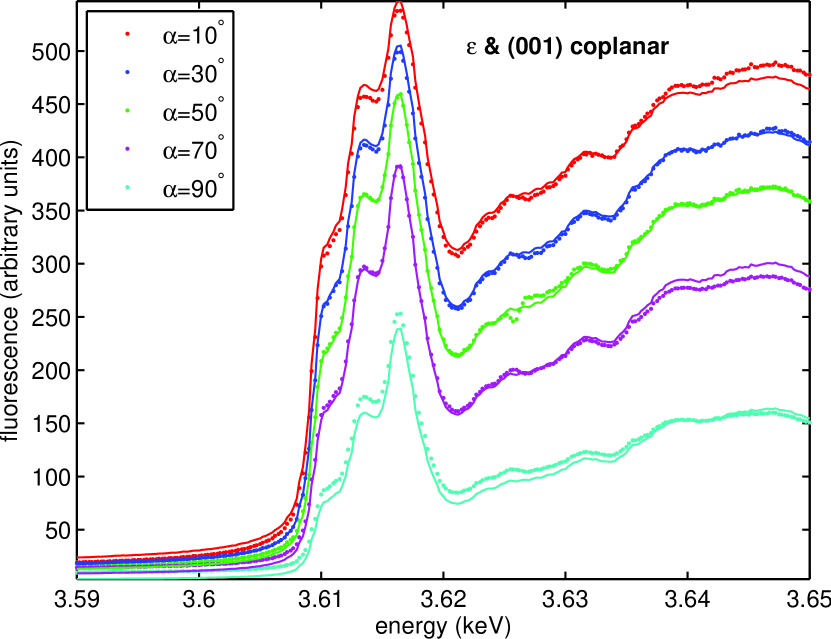
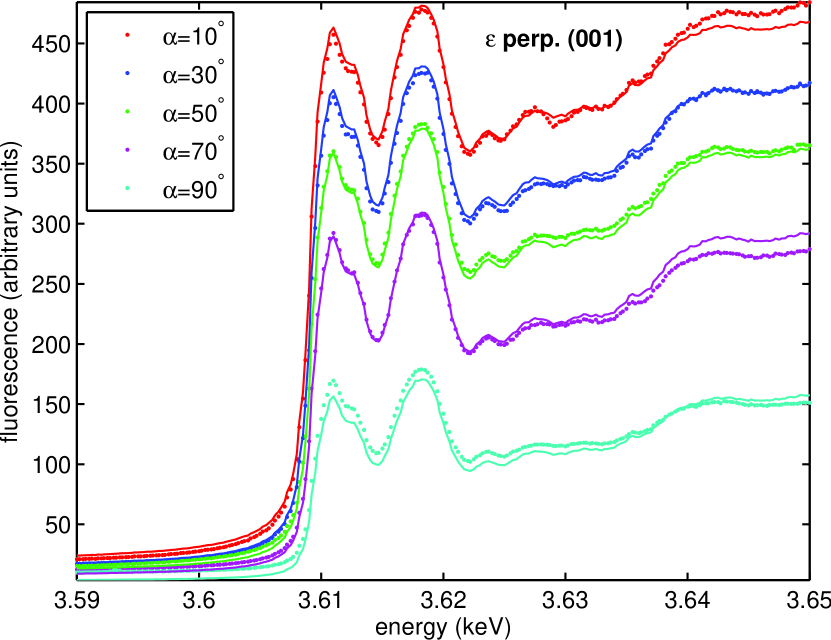
Two sets of fluorescence spectra with various incidence angles were recorded at beam line I16 of Diamond Light Source, at room temperature, the first one with the polarisation parallel to the tetragonal axis and the second one with the polarisation perpendicular to it. The fluorescence was measured in reflection geometry with the detector at 100∘ from the incident beam from a crystal with a (110) cut (Fig. 6). The isotropic part and anisotropic parts of the absorption spectrum were extracted following a similar procedure to that detailed in Ref. Beutier et al., 2009. The results are shown in Fig. 7 and reveal a rather strong linear dichroism.
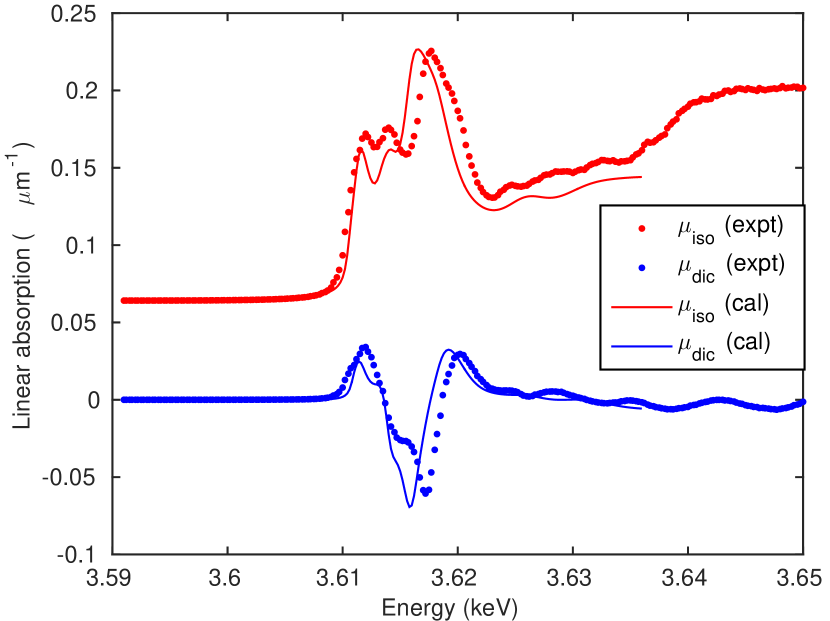
The experimental absorption spectra obtained with this procedure were then modelled with FDMNES Bunau and Joly (2009); fdm . The calculations were made with the finite difference method with a cluster of 7.5 Å (145 atoms), and the simulated spectra were convoluted with the width of the excited state, described by an arctangent model. Figure 7 shows the isotropic and anisotropic parts of the calculated absorption in comparison with the experimental results. The agreement between FDMNES calculations and experimental spectra is rather good for both spectra.
Appendix B Analysis of the ferroelectric phase
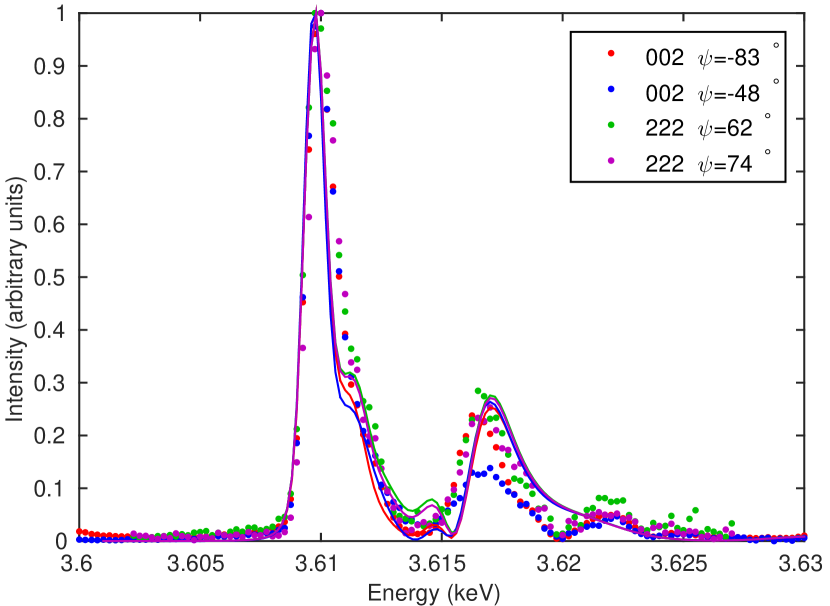
In the ferroelectric phase, the resonant scattering factor is largely dominated by the electric dipole-dipole (E1E1) contribution, whose appearance explains the sudden changes of intensity and spectrum across the phase transition Beutier et al. (2014). It has no strong temperature dependence as long as it remains below the phase transition: the lattice contraction has very little effect on the resonant scattering if we consider only the static perfect structure Oreshko et al. (2012). The variation of the forbidden reflections intensity observed below the phase transition in the experimental data is ascribed to the rotation of orthorhombic domains. A single E1E1 component contributes to the forbidden reflections, so that the 002 and 222 reflections show nearly identical spectra, independently of the azimuth Beutier et al. (2014). Figure 8 shows the comparison of the calculated and experimental energy spectra of the and reflections (each for two azimuthal angles). The calculated spectra are in good agreement with the experimental data. A small and azimuthal dependence of the calculated energy spectra can be noticed between 3.612 and 3.616 keV and is ascribed to a minor contribution of the electric dipole-quadrupole (E1E2) resonance.
References
- Jona and Shirane (1993) F. Jona and G. Shirane, Ferroelectric Crystals (Dover, New York, 1993).
- Slater (1941) J. C. Slater, J. Chem. Phys. 9, 16 (1941).
- Takagi (1948a) Y. Takagi, J. Phys. Soc. Jpn. 3, 271 (1948a).
- Senko (1961) M. E. Senko, Phys. Rev. 121, 1599–1604 (1961).
- Strukov et al. (1974) B. A. Strukov, V. G. Vaks, A. Baddur, V. I. Zinenko, and V. A. Koptsik, Ferroelectrics 7, 195 (1974).
- Nelmes et al. (1985) R. J. Nelmes, W. F. Kuhs, C. J. Howard, J. E. Tibballs, and T. W. Ryan, J. Phys. C: Solid State Phys. 18, L71 (1985).
- Blinc (1960) R. Blinc, J. Phys. Chem. Solids 13, 204 (1960).
- Schmidt (1987) H. Schmidt, Ferroelectrics 72, 157 (1987).
- Tokunaga and Matsubara (1987) M. Tokunaga and T. Matsubara, Ferrolectrics 72, 175 (1987).
- Lines and Glass (2001) M. Lines and A. Glass, Principles and Applications of Ferroelectrics and Related Materials (Oxford University Press, Oxford, 2001).
- Ichikawa (1981) M. Ichikawa, Chemical Physics Letters 79, 583 (1981).
- Ichikawa et al. (1987) M. Ichikawa, K. Motida, and N. Yamada, Phys. Rev. B 36, 874 (1987).
- Nelmes (1988) R. J. Nelmes, J. Phys. C: Solid State Phys. 21, L881 (1988).
- Bussmann-Holder and Michel (1998) A. Bussmann-Holder and K. H. Michel, Phys. Rev. Lett. 80, 2173 (1998).
- Koval et al. (2002) S. Koval, J. Kohanoff, R. L. Migoni, and E. Tosatti, Phys. Rev. Lett. 89, 187602 (2002).
- Koval et al. (2005) S. Koval, J. Kohanoff, J. Lasave, G. Colizzi, and R. L. Migoni, Phys. Rev. B 71, 184102 (2005).
- Reiter et al. (2002) G. F. Reiter, J. Mayers, and P. Platzman, Phys. Rev. Lett. 89, 135505 (2002).
- Takagi (1948b) Y. Takagi, J. Phys. Soc. Jpn. 3, 273 (1948b).
- Beutier et al. (2014) G. Beutier, S. P. Collins, E. N. Ovchinnikova, G. Nisbet, and V. E. Dmitrienko, J. Phys.: Conf. Ser. 519, 012006 (2014).
- Richter et al. (2014) C. Richter, D. V. Novikov, E. K. Mukhamedzhanov, M. M. Borisov, K. A. Akimova, E. N. Ovchinnikova, A. P. Oreshko, J. Strempfer, M. Zschornak, E. Mehner, D. C. Meyer, and V. E. Dmitrienko., Phys. Rev. B 89, 094110 (2014).
- Nelmes et al. (1982) R. J. Nelmes, G. M. Meyer, and J. E. Tibballs, J. Phys. C : Solid State Phys. 15, 59 (1982).
- Note (1) Unlike in Ref. \rev@citealpnumbeutier14.
- Dmitrienko (1983) V. E. Dmitrienko, Acta Cryst. A 39, 29 (1983).
- Blume (1994) M. Blume, “Resonant anomalous x-ray scattering,” (Elsevier, New York, 1994) Chap. Magnetic Effects in Anomalous Dispersion, p. 495.
- Bunau and Joly (2009) O. Bunau and Y. Joly, J. Phys.: Condens. Matter. 21, 303 (2009).
- (26) www.neel.cnrs.fr/fdmnes.
- Oreshko et al. (2012) A. P. Oreshko, E. N. Ovchinnikova, G. Beutier, S. P. Collins, G. Nisbet, A. M. Kolchinskaya, and V. E. Dmitrienko, J. Phys.: Condens. Matter. 24, 245403 (2012).
- Kokubun et al. (2001) J. Kokubun, M. Kanazava, K. Ishida, and V. E. Dmitrienko, Phys. Rev. B 64, 073203 (2001).
- Kirfel et al. (2002) A. Kirfel, J. Grybos, and V. E. Dmitrienko, Phys. Rev. B 66, 165202 (2002).
- Collins et al. (2003) S. P. Collins, D. Laundy, V. E. Dmitrienko, D. Mannix, and P. Thompson, Phys. Rev. B 68, 064110 (2003).
- Beutier et al. (2012) G. Beutier, S. P. Collins, G. Nisbet, E. N. Ovchinnikova, and V. E. Dmitrienko, Eur. Phys. J. Spec. Top. 208, 53 (2012).
- Dmitrienko and Ovchinnikova (2000) V. E. Dmitrienko and E. N. Ovchinnikova, Acta Cryst. A 56, 340 (2000).
- Mukhamedzhanov et al. (2010) E. K. Mukhamedzhanov, M. V. Kovalchuk, M. M. Borisov, E. N. Ovchinnikova, E. V. Troshkov, and V. E. Dmitrienko, Crystallography Reports 55, 174 (2010).
- Sugimoto and Ikeda (1996) H. Sugimoto and S. Ikeda, J. Phys.: Condens. Matter. 8, 603 (1996).
- Authier (2003) A. Authier, International Tables for Crystallography., edited by A. Authier, Vol. D (2003) Chap. 1.1.4.
- Collins et al. (2010) S. Collins, A. Bombardi, A. Marshall, J. Williams, G. Barlow, A. Day, M. Pearson, R. Woolliscroft, R. Walton, G. Beutier, and G. Nisbet, AIP Conf. Proc. 1234, 303 (2010).
- Joly (2001) Y. Joly, Phys. Rev. B 63, 125120 (2001).
- Miyoshi et al. (2011) T. Miyoshi, H. Mashiyama, T. Asahi, H. Kimura, and Y. Noda, J. Phys. Soc. Jpn. 80, 044709 (2011).
- Ovchinnikova et al. (2010) E. N. Ovchinnikova, V. E. Dmitrienko, A. P. Oreshko, G. Beutier, and S. P. Collins, J. Phys.: Condens. Matter. 22, 355404 (2010).
- Ovchinnikova et al. (2005) E. N. Ovchinnikova, A. P. Oreshko, Y. Joly, A. Kirfel, B. P. Tolochko, and V. E. Dmitrienko, Physica Scripta 115, 252 (2005).
- Kresse and Furthmuller (1996) G. Kresse and Furthmuller, Phys. Rev. B 54, 11169 (1996).
- Kresse and Joubert (1999) G. Kresse and D. Joubert, Phys. Rev. B 59, 1758 (1999).
- She et al. (1971) C. Y. She, T. W. Broberg, and D. F. Edwards, Phys. Rev. B 4, 1580 (1971).
- Oreshko et al. (2011) A. P. Oreshko, V. E. Dmitrienko, and E. N. Ovchinnikova, Journal of Mathematical Sciences 172, 859 (2011).
- Fairall and Reese (1975) C. W. Fairall and W. Reese, Phys. Rev. B 11, 2066 (1975).
- Lasave et al. (2005) J. Lasave, S. Koval, N. S. Dalal, and R. Migoni, Phys. Rev. B 72, 104104 (2005).
- Nagamiya (1952) T. Nagamiya, Progress of Theoretical Physics 7, 275 (1952).
- Hewat (1973) A. W. Hewat, Nature (London) 246, 90 (1973).
- Lasave et al. (2007) J. Lasave, S. Koval, N. S. Dalal, and R. L. Migoni, Phys. Rev. Lett. 98, 267601 (2007).
- Rakvin and Dalal (1990) B. Rakvin and N. S. Dalal, Phys. Rev. B 41, 608 (1990).
- Hukuda (1975) K. Hukuda, J. Phys. Soc. Jpn. 38, 150 (1975).
- Beutier et al. (2009) G. Beutier, E. Ovchinnikova, S. P. Collins, V. E. Dmitrienko, J. E. Lorenzo, J.-L. Hodeau, A. Kirfel, Y. Joly, A. A. Antonenko, V. A. Sarkisyan, and A. Bombardi, J. Phys.: Condens. Matter. 21, 265402 (2009).
- Brouder (1990) C. Brouder, J. Phys.: Condens. Matter. 2, 701 (1990).