X-ray/UV variability and the origin of soft X-ray excess emission from II Zw 177
Abstract
We study X-ray and UV emission from the narrow-line Seyfert 1 galaxy II Zw 177 using a long and another short XMM-Newton observation performed in 2012 and 2001, respectively. Both observations show soft X-ray excess emission contributing in 2012 and in 2001 in the band. We find that both blurred reflection from an ionized disc and Comptonized disc emission describe the observed soft excess well. Time-resolved spectroscopy on scales of reveals strong correlation between the soft excess and the powerlaw components. The fractional variability amplitude derived from EPIC-pn lightcurves at different energy bands is nearly constant (). This is in contrast to other AGNs where the lack of short term variation in soft X-ray excess emission has been attributed to intense light bending in the framework of the “lamppost” model. Thus, the variations in powerlaw emission are most likely intrinsic to corona rather than just due to the changes of height of compact corona. The variable UV emission () is uncorrelated to any of the X-ray components on short timescales suggesting that the UV emission is not dominated by the reprocessed emission. The gradual observed decline in the UV emission in 2012 may be related to the secular decline due to the changes in the accretion rate. In this case, the short term X-ray variability is not due to the changes in the seed photons but intrinsic to the hot corona.
keywords:
accretion, accretion discs– galaxies: active, galaxies: individual: II Zw 177, galaxies: nuclei, X-rays: galaxies1 Introduction
Most active galactic nuclei (AGN) show complex broad-band spectra. The optical/UV to X-ray spectrum consist of primarily four components – the big blue bump (BBB), the X-ray power law emission in the band, Fe-K line near 6 keV with reflection hump at higher energies and the soft X-ray excess emission below 2 keV. The BBB is likely the thermal emission from a standard accretion disc (Shakura & Sunyaev, 1973; Shields, 1978). According to this model the outer accretion disc with low temperature emits within the optical band and the inner disc with the highest temperature emits in the extreme UV. In rare cases of low mass AGN with high accretion rates, the disc can emit in the soft X-ray band (e.g., Done et al. 2013; Chiang et al. 2015). The power law continuum emission is believed to originate through the Compton up scattering of the soft photons from the accretion disc in the hot electron plasma (Sunyaev & Titarchuk, 1980; Haardt & Maraschi, 1991; Reynolds & Nowak, 2003). The Fe-K line near 6 keV and the reflection hump in the keV band are considered together as the X-ray reflection. The iron-K line and the reflection hump are caused by the photoelectric absorption, followed by fluorescence, and the Compton scattering of the coronal emission in an optically thick medium such as accretion discs (Guilbert & Rees, 1988; Lightman & White, 1988; George & Fabian, 1991; Tanaka et al., 1995). Since the discovery of the soft X-ray excess emission (Singh et al., 1985; Arnaud et al., 1985), the origin of this component has been widely debated with high energy tail of thermal emission from the accretion disc discussed as an early possibility (Arnaud et al., 1985; Magdziarz et al., 1998; Leighly, 1999). However, the expected thermal emission from accretion disc of AGN is too cool to contribute significantly in the soft X-ray band, except for a subclass of AGN known as narrow line Seyfert galaxies (NLS1s) which have low black hole mass and high accretion rate (e.g., Boller et al. 1996).
Nonetheless, in NLS1, the predicted shape of Wein tail of inner disc should drop faster than the observed shape of soft excess with energy (Bechtold et al., 1987; Laor et al., 1997). The extent over the Wein tail of the disc could be explained with Compton upscattering of disc photons through optically thick cool plasma (Czerny & Elvis, 1987). This optically thick cool plasma may reside between the interior of disc and the X-ray source either separated vertically (Janiuk et al., 2001) or radially (Magdziarz et al., 1998) or indistinct (Done et al., 2012). However, the temperature associated with this Comptonization region remains invariant keV (Czerny et al., 2003; Gierliński & Done, 2004; Miniutti et al., 2009). This constancy of temperature over a large range in AGN masses and luminosities led to the two models for soft excess – blurred reflection from relativistic photoionized accretion disc (Fabian et al., 2002; Crummy et al., 2006; Walton et al., 2013) and smeared ionized absorption (Gierliński & Done, 2004, 2006; Schurch & Done, 2006; Middleton et al., 2007) that utilized the atomic processes. The velocity smeared absorption explanation for soft excess was ruled out due to the unrealistic requirement of very high velocity () of gas clouds to smooth the curvature of this excess (Schurch & Done, 2008; Schurch et al., 2009). However, the origin of soft X-ray excess is still not clearly understood since these models are often spectroscopically degenerate in the sense that they fit the X-ray spectra equally well (e.g., Gierliński & Done 2004; Sobolewska & Done 2005; Dewangan et al. 2007). The variability study based on hard/soft time lags in different energy bands and correlation between spectral components can help to remove this ambiguity between different physical processes.
After the discovery of hard X-ray lag relative to soft X-rays in binary system (e.g., Miyamoto et al. 1988; Nowak et al. 1999), similar lags were also observed in AGN (Papadakis et al., 2001; McHardy et al., 2004). The origin of hard lag is not clearly known. One possible explanation is provided by the propagation fluctuation model in which fluctuations associated with accretion flow propagate inward in an accretion disc and thus resulting in the emission of the soft photons from relatively outer regions earlier than the hard photons from the innermost regions (Lyubarskii, 1997; Kotov et al., 2001; Arévalo & Uttley, 2006). Recently, for example, Swift monitoring of the radio-loud NLS1 galaxy PKS 0558–504 for has revealed that optical leads UV and UV leads soft X-rays on short timescales of about a week (Gliozzi et al., 2013) possibly favouring the propagation model. A new type of lag has emerged from recent studies where soft photons lag to the hard photons. This is termed as the reverberation lag which is used to constrain the X-ray emitting region in AGN. Fabian et al. (2009) discovered the reverberation lag 30s for the first time in a NLS1 galaxy 1H0707–495. Since then such lags have been observed in dozen of Seyfert galaxies (Zoghbi et al., 2010; de Marco et al., 2011; Emmanoulopoulos et al., 2011a; Zoghbi et al., 2011; Zoghbi & Fabian, 2011; Cackett et al., 2013; Fabian et al., 2013; Kara et al., 2013; De Marco et al., 2013). The most of above cases reveal reverberation lag s supporting the compact nature of X-ray emitting region within few gravitational radii of a supermassive black hole (SMBH). In case of strong illumination such as that implied by observation of strong blurred reflection, UV/optical emission from AGN may be dominated by the reprocessed emission and the variations in the optical/UV band emission lag behind the X-rays (e.g., McHardy et al. 2014). About a five year long compaign of Seyfert 1 galaxy Mrk 79 using six ground based observatories for optical and RXTE for X-ray observations, Breedt et al. (2009) have shown zero lag between optical and X-rays on timescale of about a day. Their study of correlated X-ray and optical emission suggests X-ray reprocessing on short timescale of days and the changes in the optical emission on long timescale of few years can be attributed to the variations in the accretion rate.
The presence or absence of correlated variability between the different X-ray spectral components can also be used to constrain the models. For example, one would naively expect that the soft excess should be correlated with the power-law emission for the reflection model. However, it has been argued that strong gravitational light bending within the framework of a “lamppost” model where a compact X-ray producing region located at a height illuminates the disc, may lead to absence of such correlations (Miniutti & Fabian, 2004). It is also difficult to eliminate the other models for the soft excess based on correlation studies of X-ray components alone. Multiwavelength variability properties and the relationship between the soft X-ray excess and the optical/UV emission from the accretion disc may provide better constraints on the models for the soft X-ray excess.
Multiwavelength studies of AGN have shown possible relationship between the soft X-ray excess and the optical/UV big blue bump (e.g., Puchnarewicz et al. 1992; Boller et al. 1996; Elvis et al. 1994; Edelson et al. 1996; Brocksopp et al. 2006; Middleton et al. 2007). Walter & Fink (1993) found a strong correlation between the soft X-ray slope measured with ROSAT and the strength of UV emission observed with International Ultraviolet Explorer for 58 Seyfert 1 AGN. Grupe et al. (1998) found pronounced BBB emission in a sample of 76 bright soft X-ray selected AGN and the optical spectra of these AGN were bluer when the soft X-ray spectra were steeper. They interpreted these results as the BBB emission arising from Comptonized accretion disc. Based on a multiwavelength campaign of Mrk 509 by Swift and XMM-Newton over a period of 100 days, Mehdipour et al. (2011) have found a strong correlation between the soft X-ray excess and the optical/UV thermal emission from the accretion disc but no correlation between the X-ray powerlaw component and either the soft X-ray excess or optical/UV emission. These results are expected if the soft X-ray excess is produced in the thermal Comptonization of optical/UV disc photons by a warm () and optically thick () corona surrounding the inner disc (Mehdipour et al., 2011). Thus, multiwavelength optical/UV/X-ray variability study of AGN is an important tool to investigate the relationship between different emission components and to shed light on the central engine and the origin of soft X-ray excess. In this paper we present detailed broadband X-ray spectral and UV/X-ray variability study of II Zw 177 – a highly variable AGN.
II Zw 177 is a bright X-ray source and is listed in the ROSAT X-ray bright source catalogue (Voges et al., 1999). Its luminosity was measured in band with XMM-Newton (Bianchi et al., 2009). II Zw 177 is a NLS1 galaxy located at a redshift (Appenzeller et al., 1998; Véron-Cetty & Véron, 2006; Gallo, 2006; Zhou et al., 2006; Ai et al., 2011). Gallo (2006) studied this AGN using 2001 June XMM-Newton observation and grouped this AGN in the “General NLS1 Sample” as opposed to the “Complex NLS1 Sample” and also reported a broad feature near . We have performed a long XMM-Newton observation which we analyze here. We also use the earlier observation and study X-ray spectral and UV/X-ray variability. We organize this paper as follows. We describe the observations and data reduction in Section 2. In Section 3, we detail the spectral modeling with complex models. In Section 4, we present the long term X-ray spectral variability. We report the UV to X-ray spectral variability in Section 5. We discuss and summarize our results in Section 6. We use the luminosity distance () using cosmological parameters , and .
| Observatory | Observation-ID | Date | Clean exposure | Rate |
|---|---|---|---|---|
| EPIC-pn/MOS1/MOS2 ( ks) | ||||
| XMM-Newton | 0103861201 | June 7, 2001 | 7.3/11.3/11.6 | |
| ” | 0694580101 | May 29–30, 2012 | 83.9/109.2/110.2 |
Note– Count rate for EPIC-pn data in keV band.
2 Observation and data reduction
II Zw 177 was observed thrice with XMM-Newton (Jansen et al., 2001). The first two observations have been studied by various authors (Galbiati et al., 2005; Gallo et al., 2006; Gallo, 2006; Saxton et al., 2008; Ebrero et al., 2009; Ai et al., 2011; Corral et al., 2011). The first observation (ObsID: 0103861201) was performed starting on 2001 June 7, 04:40 UTC with an exposure time of 13 ks. In this observation, the European Photon Imaging camera (EPIC) pn (Strüder et al., 2001) was operated in the full window and two EPIC-MOS cameras (Turner et al., 2001) in the small window mode with the medium filter. The second observation (Obs ID: 0103862601) was performed only with reflection grating spectrometers (RGS1/RGS2) in the spectroscopic mode with about each. We performed the third observation in 2012 May (ObsID: 0694580101) for an exposure of using the thin filter in the full window mode (see Table 1). We analyzed EPIC-pn and EPIC-MOS1/MOS2 data from the first and the third (2012) observations.
We reprocessed the EPIC-pn and EPIC-MOS data using the Science Analysis System (SAS) v13.0.0 (Gabriel et al., 2004) and updated calibration files. Examination of light curves extracted above revealed the presence of flaring particle background. We created good time interval (gti) files after excluding the intervals of flaring particle background identified based on count rate cut-off criteria. We used above criteria by selecting the count rate cut-off values 2.0, 0.5 in 2012 and 2.4, 0.35 in 2001 observations for EPIC-pn and EPIC-MOS, respectively. We filtered the event lists to retain the good events with patterns (EPIC-pn) or (EPIC-MOS) with arrival times within the good time intervals and generated the cleaned event lists. This resulted in the useful exposures of (EPIC-pn) and (EPIC-MOS) for the 2012 observation and (EPIC-pn) and (EPIC-MOS) for the 2001 observation (see Table 1). We extracted source spectra from circular regions of radii 55 and 40 arcsec for 2012 and 2001 observations, respectively. We also extracted the background spectra from off-source circular regions with radii in the range of 35 to 63 arcsec. We generated the redistribution matrix and ancillary response files using the SAS tools RMFGEN and ARFGEN, respectively. We grouped the spectral data sets to a minimum counts of 20 per bin and oversampled by a factor of 5 using the specgroup tool.
| Model 1: Ionized PCA model | |||
| XMM-Newton | |||
| Model | Parameter | 0694580101 | 0103861201 |
| Component | (2012 May) | (2001 June) | |
| Gal. abs. | () | 5.4 (*) | 5.4 (*) |
| POWERLAW | |||
| f | |||
| f | |||
| ZXIPCF | () | ||
| () | |||
| () | |||
| BBODY | ) | ||
| f | |||
| Model 2: Blurred reflection model | |||
| Gal. abs. | () | 5.4 (*) | 5.4 (*) |
| NTHCOMP | |||
| ( eV) | (*) | ||
| f | |||
| f | |||
| REFLIONX | (*) | ||
| () | |||
| (pt) | (pt) | ||
| KDBLUR | |||
| () | |||
| () | (*) | (*) | |
| () | |||
| f | |||
| Model 3: Intrinsic disc Comtonised model | |||
| Gal. abs. | () | 5.4 (*) | 5.4 (*) |
| OPTXAGNF | |||
| ( keV) | |||
| f | |||
| f | |||
Notes– (a) fPL, fNTH, fref and fOPTX represent fluxes to respective model component and flux is measured in units ; (b) This is observed flux in units of a given energy band.; (c) Luminosity in units ; (d) Electron temperature is fixed to 100 keV. P stands for pegged to hard limit. ’pt’ stands for parameter tied. Fixed parameters are indicated by an asterisk.
| Model : reflection model with RELCONV_LP | |||
|---|---|---|---|
| Model | Parameter | 0694580101 | 0103861201 |
| Component | (2012 May) | (2001 June) | |
| Gal. abs. | () | 5.4 (*) | 5.4 (*) |
| NTHCOMP | |||
| ( eV) | (*) | ||
| f | |||
| f | |||
| REFLIONX | (f) | ||
| () | |||
| (pt) | (pt) | ||
| RELCONV_LP | () | ||
| (pt) | (pt) | ||
| () | |||
| a | |||
| () | (*) | (*) | |
| () | |||
| f | |||
Notes– (a) fNTH and fref represent fluxes to respective model component and flux is measured in units of ; (b) This is observed flux in units of for a given energy band.; (c) Luminosity in units of ; (d) Electron temperature is fixed to 100 keV. ’pt’ stands for parameter tied. Fixed parameters are indicated by an asterisk.

3 X-ray Spectral modeling
We used XSPEC v12.8 (Arnaud, 1996) to analyze the spectral data sets and employed the statistics to find the best-fit models. The errors on each best-fitting parameter reflect confidence level unless otherwise stated.
We begin with the spectral analysis of 2012 data. First, we compared
the EPIC-pn, EPIC-MOS1 and EPIC-MOS2 spectral data by fitting the
band by a simple model CONS–
TANTWABSPOWERLAW. Here the
constant has been introduced to take into account any difference
in flux normalization between the instruments.
We fixed the Galactic absorption column density
(Dickey & Lockman, 1990). The fit resulted in
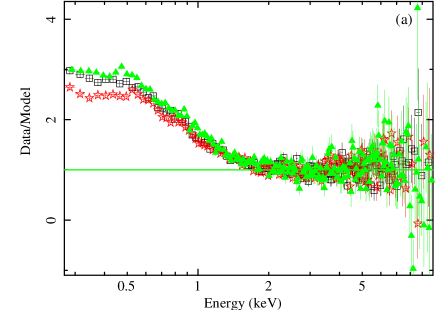
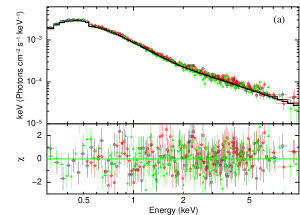
for 309 degree of freedom (dof) with . We then
extrapolated the model down to and plotted the data-to-model
ratio in Figu 1 (a). We noticed that the EPIC-MOS2 data do not
agree well below with the EPIC-pn or EPIC-MOS1 data. We
therefore excluded EPIC-MOS2 data below from our spectral
analysis. In addition, the ratio plot clearly shows strong soft X-ray
excess emission below .
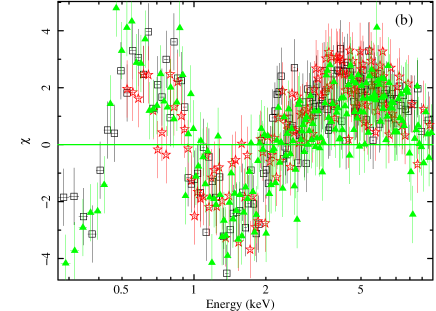
The soft X-ray component has been observed in many Seyfert 1/QSO AGN (e.g., Singh et al. 1985; Arnaud et al. 1985; Boller et al. 1996; Vaughan et al. 1999; Crummy et al. 2006). Though the origin of the soft X-ray excess is not clearly understood, the component can be modeled by three physically motivated models – partially ionized absorption, blurred reflection from a partially ionised accretion disc and the thermal Comptonization in an optically thick, cool plasma (Arnaud et al., 1985; Leighly, 1999; Crummy et al., 2006; Dewangan et al., 2007; Sobolewska & Done, 2007; Done et al., 2012). Here we use these models and test their validity using the UV/X-ray variability. We note that fitting the absorbed powerlaw model to the full band provided a poor fit () and resulted in the curvature in the band and excess emission in the emission as shown in Fig. 1 (b). Such features may be caused by complex partial covering absorption (PCA) which we test first.
3.1 Ionized partial covering model
Multiplying the simple absorbed powerlaw model with a neutral partial covering absorption (ZPCFABS) model improved the fit () with and covering fraction . However the fit is statistically unacceptable. We also tested the possible presence of partially covering ionised absorption along the line of sight to the nuclear source. We used the ZXIPCF model which is an XSTAR based absorption model constructed with illuminating continuum slope of and turbulent velocity of (Reeves et al., 2008). Replacing the neutral PCA component with the ionised PCA model ZXIPCF improved the fit ( for one additional parameter. Using a second ZXIPCF component did not improve the fit further. Thus, complex absorption cannot describe the observed data. Indeed, adding a simple blackbody i.e., the model WABSZXIPCF(POWERLAW+ZBBODY) improved the fit considerable (). The blackbody temperature is which is typical of AGN with strong soft X-ray excess. Although this model does not fit the data in the sense that it requires an adhoc blackbody component (see Fig. 2 (a)), for completeness the best-fit parameters are listed in Table 2.
3.2 The blurred reflection model
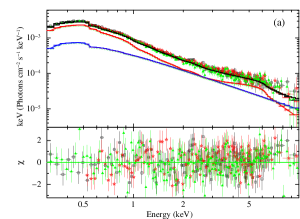
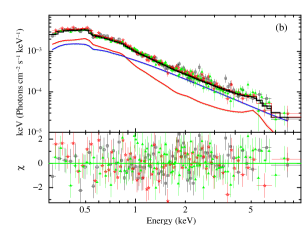
The soft X-ray excess emission can be described by reflection from a relativistic photoionized accretion disc. In the “lamppost” geometry, a hot compact plasma, above the accretion disc, emits the primary emission which illuminates the surface of disc material (Matt et al., 1991). The X-ray illumination is stronger in the inner regions of the disc due to the strong gravity of the SMBH (e.g., Miniutti & Fabian 2004). The emissivity of the reflected emission is often expressed as , where is the distance from the center and is the emissivity index. The soft X-ray excess can arise due to the numerous emission lines from the photoionised disc and Thomson scattering of the illuminating powerlaw emission. We therefore modeled the soft X-ray excess emission using the REFLIONX model which characterizes the reflected emission from partially ionized accretion disc (Ross & Fabian, 2005). The parameters of REFLIONX are iron abundance relative to solar (), ionization parameter ( where is the source luminosity, is hydrogen density and r represents the distance between source and disc) and photon index which is same as the illuminating powerlaw photon index. Thus, we tied REFLIONX to POWERLAW required for disc illumination. The model WABS(POWERLAW+REFLIONX) improved the fit () compared to the absorbed powerlaw. The residuals in above modeling could be smoothed by the gravitational and relativistic effects close to the SMBH (Fabian et al., 2000, 2009). We blurred the ionized reflected emission by the convolution model KDBLUR to obtain the relativistically broaden ionized reflection from the inner regions of the accretion disc. The parameters of KDBLUR are emissivity index (), inner and outer radii of the disc (Rin and ) and inclination () angle between observer’s line of sight and normal to the disc. The WABS(POWERLAW+KDBLUR*REFLIONX) resulted in a satisfactory fit (). To be more physically consistent, we replaced the powerlaw by a thermal Comptonization model NTHCOMP (Zdziarski et al., 1996). In this model, we fixed the electron temperature to a high value of and soft disc photon temperature to . The model WABS(NTHCOMP+KDBLUR*REFLIONX) resulted in the similar as expected. We did not find any significant residuals and consider this as the best-fit blurred reflection model. The spectral data, the best-fit model, and the residuals are shown in Fig. 3 (a) and the best-fitting parameters are listed in Table 2. We further replaced KDBLUR by RELCONV_LP, which also convolves with the entire reflected X-ray spectrum to blur the emission features and provides lamppost height of the X-ray source. The important model parameters are height of the compact corona , inner disc radius, spin, outer disc radius, inclination and illuminatiing powerlaw index. The best-fit parameters of WABS(NTHCOMP+RELCONV_LP*REFLIONX) are listed in Table 3.
3.3 The intrinsic disc Comptonization model
The strong soft X-ray excess emission can also be modeled by thermal Comptonization in a cool, optically thick plasma (see e.g., Dewangan et al., 2007). If the gravitational energy released is not completely thermalised, then it is possible that a fraction of the energy dissipated in the inner disc elevates its temperature such that it acts as an optically thick thermal Comptonizing medium. The intrinsic disc Comptonization model (OPTXAGNF) accounts for the thermal Comptonization in the inner disc material (Done et al., 2012). This model is an energetically consistent model in which gravitational energy is distributed among different parts of the accretion disc. This model itself takes care of colour temperature correction at each radius to partly contribute to the soft excess. The inner disc emission gets Compton upscatters from thermal Comptonization medium, to rISCO, which consists of an optically thick cool ( keV) electron plasma. The thermal Comptonization in the disc plasma is responsible for the soft X-ray excess emission. A fraction of total gravitational energy is also dissipated into a hot corona below which is responsible for the hard X-ray emission extending to a few . Thus, the OPTXAGNF model includes the three components – thermal emission from a standard disc, optically thick thermal Comptonization in the inner disc and optically thin thermal Comptonization in a hot corona below . This model provides important information on black hole spin (), accretion rate relative to Eddington rate () and properties of optically thick cool plasma (elctron temperature and optical thickness ).
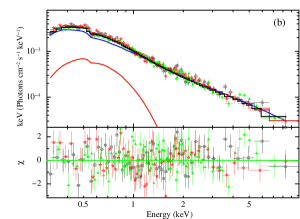
To fit the soft X-ray excess and the high energy continuum, we used the model WABSOPTXAGNF. We fixed the black hole mass to (Greene & Ho, 2007b; Ai et al., 2011), distance to () and outer radius to . The residuals, obtained after fitting the model, did not show any significant features with a . The observed data, the model and the residuals are shown in Fig. 4 (a) and the best-fit parameters are listed in Table 2. There are no obvious narrow emission line in the Fe-K regime which may arise from a neutral reflection component from a distant material such as a putative torus. To examine this further, we included a narrow Gaussian line with the width fixed at , line energy fixed to and obtained a upper limit on the equivalent width to be 0.08 keV.
Since the model includes the emission from the outer disc, it can also predict the UV emission from such a system. This can be compared with the data from the Optical Monitor (OM). The reduction and reprocessing of the UV data measured with the OM is described in detail in section 5. We used the time-averaged count rate in the U filter to construct the U band spectrum usable in XSPEC. We also used the latest response for this filter 111http://xmm2.esac.esa.int/external/xmm_sw_cal/calib/om_files.shtml. We obtained the flux density in the U band to be erg s-1 cm-2 Å-1. We estimated the predicted U band flux by extending the best fit X-ray model. For this, we increased the outer radius to and used a Galactic reddening factor (Schlafly & Finkbeiner, 2011). The estimated flux density was found to be erg s-1 cm-2 Å-1. Clearly the observed UV flux is significantly higher than the predicted value indicating that the UV emission is not due to the outer disc intrinsic emission but perhaps due to X-ray reprocessing. In this analysis, we have fixed the black hole mass to estimated from the -line width- luminosity relation described in Greene & Ho (2007b, a) using FWHM width of line. However, in addition, if we allow the mass to vary, the predicted UV flux matches with the observed one for . The best-fit resulted in . The best-fit parameters of TBABSREDDENOPTXAGNF are as follows: , keV, , (P stands for pegged to hard limit), , and . Since there may be uncertainties in the black hole mass measurement this can be a viable option.
4 Long Term X-ray Spectral Variability
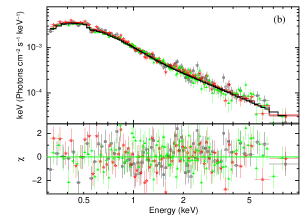
To study long term spectral variability, we next analyzed and fitted the 2001 spectral data. As before, we compared the EPIC-pn, EPIC-MOS1 and EPIC-MOS2 datasets by fitting the WABSPOWERLAW model in the band and comparing the data-to-model ratios in the full band after extrapolating the powerlaw model to the low energies. We did not find any significant calibration issues among the data sets and as before we detected strong soft X-ray excess emission (see Fig. 5). We then modeled the broadband spectrum in the using the same three model as used for the 2012 data. These fits resulted in , and for ionized partial covering absorption, blurred reflection and intrinsic disc models, respectively. The best-fit models, data and the residuals are shown in Fig. 2 (b), 3(b) and 4(b), and the best-fit parameters are listed in Table 2. As before, we also replaced KDBLUR with RELCONV_LP to estimate the height implied for the X-ray source in the lamppost illumination model. The best-fit parameters of WABS(NTHCOMP+RELCONV_LP*REFLIONX) are listed in Table 3.
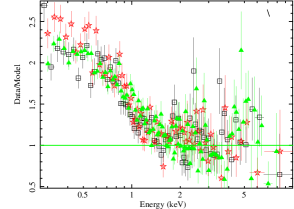
To further investigate the long term variability, we fitted both 2001 and 2012 observation by NTHCOMP+DISKBB model. We used NTHCOMP as a powerlaw component and DISKBB to describe the soft excess component. The soft excess flux obtained from DISKBB in the keV band and the NTHCOMP flux in the keV band remained nearly constant. The NTHCOMP flux in the keV band was about 16% higher and the photon index slightly steeper in the 2001 observation as compared to 2012 observation indicating that the powerlaw component flattened at lower flux in 2012 (see Table 4). We applied the best-fit simple model (NTHCOMP+DISKBB) of 2012 observation to 2001 observation and show the ratio of 2001 data and 2012 model in Fig. 6. The marginal excess is due to slightly steeper powerlaw component at higher flux in 2001. Such spectral variability i.e., steeper spectrum at high flux, is common in Seyfert 1 galaxies (e.g., Nandra et al. 1998; Vaughan & Edelson 2001; Zdziarski & Grandi 2001; Romano et al. 2002; Emmanoulopoulos et al. 2011b).
| Observation | ( keV) | ( keV) | ( keV) | ||
|---|---|---|---|---|---|
| 2001 | |||||
| 2012 |
Note–Flux is measured in units of ergs s-1 cm-2.
| Exposure | POWERLAW | Soft X-ray excess | |||||
|---|---|---|---|---|---|---|---|
| interval (ks) | npl () | () | kTin( eV) | nmulticbb () | () | ||
| 0-14 (A) | 69.0/76 | ||||||
| 14-35 (B) | 66.2/86 | ||||||
| 35-60 (C) | 135.7/111 | ||||||
| 60-85 (D) | 99.9/91 | ||||||
| 85-109 (E) | 128.0/120 | ||||||
| 109-126 (F) | 75.9/84 | ||||||
| 35-45 (C flare) | 90.0/84 | ||||||
| 95-105 (E flare) | 102.2/86 | ||||||
Note– represents the normalization of respective components and flux is measured in units of ergs s-1 cm-2 for EPIC-pn data. The fluxes of both soft excess and powerlaw components were measured from DISKBB and POWERLAW model convolving with CFLUX in the keV and keV bands, respectively. We also modified above model by Galactic absorption while fitting.
5 X-ray and UV variability during 2012 observation
The long observation of 2012 allows us to study the short term variability of the X-rays and the UV emission from the source. We constructed the lightcurve for the UV emission at Å measured with the Optical Monitor (OM: Mason et al., 2001). First we reprocessed the OM data with the OMICHAIN tool. In the total span of exposure, we obtained 6 OM exposures (IDs: 025, 026, 027, 028, 029 and 030), each, of U filter centered at Å. We obtained the source count rates from the source list files generated by the OMICHAIN tool. We also verified these corrected count rates by performing interactive photometry of the source. We selected source region with a radius of 6 pixels and an annular area for background region with inner radius of 8 pixels and outer radius of 13 pixels and obtained the background subtracted count rates from each OM exposure. We used a conversion factor222 of 1.94 erg s-1 cm-2 Å-1 to convert the count rates to flux densities at Å and constructed the OM UV lightcurve. We also derived the UV lightcurves of nearby four sources and compared to the UV lightcurve of II Zw 177. We found that the UV emission from the nearby sources did not vary as the UV emission of this AGN. Hence we concluded that the UV variability of II Zw 177 is intrinsically associated with the AGN.
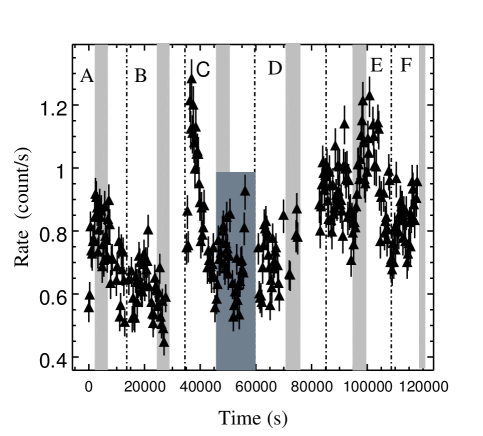
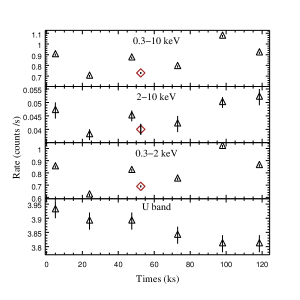
Further, we extracted time-selected spectra from the EPIC-pn data. The time selection is based on the OM exposures. Since each of the OM exposures are only long, the corresponding time-selected X-ray spectra extracted for the same time window as the OM exposures were poor in signal-to-noise ratio. Therefore, we increased exposures of each time-selected spectra to include the OM exposures and required that exposures of two X-ray spectra from neighbouring time slices do not overlap. The time-selection for the X-ray spectra is shown in Fig. 7. The variations of the count rates in , , and OM U band are shown in Fig. 8 (a). All the count rates are observed to be variable on ks timescales with fractional variability amplitudes (Vaughan et al., 2003) of , and for the hard, soft and UV fluxes, respectively (see Fig. 8). Since UV exposure is outside the X-ray flare for time interval C, the inclusion of X-ray flare may bias the correlation between X-ray and UV emission. We therefore used ks interval of time slice C without X-ray flare to derive in both soft and hard band. We found that strengthens with similar values (hard band : , soft band : ).
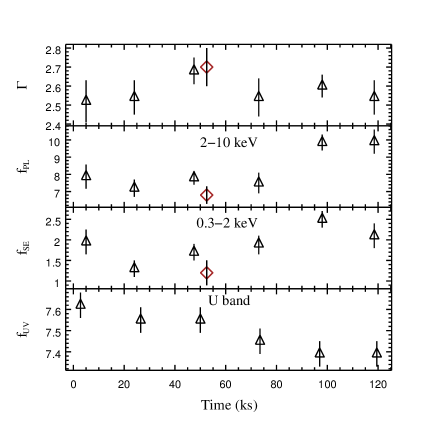
It is clear from Fig. 8 (a) and (b) that the the X-ray fluxes (and X-ray fluxes without C flare) in the soft and hard bands are correlated, The Spearman rank correlation is with a probability that the two are not correlated . However no such correlation exists between the UV flux and the X-ray ones with a Spearman rank probability that they are not correlated being and for the soft and hard bands, respectively. Since each time selected observation did not have enough quality to fit a sophisticated model we used an empirical one namely a combination of multicolour blackbody disc emission (DISKBB) to represent the soft excess and a power-law for the hard continuum. The results of the time-selected spectroscopy are listed in Table 5 and plotted in Fig. 8 (b). Again, we see that while the soft excess and the hard power law fluxes are correlated, the UV flux is not correlated to either of them.
The EPIC-pn lightcurve of II Zw 177 in the keV band has shown strong X-ray flares (see intervals C and E in Fig. 7). In order to study short-term spectral variability, we extracted flare spectra from the intervals and of 2012 data.
We then fitted the individual flare spectra in the C and E intervals with the POWERLAW+DISKBB model. The best-fit parameters of both flares are listed in Table 5. We found the powerlaw fluxes ergs s-1 cm-2 and ergs s-1 cm-2 in keV band for C and E flares, respectively. We also found the soft X-ray excess fluxes ergs s-1 cm-2 and ergs s-1 cm-2 in the keV band for C and E flares, respectively. Thus, our fitting clearly suggests that both powerlaw flux and soft X-ray flux were higher during the flare state compared to nearby intervals (see Table 5. This could be caused due to the rapid changes intrinsic to the corona producing higher powerlaw emission and hence higher soft X-ray excess emission within the frame of reflection model.
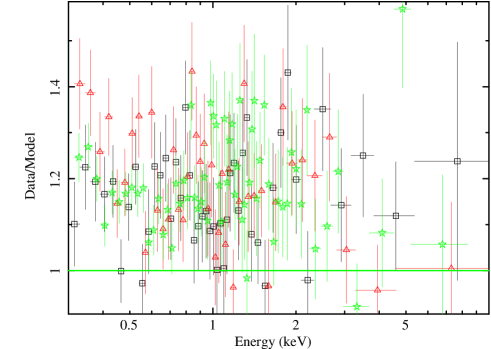
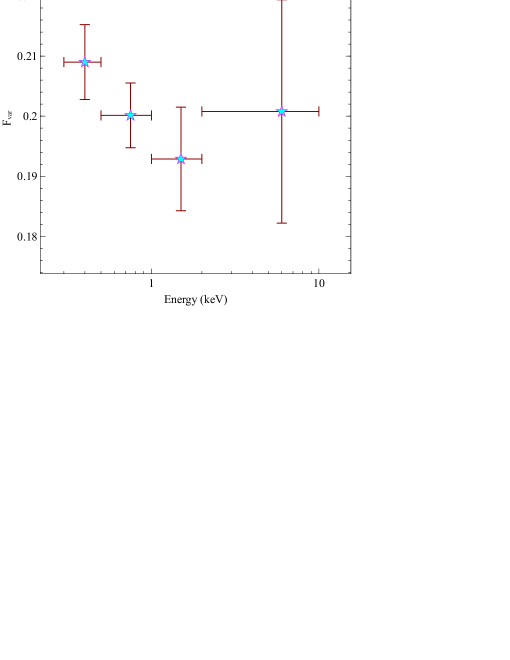
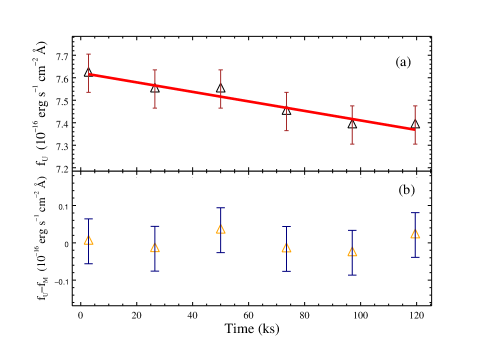
Furthermore, to study fractional variability amplitude () as a function of X-ray energy, we created rms spectrum using source lightcurves with a time binsize of 500s in the keV band. We used the , , and keV bands to find for each energy band. We then plotted values together as shown in Fig. 9. We also calculated the in the keV in order to compare with in the keV band using full EPIC-pn lightcurve with 500s bins. We found in the keV band which is comparable to in the keV band (see Fig. 9). On the other hand, to examine the UV emission variability, we fitted a linear model to the UV lightcurve and found the best-fit function , where the elapsed time in unit of ks. The fit resulted into . The best-fit model and data are shown in the upper panel of Fig. 10. We then subtracted the best-fit predicted UV flux of the line model from the observed UV flux to derive the residual lightcurve. The UV lightcurve corrected for secular decline shows no significant variability (see lower panel of Fig. 10).
6 Summary & Discussion
We studied the broadband UV to X-ray emission from II Zw 177 using two XMM-Newton observations. Our main results are as follows.
Both observations show soft X-ray excess emission below which can be equally well modelled by a blurred reflection and an intrinsic disc Comptonization component. The ionized partially covering model does not describe the data well.
Between the two observations the flux in the - keV varied by around 16% while the flux in the - keV did not vary much. For the blurred reflection model, the emissivity index did not vary and the height of the corona remains consistent (). Perhaps X-ray reprocessing is not contributing to the soft X-ray flux variation. The small change in the soft band flux is likely due to the change in the shape of the powerlaw which appears to be steeper when the soft band flux was higher in 2001.
For the long observation of 2012, the X-ray flux was found to be variable on timescale of ks with fractional variability amplitude of %. Time resolved spectral fitting also revealed that the soft excess represented by thermal emission is well correlated with the hard powerlaw flux.
Extension of the best fit X-ray thermal Comptonization model shows that the observed UV emission is significantly higher than that expected from a standard accretion disc. This discrepancy can be removed if the black hole mass is which is significantly larger than reported in the literature.
The UV flux is found to be weakly variable at a level of %. However, the UV flux is not correlated to the total X-ray flux nor to the X-ray fluxes in the - and - keV bands. The UV flux is also not correlated to the soft excess or powerlaw X-ray components. The gradual decline of the observed UV emission such much longer variability timescale compared to ks, and may be related to the secular decline resulting from changes in the accretion rate.
Within the context of the blurred reflection model our results indicate that the geometry i.e., location of the hard X-ray producing corona does not vary in this source on long timescale. The soft X-ray excess and powerlaw fluxes are similar and other spectral components are also found consistent except slight variation in photon index. Hence the marginal variability is not caused by the X-ray reflection on long timescale. The photon index tends to be more steeper in 2001 observation. This can be seen clearly in the results of the Comptonization model (see Table-2).
The Comptonization model also explains full X-ray band including the soft excess equally well to both 2012 and 2001 observations. Despite the constant temperature of cool Comptonization medium, the slight change in accretion rate (, ) and hence the change in gravitational energy may be causing the long-term variation in high energy emission and hence photon index.
The time-resolved spectroscopy of 2012 observation shows that powerlaw slope was found similar in all time intervals. In particular, we did not observe a clear correlation between the photon index and the powerlaw flux. Hence, the powerlaw flux variability is unlikely to be caused by the variations in the seed flux from accretion disc. The variability is most likely intrinsic to the hot corona. If the hard X-ray source is compact and close to the black hole, then strong light bending effects make the powerlaw component strongly variable and soft X-ray excess weakly variable (Miniutti & Fabian, 2004). This is in contrast to the variability seen in the soft X-ray excess (i.e., the reflection component) and powerlaw components. The soft excess (i.e., the reflection component) and the powerlaw fluxes are correlated with similar fractional variability amplitudes (). Moreover, this is further strongly supported by the rms spectra shown in Fig. 9 suggesting similar variability in soft and hard bands. Hence, intrinsic variations in the corona, possibly unrelated to the changes in the height, must be responsible for the observed variability of the powerlaw and its correlation with the soft X-ray excess. In the blurred reflection model, the soft X-ray excess is expected to follow the intrinsic variations in the coronal emission.
The observed UV emission is weakly variable on timescale of with and further shows no correlation with X-ray emission in the soft () and hard () bands or X-ray spectral components. If the UV emission is the thermal emission from a standard disc, the U band flux with a central wavelength of Å must arise from radii near in the disc where the temperature is for and accretion rate relative to the Eddington rate (as suggested by the OPTXAGNF model). At these radii, the viscous timescale is very long ( for and ). The light crossing time is the time delay between the X-ray emission from a compact corona around the SMBH and the UV emission from the disc. If the UV emission is caused by the reprocessing of X-rays into the disc, then the UV emission is believed to lag behind the X-rays by the light crossing time. If the variable X-rays is dominated by the variations in the seed UV photons, then the X-ray emission is expected to lag behind the UV emission again by the light crossing time. Assuming only viscous heating of accretion disc, the disc emission from each radius can be described as a blackbody with distinct temperature. According to Wein’s law, the blackbody temperature can be deduced from the effective wavelength () peaking in the observed bandpass. Comparing this temperature as from the standard accretion disc, one can find the radius of accretion disc for observed emission in a given bandpass (e.g., Smith & Vaughan 2007). Thus, the light crossing time between the emitting regions of X-ray and UV emission can be derived to be
| (1) |
Where is the relative accretion rate with respect to Eddington rate and is the black hole mass of an AGN. For II Zw 177, for , , . The absence of UV/X-ray correlation on time scale clearly implies that the observed UV emission is not dominated by the reprocessed emission.
The extremely weak () variability of the UV with gradual decline could be part of large amplitude variability on very long time scale such as the viscous time scale. If this is case, any fluctuations in the UV emission on top of the secular decline due to changes in the accretion rate, may be related to the variations in the reprocessed emission. In Fig. 10, we show the residuals obtained by subtracting a linear model representing secular decline from the observed UV emission. There are no significant variation within these residuals that would be attributed to low level X-ray reprocessing. Thus, we find no clear evidence for reprocessed UV emission from II Zw 177. High S/N data are required to fully address this possibility.
In the intrinsic disc Comptonized (i.e., the OPTXAGNF) model, the soft X-ray excess arises from the inner disk itself. Therefore, the variations in the UV and the soft excess emission are expected to be correlated. The absence of any correlation between the UV and soft excess suggests that the soft excess is not dominated by the thermal Comptonization in the disc. As discussed earlier, the correlation between the soft excess and powerlaw emission are consistent with that expected in the blurred reflection model provided that the variations in the powerlaw component are intrinsic to the corona rather than due to the changes in the height of the corona.
Alternatively, perhaps the UV emission is intrinsic to the disc and the variability is due to the variation in some absorbing material in the line of sight. A varying covering fraction at a few percentage level may lead to the % variability seen. However, it is difficult (but perhaps not impossible) to see how a patchy absorbing region extending to could vary on such short timescale as 20 ks. Such a model would also require a larger black hole mass for the system which would aggravate the problem of the short timescale variability of the absorbing clouds.
Essentially, our results indicate that the short term variability of the X-ray and UV emission of AGNs can be complex but have the potential to provide important clues regarding the nature and geometry of the central source. There is evidence that the geometry of the central regions are different for different AGNs and even for a particular AGN, it may change in timescale of years. A comprehensive observational programme for studying simultaneous UV and X-ray emission from several AGNs over different timescale may provide a much clearer picture of the dynamic nature of these sources. Such an endeavour may be possible by the future X-ray mission Astrosat (Singh et al., 2014) which will have the capability of sensitively measuring the simultaneous X-ray and UV emission from AGNs.
7 Acknowledgement
An anonymous referee is gratefully acknowledged for the suggestions/comments which improved the paper. MP and PKP gratefully acknowledge support by the CSIR, New Delhi under the NET fellowship program. This research has made use of () NASA’s Astrophysics Data System, () the SIMBAD database, operated at CDS, Strasbourg, France, () observations obtained with XMM-Newton, an ESA science mission with instruments and contributions directly funded by ESA Member States and NASA, and () data, software and/or web tools obtained from the High Energy Astrophysics Science Archive Research Center (HEASARC), a service of the Astrophysics Science Division at NASA/GSFC and of the Smithsonian Astrophysical Observatory’s High Energy Astrophysics Division.
References
- Ai et al. (2011) Ai Y. L., Yuan W., Zhou H. Y., Wang T. G., Zhang S. H., 2011, ApJ, 727, 31
- Appenzeller et al. (1998) Appenzeller I. et al., 1998, ApJS, 117, 319
- Arévalo & Uttley (2006) Arévalo P., Uttley P., 2006, MNRAS, 367, 801
- Arnaud (1996) Arnaud K. A., 1996, in Astronomical Society of the Pacific Conference Series, Vol. 101, Astronomical Data Analysis Software and Systems V, Jacoby G. H., Barnes J., eds., p. 17
- Arnaud et al. (1985) Arnaud K. A. et al., 1985, MNRAS, 217, 105
- Bechtold et al. (1987) Bechtold J., Czerny B., Elvis M., Fabbiano G., Green R. F., 1987, ApJ, 314, 699
- Bianchi et al. (2009) Bianchi S., Guainazzi M., Matt G., Fonseca Bonilla N., Ponti G., 2009, A&A, 495, 421
- Boller et al. (1996) Boller T., Brandt W. N., Fink H., 1996, A&A, 305, 53
- Breedt et al. (2009) Breedt E. et al., 2009, MNRAS, 394, 427
- Brocksopp et al. (2006) Brocksopp C., Starling R. L. C., Schady P., Mason K. O., Romero-Colmenero E., Puchnarewicz E. M., 2006, MNRAS, 366, 953
- Cackett et al. (2013) Cackett E. M., Fabian A. C., Zogbhi A., Kara E., Reynolds C., Uttley P., 2013, ApJ, 764, L9
- Chiang et al. (2015) Chiang C.-Y., Walton D. J., Fabian A. C., Wilkins D. R., Gallo L. C., 2015, MNRAS, 446, 759
- Corral et al. (2011) Corral A., Della Ceca R., Caccianiga A., Severgnini P., Brunner H., Carrera F. J., Page M. J., Schwope A. D., 2011, A&A, 530, A42
- Crummy et al. (2006) Crummy J., Fabian A. C., Gallo L., Ross R. R., 2006, MNRAS, 365, 1067
- Czerny & Elvis (1987) Czerny B., Elvis M., 1987, ApJ, 321, 305
- Czerny et al. (2003) Czerny B., Nikołajuk M., Różańska A., Dumont A.-M., Loska Z., Zycki P. T., 2003, A&A, 412, 317
- De Marco et al. (2013) De Marco B., Ponti G., Cappi M., Dadina M., Uttley P., Cackett E. M., Fabian A. C., Miniutti G., 2013, MNRAS, 431, 2441
- de Marco et al. (2011) de Marco B., Ponti G., Uttley P., Cappi M., Dadina M., Fabian A. C., Miniutti G., 2011, MNRAS, 417, L98
- Dewangan et al. (2007) Dewangan G. C., Griffiths R. E., Dasgupta S., Rao A. R., 2007, ApJ, 671, 1284
- Dickey & Lockman (1990) Dickey J. M., Lockman F. J., 1990, ARAA, 28, 215
- Done et al. (2012) Done C., Davis S. W., Jin C., Blaes O., Ward M., 2012, MNRAS, 420, 1848
- Done et al. (2013) Done C., Jin C., Middleton M., Ward M., 2013, MNRAS, 434, 1955
- Ebrero et al. (2009) Ebrero J. et al., 2009, A&A, 493, 55
- Edelson et al. (1996) Edelson R. A. et al., 1996, ApJ, 470, 364
- Elvis et al. (1994) Elvis M. et al., 1994, ApJS, 95, 1
- Emmanoulopoulos et al. (2011a) Emmanoulopoulos D., McHardy I. M., Papadakis I. E., 2011a, MNRAS, 416, L94
- Emmanoulopoulos et al. (2011b) Emmanoulopoulos D., Papadakis I. E., McHardy I. M., Nicastro F., Bianchi S., Arévalo P., 2011b, MNRAS, 415, 1895
- Fabian et al. (2002) Fabian A. C., Ballantyne D. R., Merloni A., Vaughan S., Iwasawa K., Boller T., 2002, MNRAS, 331, L35
- Fabian et al. (2000) Fabian A. C., Iwasawa K., Reynolds C. S., Young A. J., 2000, PASP, 112, 1145
- Fabian et al. (2013) Fabian A. C. et al., 2013, MNRAS, 429, 2917
- Fabian et al. (2009) Fabian A. C. et al., 2009, Nat, 459, 540
- Gabriel et al. (2004) Gabriel C. et al., 2004, in Astronomical Society of the Pacific Conference Series, Vol. 314, Astronomical Data Analysis Software and Systems (ADASS) XIII, Ochsenbein F., Allen M. G., Egret D., eds., p. 759
- Galbiati et al. (2005) Galbiati E. et al., 2005, A&A, 430, 927
- Gallo (2006) Gallo L. C., 2006, MNRAS, 368, 479
- Gallo et al. (2006) Gallo L. C., Lehmann I., Pietsch W., Boller T., Brinkmann W., Friedrich P., Grupe D., 2006, MNRAS, 365, 688
- George & Fabian (1991) George I. M., Fabian A. C., 1991, MNRAS, 249, 352
- Gierliński & Done (2004) Gierliński M., Done C., 2004, MNRAS, 349, L7
- Gierliński & Done (2006) Gierliński M., Done C., 2006, MNRAS, 371, L16
- Gliozzi et al. (2013) Gliozzi M., Papadakis I. E., Grupe D., Brinkmann W. P., Räth C., 2013, MNRAS, 433, 1709
- Greene & Ho (2007a) Greene J. E., Ho L. C., 2007a, ApJ, 670, 92
- Greene & Ho (2007b) Greene J. E., Ho L. C., 2007b, ApJ, 667, 131
- Grupe et al. (1998) Grupe D., Beuermann K., Thomas H.-C., Mannheim K., Fink H. H., 1998, A&A, 330, 25
- Guilbert & Rees (1988) Guilbert P. W., Rees M. J., 1988, MNRAS, 233, 475
- Haardt & Maraschi (1991) Haardt F., Maraschi L., 1991, ApJ, 380, L51
- Janiuk et al. (2001) Janiuk A., Czerny B., Madejski G. M., 2001, ApJ, 557, 408
- Jansen et al. (2001) Jansen F. et al., 2001, A&A, 365, L1
- Kara et al. (2013) Kara E., Fabian A. C., Cackett E. M., Steiner J. F., Uttley P., Wilkins D. R., Zoghbi A., 2013, MNRAS, 428, 2795
- Kotov et al. (2001) Kotov O., Churazov E., Gilfanov M., 2001, MNRAS, 327, 799
- Laor et al. (1997) Laor A., Fiore F., Elvis M., Wilkes B. J., McDowell J. C., 1997, ApJ, 477, 93
- Leighly (1999) Leighly K. M., 1999, ApJS, 125, 317
- Lightman & White (1988) Lightman A. P., White T. R., 1988, ApJ, 335, 57
- Lyubarskii (1997) Lyubarskii Y. E., 1997, MNRAS, 292, 679
- Magdziarz et al. (1998) Magdziarz P., Blaes O. M., Zdziarski A. A., Johnson W. N., Smith D. A., 1998, MNRAS, 301, 179
- Mason et al. (2001) Mason K. O. et al., 2001, A&A, 365, L36
- Matt et al. (1991) Matt G., Perola G. C., Piro L., 1991, A&A, 247, 25
- McHardy et al. (2014) McHardy I. M. et al., 2014, MNRAS, 444, 1469
- McHardy et al. (2004) McHardy I. M., Papadakis I. E., Uttley P., Page M. J., Mason K. O., 2004, MNRAS, 348, 783
- Mehdipour et al. (2011) Mehdipour M. et al., 2011, A&A, 534, A39
- Middleton et al. (2007) Middleton M., Done C., Gierliński M., 2007, MNRAS, 381, 1426
- Miniutti & Fabian (2004) Miniutti G., Fabian A. C., 2004, MNRAS, 349, 1435
- Miniutti et al. (2009) Miniutti G., Ponti G., Greene J. E., Ho L. C., Fabian A. C., Iwasawa K., 2009, MNRAS, 394, 443
- Miyamoto et al. (1988) Miyamoto S., Kitamoto S., Mitsuda K., Dotani T., 1988, Nat, 336, 450
- Nandra et al. (1998) Nandra K., Clavel J., Edelson R. A., George I. M., Malkan M. A., Mushotzky R. F., Peterson B. M., Turner T. J., 1998, ApJ, 505, 594
- Nowak et al. (1999) Nowak M. A., Vaughan B. A., Wilms J., Dove J. B., Begelman M. C., 1999, ApJ, 510, 874
- Papadakis et al. (2001) Papadakis I. E., Nandra K., Kazanas D., 2001, ApJ, 554, L133
- Puchnarewicz et al. (1992) Puchnarewicz E. M. et al., 1992, MNRAS, 256, 589
- Reeves et al. (2008) Reeves J., Done C., Pounds K., Terashima Y., Hayashida K., Anabuki N., Uchino M., Turner M., 2008, MNRAS, 385, L108
- Reynolds & Nowak (2003) Reynolds C. S., Nowak M. A., 2003, PhR, 377, 389
- Romano et al. (2002) Romano P., Turner T. J., Mathur S., George I. M., 2002, ApJ, 564, 162
- Ross & Fabian (2005) Ross R. R., Fabian A. C., 2005, MNRAS, 358, 211
- Saxton et al. (2008) Saxton R. D., Read A. M., Esquej P., Freyberg M. J., Altieri B., Bermejo D., 2008, A&A, 480, 611
- Schlafly & Finkbeiner (2011) Schlafly E. F., Finkbeiner D. P., 2011, ApJ, 737, 103
- Schurch & Done (2006) Schurch N. J., Done C., 2006, MNRAS, 371, 81
- Schurch & Done (2008) Schurch N. J., Done C., 2008, MNRAS, 386, L1
- Schurch et al. (2009) Schurch N. J., Done C., Proga D., 2009, ApJ, 694, 1
- Shakura & Sunyaev (1973) Shakura N. I., Sunyaev R. A., 1973, A&A, 24, 337
- Shields (1978) Shields G. A., 1978, Nat, 272, 706
- Singh et al. (1985) Singh K. P., Garmire G. P., Nousek J., 1985, ApJ, 297, 633
- Singh et al. (2014) Singh K. P. et al., 2014, in Society of Photo-Optical Instrumentation Engineers (SPIE) Conference Series, Vol. 9144, Society of Photo-Optical Instrumentation Engineers (SPIE) Conference Series, p. 1
- Smith & Vaughan (2007) Smith R., Vaughan S., 2007, MNRAS, 375, 1479
- Sobolewska & Done (2005) Sobolewska M., Done C., 2005, in American Institute of Physics Conference Series, Vol. 774, X-ray Diagnostics of Astrophysical Plasmas: Theory, Experiment, and Observation, Smith R., ed., pp. 317–319
- Sobolewska & Done (2007) Sobolewska M. A., Done C., 2007, MNRAS, 374, 150
- Strüder et al. (2001) Strüder L. et al., 2001, A&A, 365, L18
- Sunyaev & Titarchuk (1980) Sunyaev R. A., Titarchuk L. G., 1980, A&A, 86, 121
- Tanaka et al. (1995) Tanaka Y. et al., 1995, Nat, 375, 659
- Turner et al. (2001) Turner M. J. L. et al., 2001, A&A, 365, L27
- Vaughan & Edelson (2001) Vaughan S., Edelson R., 2001, ApJ, 548, 694
- Vaughan et al. (2003) Vaughan S., Edelson R., Warwick R. S., Uttley P., 2003, MNRAS, 345, 1271
- Vaughan et al. (1999) Vaughan S., Reeves J., Warwick R., Edelson R., 1999, MNRAS, 309, 113
- Véron-Cetty & Véron (2006) Véron-Cetty M.-P., Véron P., 2006, A&A, 455, 773
- Voges et al. (1999) Voges W. et al., 1999, A&A, 349, 389
- Walter & Fink (1993) Walter R., Fink H. H., 1993, A&A, 274, 105
- Walton et al. (2013) Walton D. J., Nardini E., Fabian A. C., Gallo L. C., Reis R. C., 2013, MNRAS, 428, 2901
- Zdziarski & Grandi (2001) Zdziarski A. A., Grandi P., 2001, ApJ, 551, 186
- Zdziarski et al. (1996) Zdziarski A. A., Johnson W. N., Magdziarz P., 1996, MNRAS, 283, 193
- Zhou et al. (2006) Zhou H., Wang T., Yuan W., Lu H., Dong X., Wang J., Lu Y., 2006, ApJS, 166, 128
- Zoghbi & Fabian (2011) Zoghbi A., Fabian A. C., 2011, MNRAS, 418, 2642
- Zoghbi et al. (2010) Zoghbi A., Fabian A. C., Uttley P., Miniutti G., Gallo L. C., Reynolds C. S., Miller J. M., Ponti G., 2010, MNRAS, 401, 2419
- Zoghbi et al. (2011) Zoghbi A., Uttley P., Fabian A. C., 2011, MNRAS, 412, 59