Curvature-dependence of the liquid-vapor surface tension
beyond the Tolman approximation
Abstract
Surface tension is a macroscopic manifestation of the cohesion of
matter, and its value is readily measured for a flat
liquid-vapor interface. For interfaces with a small radius of
curvature , the surface tension might differ from
. The Tolman equation, , with a constant length, is commonly
used to describe nanoscale phenomena such as nucleation.
Here we report experiments on nucleation of bubbles in ethanol and
-heptane, and their analysis in combination with their
counterparts for the nucleation of droplets in supersaturated
vapors, and with water data. We show that neither a constant
surface tension nor the Tolman equation can consistently describe
the data. We also investigate a model including and
terms in . We describe a general procedure to obtain the
coefficients of these terms from detailed nucleation
experiments.
This work explains the conflicting values obtained for the Tolman
length in previous analyses, and suggests directions for future
work.
Accepted to Physical Review Letters.
Nucleation in metastable phases is an ubiquitous phenomenon, relevant to important fields such as atmospheric research Murray et al. (2012), mechanics of plants and trees Forterre (2013); Noblin et al. (2012); Wheeler and Stroock (2008), and in the chemical industry to avoid vapor explosions accidents (or “spill accidents”) Debenedetti (1996a). The nucleation rate is exquisitely sensitive to the value of the surface tension between the metastable and the stable phase. As the size of the critical nucleus that triggers the phase change is in the nanometer range, the value of relevant to nucleation may differ from the bulk one. The idea of a dependence of the surface tension on the curvature of the interface between phases has been studied by Tolman Tolman (1949), who proposed for a spherical droplet with radius
| (1) |
where is the Tolman length. Determining in experiments is critical to developing accurate nucleation theories. It can also serve as an input to validity checks of density functional theory calculations and numerical simulations. More generally, the small scale limit at which macroscopic laws break down is an active field of research, as shown for instance by recent studies on vapor pressure of nanodroplets Factorovich et al. (2014), or on flows in nanochannels Huber (2015), that are of crucial importance for oil recovery and catalysis.
The curvature dependence of surface tension has been mainly studied theoretically and numerically, with conflicting results about the magnitude and even the sign of the effect Tolman (1949); Block et al. (2010); Tröster et al. (2012); Joswiak et al. (2013); Hrubý et al. (2007); Bykov and Zeng (1999); Bennett and Barrett (2012); van Giessen and Blokhuis (2009); Horsch et al. (2012); Santiso and Firoozabadi (2006); Moody and Attard (2003). The dearth of experimental data stems from the difficulties inherent to measurements on nanoscopic objects. In this work we circumvent this problem by use of the nucleation theorem (NT) Oxtoby and Kashchiev (1994); Kashchiev (2006), which allows obtaining information on the nanoscopic critical nucleus from a macroscopic observable, the nucleation rate (number of nucleation events per unit volume and time). In addition, we adopt a comprehensive approach, treating on the same footing the two symmetric cases of nanodroplets (related to the nucleation of a liquid from a supersaturated vapor, condensation) and nanobubbles (related to the nucleation of a vapor in a metastable liquid, cavitation). To complement existing data on condensation, we have performed acoustic cavitation experiments on ethanol and heptane.
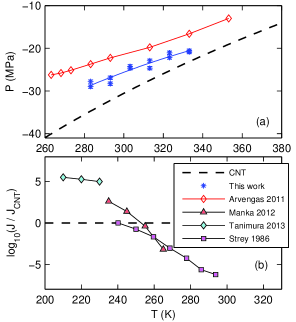
In acoustic cavitation, the liquids are stretched using a few cycles of a focused acoustic wave at 1 MHz to trigger nucleation (see Herbert et al. (2006) and Supplemental Material, SM, for details). The wave frequency sets the experimental time and volume, and consequently the observable nucleation rate. The pressure at which this rate is reached is shown in Fig. 1(a) for ethanol and in Fig. S1(a) of the SM for heptane. Compared to a previous study where the cavitation pressures were based on an indirect estimate Arvengas et al. (2011a), we have now measured them directly with a fiber-optic probe hydrophone (FOPH) Arvengas et al. (2011b). These more accurate measurements lead to lower pressures than the previous study, as expected because of the nonlinearities in the acoustic wave (see SM and Appert et al. (2003); Davitt et al. (2010)).
An excellent introduction to the concept of curvature-dependent surface tension can be found in Tröster et al. (2012). We just introduce here the relevant quantities on the example of condensation. Consider a small spherical droplet of liquid in equilibrium with its supersaturated vapor at chemical potential . The pressure of the bulk liquid and vapor at are and , and their densities and , respectively. The key point is that the surface tension depends on the radius chosen for the dividing sphere which separates by convention the liquid and vapor regions. Two radii are of particular interest in describing the droplet. The first is , the radius of the equimolar dividing surface. The second is , the radius of the sphere at which the Laplace relation is fulfilled:
| (2) |
where . allows to write the energy barrier for nucleation in a compact form:
| (3) |
In classical nucleation theory (CNT), the nucleation rate for the phase change is
| (4) |
with a prefactor, whose expression is given in the SM. The knowledge of at a given or (the quantity controlled in an experiment) thus gives access to from Eq. (4), from Eq. (3) and from Eq. (2). Starred quantities are relative to the critical nucleus, at which the energy barrier is reached. In addition, experiments can give access to Oxtoby and Kashchiev (1994); Kashchiev (2006). Indeed, if the dependence of on is known, the excess number of molecules in the critical nucleus is
| (5) |
For , and assuming a spherical critical droplet whose density at the center reaches the bulk value, this leads to an expression for the volume of the sphere with radius (see SM):
| (6) |
Eqs. (3) to (6) hold for both cavitation and condensation, provided that adequate expressions for , and are used.
To test different models for the surface tension, we have used experimental values of at known (condensation data), or, equivalently, at fixed (cavitation data), and . The models are described below and are summarized in Table 1.
| Model | Surface tension | Free parameters | Input data |
|---|---|---|---|
| CNT0 | None | None | |
| CNT1 | |||
| CNT2 | and | and |
In the standard version of the CNT Debenedetti (1996b), CNT0, is assumed to always remain equal to the value for a planar interface , which is equivalent to setting , and . CNT0 is notorious to fail in predicting correct nucleation rates, for cavitation Azouzi et al. (2013) as well as for condensation Ghosh et al. (2010); Kim et al. (2004); Luijten et al. (1997); Holten et al. (2005); Manka et al. (2012); Bennett and Barrett (2012); Hyvärinen et al. (2004); Peeters et al. (2002); Fisk and Katz (1996). This appears clearly in Figs. 1 and S1, where the FOPH experiments are plotted along with condensation data Manka et al. (2012); Tanimura et al. (2013); Strey et al. (1986); Ghosh et al. (2010); Rudek et al. (1996); Holten et al. (2005); Wölk and Strey (2001); Brus et al. (2008), and with a cavitation point from a water inclusion in quartz Azouzi et al. (2013). For instance, Figs. 1(b) and S1(b,d) highlight for the three fluids a crossover temperature below which CNT0 underestimates the condensation rates, and above which they are overestimated. This crossover had already been observed in single data sets for ethanol and water condensation, e.g. Manka et al. (2012) and Mikheev et al. (2002), and the combination of several sets makes this conclusion stronger.
We therefore investigate other models with . We use a functional form suggested by simulations Tröster et al. (2012):
| (7) |
Starting with a first variant of CNT, CNT1, which assumes in Eq. (7), it can be shown that Tröster et al. (2012)
| (8) |
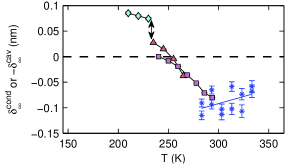
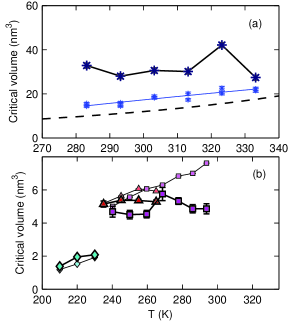
which is similar to Eq. (1). One can then calculate from the experimental nucleation rates (see SM). The analysis usually stops there Holten et al. (2005); Azouzi et al. (2013); Joswiak et al. (2013), which does not provide a full test of CNT1. We take a step further, and predict from with CNT1 (see SM). A comparison between predicted and deduced from the experiments with the NT Eq. (6) becomes possible. To our knowledge, this type of reasoning has been employed only for water Holten et al. (2005); Azouzi et al. (2013), with a seemingly satisfactory agreement. By a more comprehensive analysis of all the data sets gathered for ethanol, heptane and water, covering a broader range for temperature and degree of metastability, we find discrepancies that reveal the actual failure of CNT1. Figs. 2 and S2 show calculated from the cavitation and condensation experiments. Quantities relative to cavitation and condensation are labelled by ‘cav’ or ‘cond’, respectively. If CNT1 were valid, we would expect to find that and do not depend on and that for the same temperatures Tröster et al. (2012). For each of the fluids, the points do not collapse on a single curve, as indicated by the double arrows, even when taking into account the experimental uncertainties (see SM for details). This suggests that does in fact depend on . We emphasize that the disagreement can usually not be seen when looking at the data of a single condensation experiment. This is because various independent supersaturation and temperature values are needed to conclude and the combination of several condensation and cavitation experiments extends the range of both parameters. The crossover mentioned earlier translates here into a change of from positive to negative values when increases (Figs. 2 and S2). This behavior is not in support of CNT1. The situation gets even worse when comparing in Figs. 3 and S3 extracted from this model (small, light markers) with obtained using the NT (big, dark markers). In overall, these agree at low temperature, but strongly disagree above 250-300 K depending on the fluid. We note that the approximations needed to deduce from experiments with Eq. (6) lead to an underestimate of for both cavitation and condensation, so that the disagreement with CNT1 can be only stronger than shown in Figs. 3 and S3. Also, the critical volumes for cavitation may display a systematic error bigger than the statistical error bars shown here because of an extrapolation in the data analysis. All these details are investigated in the SM and Refs. Oxtoby (1998); Kashchiev (2003) and do not change any of our conclusions.
We now move on to a second variant of CNT, CNT2, based on Eq. (7) with two parameters and . It can then be shown that Baidakov and Bobrov (2014):
| (9) |
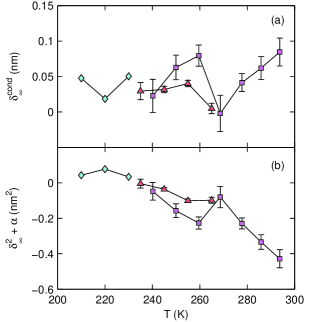
It may seem that adding an extra parameter would automatically allow a better fitting of the data. But we also use more experimental input (see Table 1). For CNT1, we used only the experimental nucleation rates to calculate , and compared the CNT1 prediction for with the values from experiments on which the nucleation theorem can be applied. For CNT2, we use both the nucleation rates and from those experiments to directly calculate and (see SM). The success of the approach must therefore be assessed by checking if the various data sets lead to master curves for both and as a function of the temperature. The results are plotted in Figs. 4 and S4. We have omitted here the FOPH data, since, unfortunately, the corresponding error bars on and would be of the order of the size of the -axes (see SM). For heptane, only one data set is available and does not allow to test the data collapse. For the other fluids, we observe a more consistent description of the data (see in particular the improvement of the discrepancy between the Tanimura 2013 and the Manka 2012 data compared to Fig. 2). The agreement is still not perfect, even when taking into account the statistical uncertainties on the points. This is possibly indicative of systematic errors specific to the different experiments, or of some limitation of the theory, such as that of a spherical critical nucleus. Compared to CNT1, CNT2 yields a Tolman length with a weaker temperature dependence, and for ethanol and water now keeps a positive sign. For heptane, is close to zero, maybe slightly negative. For the three fluids, we noted that the second order term is often of the same order of magnitude as the first order term (see SM).
Our results show that, at least for ethanol, heptane and water, the usual Tolman equation Eq. (1) is not enough to properly describe experiments. Therefore, attempts to analyse experiments with CNT1 (such as in Azouzi et al. (2013); Holten et al. (2005); Joswiak et al. (2013)) may yield inaccurate determinations of , and this study partly explains the confusion in the longstanding debate on the sign of the Tolman length Malijevský and Jackson (2012). The CNT2 approach seems to give more consistent results.
A variety of simulations have been realized and motivated our work. We have tried to compare the experiments to these. For heptane, the we found is close to zero and possibly negative (around ). An expression of the Tolman length as a function of the isothermal compressibility has been proposed Bartell (2001); Blokhuis and Kuipers (2006): . At 265 K, the formula yields nm for heptane, which is close to the experiments in Fig. S4(a). Heptane may be crudely approximated by a Lennard-Jones fluid, for which DFT calculations and MC simulations Block et al. (2010); Tröster et al. (2012) seem to point to a slightly negative value for ( nm). However, MD simulations Baidakov and Bobrov (2014) find a positive temperature-dependent ( nm at 265 K). Also, Iwamastu Iwamatsu (1994) estimated the Tolman length from the correlation lengths of the liquid and vapor phases, which for heptane translates into nm, which has a larger magnitude than the experimental value. The parameter has been estimated by MD simulations Baidakov and Bobrov (2014) and by DFT Block et al. (2010); Blokhuis and van Giessen (2013). Rescaled to heptane, these estimates all lead to a positive of about 0.4 Baidakov and Bobrov (2014), while the Rudek data set displays mostly negative values: in average in the 250-275 K range. By identifying Eq. (9) to the Helfrich form of the surface free energy in Ref. (50), we find the average curvature-elastic moduli J.
For the other fluids, the different experiments partially collapse on master curves, thus supporting the CNT2 model, but they can hardly be compared to simulations or DFT estimates based on the Lennard-Jones potential. For water, we first note that within CNT2, the cavitation Azouzi et al. (2013) and the condensation Brus et al. (2008) experiments yield to positive or . This sign is consistent with simulations based on a monoatomic model of water (mW) where a departure from the Kelvin equation is observed at small droplet radii Factorovich et al. (2014). However, the CNT2 analysis of two simulations with TIP4P/2005 Joswiak et al. (2013); González et al. (2014) would give the opposite sign: nm at 300 K for Joswiak et al. (2013) that measured directly the radius-dependence of the surface free energy of droplets, and nm for the cavitation simulations in González et al. (2014) from which we have calculated with the energy barrier and the critical volume (using the data from their “M-method” to estimate ).
While our conclusions on the inaccuracy of the CNT1 model are unambiguous — we strongly recommend not to use the Tolman equation when analysing nucleation data —, they call for further experiments to confirm the CNT2 model. As the vapor supersaturation can be varied over a broad range in experiments on condensation, they should be more appropriate than cavitation. For ethanol, the success of CNT2 is already very promising, and we provide in the SM overall fitting parameters for and that can be used to predict the nucleation rate from any condition. For other fluids, our study provides a procedure with which future measurements of nucleation rates and critical volumes can be analysed.
Acknowledgements.
We acknowledge funding by the ERC under the European FP7 Grant Agreement 240113, and by the Agence Nationale de la Recherche Grant 09-BLAN-0404-01.References
- Murray et al. (2012) B. J. Murray, D. O’Sullivan, J. D. Atkinson, and M. E. Webb, Chem. Soc. Rev. 41, 6519 (2012).
- Forterre (2013) Y. Forterre, J. Exp. Bot. (2013).
- Noblin et al. (2012) X. Noblin, N. O. Rojas, J. Westbrook, C. Llorens, M. Argentina, and J. Dumais, Science 335, 1322 (2012).
- Wheeler and Stroock (2008) T. D. Wheeler and A. D. Stroock, Nature 455, 208 (2008).
- Debenedetti (1996a) P. G. Debenedetti, Metastable Liquids (Princeton University Press, 1996).
- Tolman (1949) R. C. Tolman, J. Chem. Phys. 17, 333 (1949).
- Factorovich et al. (2014) M. H. Factorovich, V. Molinero, and D. A. Scherlis, J. Am. Chem. Soc. 136, 4508 (2014).
- Huber (2015) P. Huber, J. Phys.: Condens. Matter 27, 103102 (2015).
- Block et al. (2010) B. J. Block, S. K. Das, M. Oettel, P. Virnau, and K. Binder, J. Chem. Phys. 133, 154702 (2010).
- Tröster et al. (2012) A. Tröster, M. Oettel, B. Block, P. Virnau, and K. Binder, J. Chem. Phys. 136, 064709 (2012).
- Joswiak et al. (2013) M. N. Joswiak, N. Duff, M. F. Doherty, and B. Peters, J. Phys. Chem. Lett. 4, 4267 (2013).
- Hrubý et al. (2007) J. Hrubý, D. G. Labetski, and M. E. H. van Dongen, J. Chem. Phys. 127, 164720 (2007).
- Bykov and Zeng (1999) T. V. Bykov and X. C. Zeng, J. Chem. Phys. 111, 3705 (1999).
- Bennett and Barrett (2012) T. P. Bennett and J. C. Barrett, J. Chem. Phys. 137, 124702 (2012).
- van Giessen and Blokhuis (2009) A. E. van Giessen and E. M. Blokhuis, J. Chem. Phys. 131, 164705 (2009).
- Horsch et al. (2012) M. Horsch, H. Hasse, A. K. Shchekin, A. Agarwal, S. Eckelsbach, J. Vrabec, E. A. Müller, and G. Jackson, Phys. Rev. E 85, 031605 (2012).
- Santiso and Firoozabadi (2006) E. Santiso and A. Firoozabadi, AIChE J. 52, 311 (2006).
- Moody and Attard (2003) M. P. Moody and P. Attard, Phys. Rev. Lett. 91, 056104 (2003).
- Oxtoby and Kashchiev (1994) D. W. Oxtoby and D. Kashchiev, J. Chem. Phys. 100, 7665 (1994).
- Kashchiev (2006) D. Kashchiev, J. Chem. Phys. 125, 014502 (2006).
- Herbert et al. (2006) E. Herbert, S. Balibar, and F. Caupin, Phys. Rev. E 74, 041603 (2006).
- Arvengas et al. (2011a) A. Arvengas, E. Herbert, S. Cersoy, K. Davitt, and F. Caupin, J. Phys. Chem. B 115, 14240 (2011a).
- Arvengas et al. (2011b) A. Arvengas, K. Davitt, and F. Caupin, Rev. Sci. Instrum. 82, 034904 (2011b).
- Appert et al. (2003) C. Appert, C. Tenaud, X. Chavanne, S. Balibar, F. Caupin, and D. d’Humiéres, Eur. Phys. J. B 35, 531 (2003).
- Davitt et al. (2010) K. Davitt, E. Rolley, F. Caupin, A. Arvengas, and S. Balibar, J. Chem. Phys. 133, (2010).
- Debenedetti (1996b) P. G. Debenedetti, “Metastable liquids,” (Princeton University Press, 1996) Chap. Kinetics, pp. 148–234.
- Azouzi et al. (2013) M. E. M. Azouzi, C. Ramboz, J.-F. Lenain, and F. Caupin, Nat. Phys. 9, 38 (2013).
- Ghosh et al. (2010) D. Ghosh, D. Bergmann, R. Schwering, J. Wölk, R. Strey, S. Tanimura, and B. E. Wyslouzil, J. Chem. Phys. 132, 024307 (2010).
- Kim et al. (2004) Y. J. Kim, B. E. Wyslouzil, G. Wilemski, J. Wölk, and R. Strey, J. Phys. Chem. A 108, 4365 (2004).
- Luijten et al. (1997) C. C. M. Luijten, K. J. Bosschaart, and M. E. H. van Dongen, J. Chem. Phys. 106, 8116 (1997).
- Holten et al. (2005) V. Holten, D. G. Labetski, and M. E. H. van Dongen, J. Chem. Phys. 123, 104505 (2005).
- Manka et al. (2012) A. A. Manka, J. Wedekind, D. Ghosh, K. Höhler, J. Wölk, and R. Strey, J. Chem. Phys. 137, 054316 (2012).
- Hyvärinen et al. (2004) A.-P. Hyvärinen, H. Lihavainen, Y. Viisanen, and M. Kulmala, J. Chem. Phys. 120, 11621 (2004).
- Peeters et al. (2002) P. Peeters, J. J. H. Gielis, and M. E. H. van Dongen, J. Chem. Phys. 117, 5647 (2002).
- Fisk and Katz (1996) J. A. Fisk and J. L. Katz, J. Chem. Phys. 104, 8649 (1996).
- Tanimura et al. (2013) S. Tanimura, H. Pathak, and B. E. Wyslouzil, J. Chem. Phys. 139, 174311 (2013).
- Strey et al. (1986) R. Strey, P. E. Wagner, and T. Schmeling, J. Chem. Phys. 84, 2325 (1986).
- Rudek et al. (1996) M. M. Rudek, J. A. Fisk, V. M. Chakarov, and J. L. Katz, J. Chem. Phys. 105, 4707 (1996).
- Wölk and Strey (2001) J. Wölk and R. Strey, J. Phys. Chem. B 105, 11683 (2001).
- Brus et al. (2008) D. Brus, V. Ždímal, and J. Smolík, J. Chem. Phys. 129, 174501 (2008).
- Mikheev et al. (2002) V. B. Mikheev, P. M. Irving, N. S. Laulainen, S. E. Barlow, and V. V. Pervukhin, J. Chem. Phys. 116, 10772 (2002).
- Oxtoby (1998) D. W. Oxtoby, Acc. Chem. Res. 31, 91 (1998).
- Kashchiev (2003) D. Kashchiev, J. Chem. Phys. 118, 1837 (2003).
- Baidakov and Bobrov (2014) V. G. Baidakov and K. S. Bobrov, J. Chem. Phys. 140, 184506 (2014).
- Malijevský and Jackson (2012) A. Malijevský and G. Jackson, J. Phys.: Condens. Matter 24, 464121 (2012).
- Bartell (2001) L. S. Bartell, J. Phys. Chem. B 105, 11615 (2001).
- Blokhuis and Kuipers (2006) E. M. Blokhuis and J. Kuipers, J. Chem. Phys. 124, (2006).
- Iwamatsu (1994) M. Iwamatsu, J. Phys.: Condens. Matter 6, L173 (1994).
- Blokhuis and van Giessen (2013) E. M. Blokhuis and A. E. van Giessen, J. Phys.: Condens. Matter 25, 225003 (2013).
- Helfrich (1973) W. Helfrich, Z. Naturforsch. C 28, 693 (1973).
- González et al. (2014) M. A. González, G. Menzl, J. L. Aragones, P. Geiger, F. Caupin, J. L. F. Abascal, C. Dellago, and C. Valeriani, J. Chem. Phys. 141, 18C511 (2014).