Reduction in Tension and Stiffening of Lipid Membranes in an Electric Field Revealed by X-ray Scattering
Abstract
The effect of AC electric fields on the elasticity of supported lipid bilayers has been investigated at the microscopic level using grazing incidence synchrotron x-ray scattering. A strong decrease in the membrane tension up to 1mN/m and a dramatic increase of its effective rigidity up to 300kBT are observed for local electric potentials seen by the membrane 1V. The experimental results were analyzed using detailed electrokinetic modeling and non-linear Poisson-Boltzmann theory. Based on a modeling of the electromagnetic stress which provides an accurate description of bilayer separation vs pressure curves, we show that the decrease in tension results from the amplification of charge fluctuations on the membrane surface whereas the increase in bending rigidity results from direct interaction between charges in the electric double layer. These effects eventually lead to a destabilization of the bilayer and vesicle formation. Similar effects are expected at the tens of nanometer lengthscale in cell membranes with lower tension, and could explain a number of electrically driven processes.
Electric fields can be used to destabilize lipid bilayers as in the electroformation process, the most popular method to form large unilamellar vesicles Angelova and Dimitrov (1986), or to manipulate the shape of vesicles Riske and Dimova (2005); Dimova et al. (2009); Salipante et al. (2015).
Beyond biosensor applications and the investigation of fundamental mechanical, dynamical and binding properties of membranes using impedance spectroscopy or dielectric
relaxation Hianik (2000), the strong influence of electric fields on lipid membrane behavior is also used in numerous applications in cell biology, biotechnology and pharmacology Zhao et al. (2006); Zimmermann (1986) such as cell hybridization Zimmermann and Neil (1996), electroporation Son et al. (2014), electrofusion Rems et al. (2013) and electropermeabilization Vernier et al. (2006).
All these effects imply a strong deformation of the membranes in the field, the understanding of which in terms of elastic properties is therefore of prime importance Vlahovska (2015).
Theoretically, the effect of electric fields on membrane tension has been investigated in Ref. Sens and Isambert (2002), which was extended to bending rigidity in Refs Ziebert et al. (2010); Ziebert and Lacoste (2010, 2011); Ambjörnsson et al. (2007); Loubet et al. (2013).
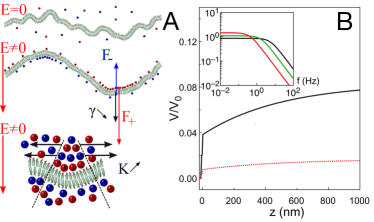
When placed in an electric field , charges of opposite sign will accumulate at both sides of a membrane which can be seen as a capacitor with surface charge densities (see Fig.1.A), allowing to calculate the normal component of the electromagnetic stress sup (a). For a flat membrane, a direct consequence is electrostriction: at equilibrium, the elastic response of the membrane (Young modulus Pa Picas et al. (2012); Hianik (2000)) balances the electrostatic pressure Fadda et al. (2013). Beyond this simple effect, membrane fluctuations modify the boundary conditions for the electric field, leading to a subtle coupling between electrostatics and membrane elasticity. Due to membrane finite thickness , a bending deformation induces surface element variations of opposite sign on both interface leading to a net local charge of the bilayer (see Fig. 1.A, bottom). For a given surface mode , the surface charge density fluctuations are given by , where is the membrane permittivity, the field seen by the membrane, and the local curvature. Calculating the work of the electromagnetic stress leads to . As is the increase in area of the fluctuating membrane, this means that there is a negative correction to the free energy, equivalent to a negative (destabilizing) contribution to the membrane surface tension Sens and Isambert (2002); sup (a).
Similar effects occur in the electric double layer leading to a total correction , where is the usually smaller correction coming from the electrical double layer Ziebert and Lacoste (2010, 2011); Ambjörnsson et al. (2007); Loubet et al. (2013); sup (a).
Taking into account non-linear effects in the electric double layer we have,
| (1) |
where is the local electric potential seen by the bilayer and the double electric layer, lower than the applied potential (Fig.1.B). is a dimensionless parameter depending on Debye length and voltage, saturating to 1 for either high salt concentration or high voltage because of non-linear effects in the double electric layer Ziebert and Lacoste (2010, 2011); sup (a). Further development in powers of give contributions in Ziebert and Lacoste (2010, 2011); Ambjörnsson et al. (2007); Salipante et al. (2015), corresponding to a positive correction to the membrane bending rigidity : bending brings the charges closer and increases the electrostatic repulsion (see Fig.1.A, bottom part). Consistently, the largest correction is now due to the thick double layer and is proportional to :
| (2) |
where is the permittivity of water.
The model system we have used consisted of two supported bilayers of DSPC ( 1,2-distearoyl-sn-glycero-3-phosphocholine, Avanti Polar Lipids, Lancaster, Alabama) deposited on ultra-flat silicon substrates (Fig. 2.A) Charitat et al. (1999). All the experiments were performed in fluid phase at 58∘C. The first bilayer serves as a spacer to reduce the interaction between the floating second bilayer and the substrate and keeps it free to fluctuate Daillant et al. (2005); Hemmerle et al. (2012). Potential was applied between a Cu layer deposited at the back of the thick Si substrate and an ITO coated glass plate mounted parallel to the substrate, 0.5 cm from the membrane.
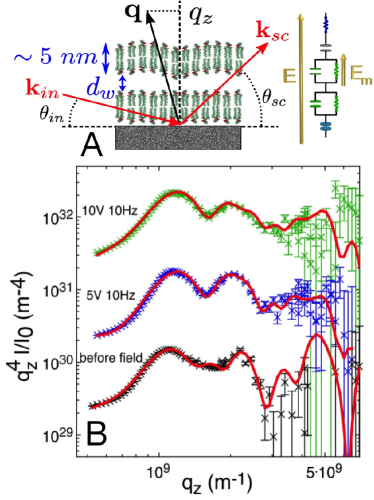
We used a keV x-ray beam (wavelength nm) at the CRG-IF beamline of the European Synchrotron Radiation Facility (ESRF) in an off-specular geometry described in Fig. 2.A sup (b). The grazing angle of incidence is kept fixed ( mrad), below the critical angle for total external reflection mrad as this allows easy background subtraction, and is scanned in the plane of incidence Malaquin et al. (2010); Hemmerle et al. (2012). In all experiments, the incident beam was m m and the reflected intensity was defined using a 20 mmm slit at 210 mm from the sample and a 20 mmm slit at 815 mm from the sample and recorded using a NaI (Tl) scintillator.
Off-specular scattering is sensitive to both static deformation and thermal fluctuations of bilayers. In the limit of small amplitudes, and the simple case of a single bilayer in an interaction potential , the scattered intensity is , with the fluctuation spectrum and
| (3) |
The Hamiltonian of the system is given by . Fitting of the scattering curves, accounting for both thermal fluctuations and the static roughness induced by the substrate Swain and Andelman (2001) (following the procedure described in details in Daillant et al. (2005); Malaquin et al. (2010)), gives access to the bilayer electron density profile, , and . Different scattering curves are presented in Figure 2.B and in Supplemental Material, showing that high voltage differences, up to 10 V can be applied to the cell without destroying the membrane, but strongly affecting its fluctuations. Fig. 3 summarizes the main findings of this paper. We clearly observe an electrostriction effect on structural properties. The thickness of the water layer in between the two lipid bilayers decreases with the electric field (Fig. 3.A). Depending on voltage and frequency, we also observe large negative corrections to the tension (up to 1 mN/m, Fig. 3.C,D) and positive corrections to the bending stiffness (up to a few hundreds of , Fig. 3.E,F). The measured values mN/m and are in good agreement with known values for DSPC bilayer Malaquin et al. (2010).
Analyzing our results first requires to determine the local voltage drop seen by the bilayer. To this end, we model the system electrokinetics by solving the Poisson-Nernst-Planck equations, generalizing the model of Ziebert et al Ziebert and Lacoste (2011) to the double supported bilayer (Fig. 2.A) sup (a). The only unknown parameter is the Debye screening length , which might slightly depend on the dissolved carbon dioxide and fixes the conductivity of the solution Haughey and Earnshaw (1998). Whereas = 960 nm in pure water, it is reduced to 150 nm for normal atmospheric conditions. As scattering curves were recorded 5 to 10 hours after sample preparation, which can influence the Debye length, = 150 nm, 300 nm and 800 nm were used in the analysis. With these values and a single diffusion coefficient m2/s for all ions Haynes (2013), the effective membrane resistance, lower than its intrinsic resistance, ranges from 20 cm2 to 300 cm2. The system behaves as a low-pass filter with a cut-off frequency determined by the bulk solution conductance and the electric double layer capacitance per unit area (inset of Fig. 1.B), the highest resistance and capacitance in the system respectively. Depending on Debye length, Mcm2 and µF/cm2, leading to cutoff frequencies of 0.2 Hz for = 150 nm to 3 Hz for = 800 nm. Accordingly, the voltage drop at the membrane increases from less than at 50 Hz to at 10 Hz, where is the AC field applied to the membrane (Fig. 2.A).
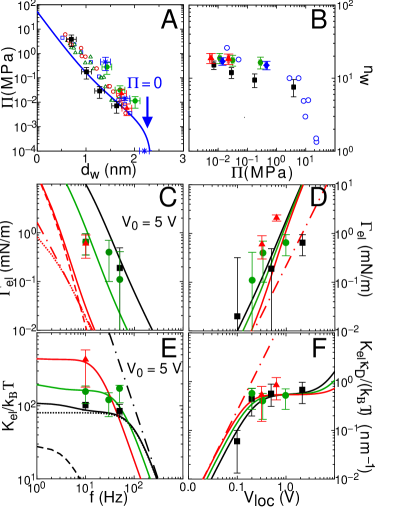
First discussing electrostriction, the most compressible part in the system is the water layer in between the two lipid bilayers and the electromagnetic stress is balanced by the interbilayer potential. By plotting the electrostatic pressure sup (a) as a function of the interbilayer water thickness (Fig. 3.A), all points fall on a master curve obtained for both the natural entropic repulsion between bilayers Hemmerle et al. (2012) and osmotic stress, either applied on floating bilayers Hemmerle et al. (2012) or multilayer stacks Petrache et al. (1998), demonstrating that the local electromagnetic stress is well described by our model. We also report in Fig. 3.B the number of water molecules per lipids Nagle and Wiener (1989) as a function of the pressure . Similar curves obtained when the pressure is osmotically applied on a floating bilayer Hemmerle et al. (2012) and on multilayer stacks Mallikarjunaiah et al. (2011) are also presented, clearly demonstrating that the floating bilayers behave the same way irrespective of how the mechanical stress is applied and keep their integrity under the applied electric field.
The frequency dependence of the correction to the membrane tension is plotted in Fig. 3.C for V, where a decay is observed. The origin of this purely electrokinetic effect lies in the impossibility to charge the membrane above the cutoff frequency of the low bandpass filter formed by the electric double layer capacitor and bulk water resistor due to the finite mobility of ions in water.
By plotting as a function of the local electric field , we observe a good agreement between data and theoretical predictions with exhibiting a roughly dependence (Fig. 3D).
The increase in bending rigidity is plotted as a function of frequency for V in Fig. 3.E and as a function of in Fig. 3.F. Both curves exhibit a more complex behavior than the curves which can be attributed to non-linear effects due to the large voltage drop at the membrane with (Fig. 1.B).
In contrast with the linear theory which exhibits the expected behavior, the low-frequency plateau seen for both experimental data and non-linear theory in Fig. 3.E comes from saturation effects in the electric double layer.
By plotting the data as a function of , which allows one to decouple microscopic and electrokinetic effects, all values indeed fall on a master curve with a saturation from 0.5V (see Fig. 3.F). This is in remarkable agreement with the theory which predicts a saturation value of proportional to the Debye length Ziebert and Lacoste (2011), and fully consistent with the expectation that a thicker layer is more difficult to bend.
As also fixes independently cutoff frequencies via water conductivity, the analysis is clearly consistent.
However, we must point out that despite its remarkable description of our data, the theory of Ref. Ziebert and Lacoste (2010) is for a single bilayer in a symmetric environment, unlike the experimental conditions used here.
The electroformation technique uses similar electric field to destabilize membranes and fabricate Giant Unilamellar Vesicles (GUVs).
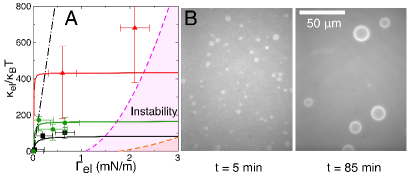
The stability limit of the bilayers can be calculated using ,
and is drawn in Fig. 4.A for two different values of the potential second derivative ( J.m-4 and J.m-4). It clearly shows that our x-rays experiments are performed in the stability domain but close to instability conditions. With the aim of observing destabilization, we have applied an electric field on a single supported bilayer on an ITO coated glass slide under similar conditions.
We observed by fluorescence microscopy the formation of GUVs above and close to the main transition temperature (Fig. 4.B). Small vesicles of diameter 5 µm are the dominant population at short times ( 1-10 min) and grow with time to reach a diameter of 10-30 µm. Interestingly, the initial size we find here is consistent with the instability in the bilayer fluctuation spectra evidenced by x-ray scattering.
The effect of AC fields on supported floating bilayers has been investigated by x-ray off-specular scattering. In a consistent set of experimental data strongly supported by an established theoretical model, we have evidenced both a dramatic decrease in the membrane tension, possibly down to negative values, and a strong increase in the bilayer bending rigidity. We demonstrate that the effect on tension results from an amplification of charge fluctuations at the membrane.The effect on rigidity comes from couplings inside the electric double layer, and can only be understood by using the full non- linear Poisson-Boltzmann theory. The effect of voltage and AC field frequency has been characterized. The competition between the stabilizing effect on bending rigidity (mainly acting at lengthscales ) and destabilizing effect on tension (at lengthscales ) leads to vesicle formation as observed. This detailed understanding can now be used for further analysis of the effect of electric fields on biological membranes. For cell membranes which have a smaller rigidity ( kBT) than our model membrane, destabilization is expected to occur at lengthscales nm and could explain the effect of low electric fields in processes like electroendocytosis.
Acknowledgments
The authors wish to thank L. Malaquin and S. Micha for assistance during the experiments and L. Malaquin, D. Lacoste and F. Ziebert for useful discussions. Supports from the Labex NIE 11-LABX-0058-NIE (Investissement d’Avenir programme ANR-10- IDEX-0002-02) and PSCM facilities at the ILL for sample preparation are gratefully acknowledged.
References
- Angelova and Dimitrov (1986) M. Angelova and D. Dimitrov, Faraday Discuss. Chem. Soc. 81, 303 (1986).
- Riske and Dimova (2005) K. A. Riske and R. Dimova, Biophysical Journal 88, 1143 (2005).
- Dimova et al. (2009) R. Dimova, N. Bezlyepkina, M. Domange Jordo, R. Knorr, K. Riske, M. Staykova, P. Vlahovska, T. Yamamoto, P. Yang, and R. Lipowsky, Soft Matter 5, 3201 (2009).
- Salipante et al. (2015) P. F. Salipante, M. L. Shapiro, and P. M. Vlahovska, Procedia IUTAM 16, 60 (2015).
- Hianik (2000) T. Hianik, Reviews in Molecular Biotechnology 74, 189 (2000).
- Zhao et al. (2006) M. Zhao, B. Song, J. Pu, T. Wada, B. Reid, G. Tai, F. Wang, A. Guo, P. Walczysko, Y. Gu, T. Sasaki, A. Suzuki, J. Forrester, H. Bourne, C. Devreotes, P.N. McCaig, and J. Penninger, Nature 442, 457 (2006).
- Zimmermann (1986) U. Zimmermann, in Reviews of Physiology, Vol. 105 (Springer Berlin Heidelberg, 1986) pp. 175–256.
- Zimmermann and Neil (1996) U. Zimmermann and G. Neil, Electromanipulation of cells (CRC press, 1996).
- Son et al. (2014) R. S. Son, K. C. Smith, T. R. Gowrishankar, P. T. Vernier, and J. C. Weaver, J Membr Biol 247, 1209 (2014).
- Rems et al. (2013) L. Rems, M. Usaj, M. Kanduser, M. Rebersek, D. Miklavcic, and G. Pucihar, Sci Rep 3, 3382 (2013).
- Vernier et al. (2006) P. Vernier, Y. Sun, and M. Gundersen, BMC Cell Biology 7, 37 (2006).
- Vlahovska (2015) P. M. Vlahovska, Soft Matter 11, 7232 (2015).
- Sens and Isambert (2002) P. Sens and H. Isambert, Physical Review Letters 88, 128102 (2002).
- Ziebert et al. (2010) F. Ziebert, M.-Z. Bazant, and D. Lacoste, Physical Review E 81, 031912 (2010).
- Ziebert and Lacoste (2010) F. Ziebert and D. Lacoste, New Journal of Physics 12, 095002 (2010).
- Ziebert and Lacoste (2011) F. Ziebert and D. Lacoste, Advances in planar lipid bilayers and liposomes, vol. 14 , 63 (2011).
- Ambjörnsson et al. (2007) T. Ambjörnsson, M. A. Lomholt, and P. L. Hansen, Phys. Rev. E 75, 051916 (2007).
- Loubet et al. (2013) B. Loubet, P. L. Hansen, and M. A. Lomholt, Phys. Rev. E 88, 062715 (2013).
- sup (a) see Supplemental Material at [] for more details on modeling.
- Picas et al. (2012) L. Picas, F. Rico, and S. Scheuring, Biophysical Journal 102, L01 (2012).
- Fadda et al. (2013) G. Fadda, D. Lairez, Z. Guennouni, and A. Koutsioubas, Physical Review Letters 111, 028102 (2013).
- Charitat et al. (1999) T. Charitat, E. Bellet-Amalric, G. Fragneto, and F. Graner, European Physical Journal B 8, 583 (1999).
- Daillant et al. (2005) J. Daillant, E. Bellet-Amalric, A. Braslau, T. Charitat, G. Fragneto, F. Graner, S. Mora, F. Rieutord, and B. Stidder, The Procedings of the National Academy of Sciences USA 102, 11639 (2005).
- Hemmerle et al. (2012) A. Hemmerle, L. Malaquin, T. Charitat, S. Lecuyer, G. Fragneto, and J. Daillant, The Proceedings of the National Academy of Sciences 109, 19938 (2012).
- sup (b) see Supplemental Material at [] for more details on experimental methods.
- Malaquin et al. (2010) L. Malaquin, T. Charitat, and J. Daillant, Eur. Phys. J. E 31, 285 (2010).
- Swain and Andelman (2001) P. S. Swain and D. Andelman, Physical Review E 63, 51911 (2001).
- Haughey and Earnshaw (1998) D. Haughey and J. C. Earnshaw, Colloids and Surfaces A: Physicochemical and Engineering Aspects 136, 217 (1998).
- Haynes (2013) W. M. Haynes, CRC handbook of chemistry and physics (CRC press, 2013).
- Petrache et al. (1998) H. I. Petrache, N. Gouliaev, S. Tristram-Nagle, S. Zhang, R. M. Suter, and J. F. Nagle, Physical Review E 57, 7014 (1998).
- Mallikarjunaiah et al. (2011) K. Mallikarjunaiah, A. Leftin, J. J. Kinnun, M. J. Justice, A. L. Rogozea, H. I. Petrache, and M. F. Brown, Biophysical journal 100, 98 (2011).
- Nagle and Wiener (1989) J. Nagle and M. Wiener, Mol. Cryst. Liq. Cryst. 144, 235 (1989).