A Model for Direction Sensing in Dictyostelium Discoideum:
Ras Activity and Symmetry Breaking Driven by a Gβγ- Mediated,
Gα2-Ric8 – Dependent Signal Transduction Network
Yougan Cheng1,\Yinyang, Hans Othmer1,*\Yinyang
1 School of Mathematics, University of Minnesota, Minneapolis, MN, USA
These authors contributed equally to this work.
* othmer@umn.edu
Abstract
Chemotaxis is a dynamic cellular process, comprised of direction sensing, polarization and locomotion, that leads to the directed movement of eukaryotic cells along extracellular gradients. As a primary step in the response of an individual cell to a spatial stimulus, direction sensing has attracted numerous theoretical treatments aimed at explaining experimental observations in a variety of cell types. Here we propose a new model of direction sensing based on experiments using the free soil-living amoeba Dictyostelium discoideum (Dicty). The model is built around a reaction-diffusion-translocation system that involves three main component processes: a signal detection step based on G-protein-coupled receptors (GPCR) for cyclic AMP (cAMP), a transduction step based on a heterotrimetic G protein G (G2), and an activation step of a monomeric G-protein Ras. The model can predict the experimentally-observed response of cells treated with latrunculinA, which removes feedback from downstream processes, under a variety of stimulus protocols. We show that G2 cycling modulated by Ric8, a nonreceptor guanine exchange factor for in Dicty, drives multiple phases of Ras activation and leads to direction sensing and signal amplification in cAMP gradients. The model predicts that both G and Gβγ are essential for direction sensing, in that membrane-localized G, the activated GTP-bearing form of G, leads to asymmetrical recruitment of RasGEF and Ric8, while globally-diffusing Gβγ mediates their activation. We show that the predicted response at the level of Ras activation encodes sufficient ’memory’ to eliminate the ’back-of-the wave’ problem, and the effects of diffusion and cell shape on direction sensing are also investigated. In contrast with existing LEGI models of chemotaxis, the results do not require a disparity between the diffusion coefficients of the Ras activator GEF and the Ras inhibitor GAP. Since the signal pathways we study are highly conserved between Dicty and mammalian leukocytes, the model can serve as a generic one for direction sensing.
Author Summary
Many eukaryotic cells, including Dictyostelium discoideum (Dicty), neutrophils and other cells of the immune system, can detect and reliably orient themselves in chemoattractant gradients. In Dicty, signal detection and transduction involves a G-protein-coupled receptor (GPCR) through which extracellular cAMP signals are transduced into Ras activation via an intermediate heterotrimeric G-protein (G2). Ras activation is the first polarized response to cAMP gradients in Dicty. Recent work has revealed mutiple new characteristics of Ras activation in Dicty, thereby providing new insights into direction sensing mechanisms and pointing to the need for new models of chemotaxis. Here we propose a novel reaction-diffusion model of Ras activation based on three major components: one involving the GPCR, one centered on G2, and one involving the monomeric G protein Ras. In contrast to existing local excitation, global inhibition (LEGI) models of direction sensing, in which a fast-responding but slowly-diffusing activator and a slow-acting rapidly diffusing inhibitor set up an internal gradient of activity, our model is based on equal diffusion coefficients for all cytosolic species, and the unbalanced local sequestration of some species leads to gradient sensing and amplification. We show that Ric8-modulated G2 cycling between the cytosol and membrane can account for many of the observed responses in Dicty. including imperfect adaptation, multiple phases of Ras activity in a cAMP gradient, rectified directional sensing, and cellular memory.
Introduction
Many eukaryotic cells can detect both the magnitude and direction of extracellular signals using receptors embedded in the cell membrane. When the signal is spatially nonuniform they may respond by directed migration either up or down the gradient of the signal, a process called taxis. When the extracellular signal is an adhesion factor attached to the substrate or extracellular matrix, the response is haptotaxis [1], and when it is a diffusible molecule the process is called chemotaxis. Chemotaxis plays important and diverse roles in different organisms, including mediation of cell-cell communication [2], in organizing and re-organizing tissue during development and wound healing [3, 4, 5], in trafficking in the immune system [6], and in cancer metastasis [7].
Chemotaxis can be conceptually divided into three interdependent processes: direction sensing, polarization, and locomotion [8, 9]. In the absence of an external stimulus, cells can extend random pseudopodia and ’diffuse’ locally, which is referred as random motility [10]. Direction sensing refers to the molecular mechanism that detects the gradient and generates an internal amplified response, providing an internal compass for the cell [11]. Polarization involves the establishment of an asymmetric shape with a well-defined anterior and posterior, a semi-stable state that allows a cell to move in the same direction without an external stimulus. These three processes are linked through interconnected networks that govern (i) receptor-mediated transduction of an extracellular signal into a primary intracellular signal, (ii) translation of the primary signal into pathway-specific signals for one or more signalling pathways, and (iii) the actin cytoskeleton and auxiliary proteins that determine polarity of the cell. A single extracellular signal may activate numerous pathways, but our focus herein is on the first pathway, which involves transduction of an extracellular cAMP signal via a GPCR, and one specific pathway of the second type, the Ras pathway, which is involved in activating the appropriate downstream networks that govern chemotactic locomotion.
Dicty is an amoeboid eukaryotic cell that utilizes chemotaxis during various stages of its life cycle. In the vegetative phase, it locates a food source by migrating toward folic acid secreted by bacteria or yeast. When the food supply is depleted Dicty undergoes a transformation from the vegetative to the aggregation phase, in which cells sense and migrate toward locally-secreted 3’-5’ cyclic adenosine monophosphate (cAMP), which serves as a messenger for control of chemotaxis and other processes [12, 9]. Dicty has served as an excellent model for studying the interconnected signalling pathways governing chemotaxis due to its genetic and biochemical tractability [13, 14, 15]. The major components of the network topology for chemotaxis have been identified by analyzing the effects of gene knockouts and the response of cells to various spatio-temporal signalling protocols [16, 17, 8].
The first step of the chemotactic process involves signal transduction by GPCR’s, which activates G-protein and is described in detail in the following section. The activated G-protein can in turn activate numerous pathways, and the pathway we analyze here involves Ras, which is a monomeric G protein that functions as a molecular switch that activates downstream effectors such as PI3K in its activated GTP-bound state. Activation of Ras is the earliest measurable polarized signalling event downstream of G protein activation[14, 18]. A major question from both the experimental and the theoretical viewpoints is how the cell transduces a shallow spatial gradient of extracellular cAMP into a steeper internal gradient of activated Ras. Recent experiments show that Ras activity exhibits multiple temporal phases in cAMP gradients [19]. The first phase is transient activation of Ras that is essentially uniform over the entire cell boundary. In the second phase, symmetry is broken and Ras is reactivated exclusively at the up-gradient side of the cell. The third phase is confinement, in which the crescent of activated Ras localizes further to the region exposed to the highest cAMP. Other recent observations that are not incorporated in existing models are as follows. Firstly, the Ras symmetry breaking does not depend on the presence of the actin cytoskeleton – treatment of cells with latrunculin A (LatA), which leads to depolymerization of the network – does not destroy the symmetry-breaking [19]. Secondly, it was found that when two brief stimuli are applied to the same cell, the response to the second stimulus depends on the interval between the stimuli, which indicates that there is a refractory period [20]. Other experiments show that the adaptation of Ras activation is slightly imperfect, and Ras activity is suppressed when the chemoattractant concentration is decreasing in time, a phenomenon called rectification[21]. Finally, it was reported that there is a persistent memory of Ras activation, even when the cells are treated with LatA [22].
These new results are difficult to interpret in the framework of existing models, a number of which have been proposed [23, 24, 11, 25, 26, 27, 28, 22, 20]. Most of these models are based on an activator and inhibitor mechanism called LEGI – local excitation, global inhibition – to explain both direction sensing and adaptation when the chemoattractant level is held constant [29]. While these models shed some light on direction sensing, their usefulness is limited due to the oversimplification of the signal transduction network – as will be elaborated later. In particular, none of the existing models incorporates sufficient mechanistic detail to satisfactorily explain the spectrum of observations described above, which provides the rationale for a more comprehensive model that enables us to test hypotheses and make predictions concerning the expected behavior of the signal transduction pathways.
The key components in the model we develop herein are the G-protein G2, RasGEF and RasGAP, which control rapid excitation and slower adaptation of Ras, and Ric8, a guanine nucleotide exchange factor that activates the -component of G2 [30]. The model is developed for LatA-treated cells so as to remove the feedback effect from the actin cytoskeleton on Ras, and we show that it can replicate many of the observed characteristics of Ras activation in Dicty. It is known that activated Ras activates PI3K, which stimulates further downstream steps that affect actin polymerization, but we can restrict attention to the Ras dynamics and its upstream effectors because there is no known direct feedback to Ras from downstream steps between Ras and the actin cytoskeleton. We show that mediates adaptation of Ras activity in a uniform stimulus and transient activation in a gradient. It is also shown that contributes to the imperfect adaptation in a uniform stimulus, and that it is an essential element for front-to-back symmetry breaking in a gradient, highlighting the important roles of and G2 cycling between the bound and dissociated states. We also show that Ric8 contributes to the amplification of Ras activity by regulating dynamics: the reactivation of Gα2 by Ric8 induces further asymmetry in G2 dissociation, which in turn amplifies the Ras activity. Finally, we investigated the effects of diffusion and cell shapes on direction sensing, and the potential role of Ric8 in the establishment of persistent Ras activation, which is a form of cellular memory.
Signal transduction pathways
In light of the restriction to LatA-treated cells, the backbone of the chemotactic pathway activated in response to changes in extracellular cAMP is cAMP GPCR occupation Gαβγ activation Ras activity. We describe this pathway in terms of three modules: the GPCR surface receptors cAR1-4, G2 and Ras, as illustrated in Figure 1.


The GPCR surface receptor
The first step in Dicty chemotaxis is binding of cAMP to the G-protein coupled receptors (GPCRs) cAR1-4. A cAMP-bound GPCR serves as a GEF that catalyses the exchange of GDP for GTP on the Gα subunit of G2, and leads to the activated G subunit and the Gβγ subunit following dissociation. Experimental results suggest that 30% of the G protein heterotrimers exist in the cytosol. 111 It is well established in mammalian cells that ligand-induced phosphorylation of GPCRs leads to recruitment of arrestin family proteins, which uncouple receptors from downstream G proteins [31, 32]. cAR1 is phosphorylated at multiple cytoplasmic residues upon chemoattractant stimulation [33, 34], which is correlated to agonist-induced loss of ligand binding [35]. The functional consequence of receptor phosphorylation for chemotaxis has not been fully addressed, but it is known that receptor phosphorylation is not essential for chemotaxis or termination of G-protein-mediated responses [36], and since there is no evidence that receptor phosphorylation affects Ras we do not include it. The four receptor types, which have different affinities, are expressed sequentially throughout the developmental transition from a unicellular to a multicellular organism. Switching of receptor subtypes enable Dicty to response to changing chemoattractant concentrations in a wide range and hence program morphogenesis appropriately [37, 38, 39], but n the model we treat only one type. Lateral diffusion of the receptors has been suggested by the observation of green fluorescent protein (GFP)-tagged receptors in Dicty. The diffusion coefficient measured from the movements of individual receptors is about 2.7 [40], which is small at the scale of the cell size, but could be locally significant on the scale of structures such as filipodia.
The G protein module
The heterotrimeric G proteins function as transducers of extracellular cAMP signals for gradient sensing, since studies show that localized responses such as Ras activation occur upstream of PI3-kinase activity and downstream of G protein activity [18]. There are 11 Gα subunits and a single Gβ and Gγ subunit in Dicty [41]. This single Gβγ subunit is essential for chemotactic signal transduction since cells do not show any Ras activation [19] and do not chemotact [14]. The primary subunit in chemotaxis is G, since cells lack an essential component of the response to cAMP, as described later [19, 30].
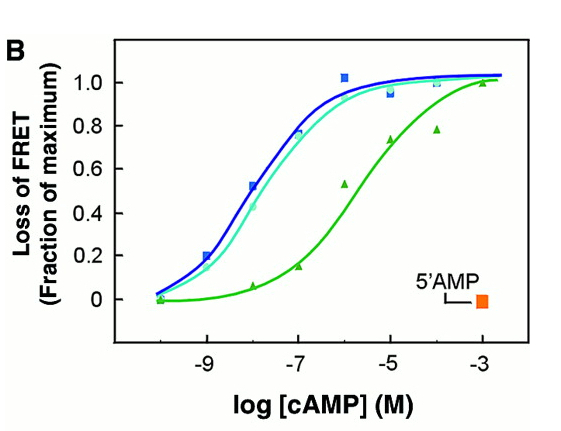
Ligand binding to the GPCR catalyzes the exchange of GTP for GDP on the Gα subunit, causing the dissociation of activated G subunits and Gβγ subunits. Hydrolysis of GTP in G induces reassociation, which reduces active G-protein subunits when the chemoattractant is removed [29, 8]. By monitoring fluorescence resonance energy transfer (FRET) between and subunits, the membrane dynamics of the heterotrimer prior to and after simulation in Dicty has been visualized [42, 43], and it has been shown that G protein activation reaches a persistent dose-dependent steady state level during continuous stimulation, i.e., no adaptation occurs at this level [42, 24].
These and other studies show that G2 and Gβγ subunits cycle between the cytosol and the plasma membrane, while the activated Gα probably remains membrane-bound [44, 17]. Moreover, although asymmetric distributions of Gβγ subunits are observed in highly polarized Dicty, in LatA-treated cells is uniformly distributed along the plasma membrane and within the cytosol in the presence of a cAMP gradient [45], which further suggests that Gβγ is also cycling between the membrane and the cytosol. Finally, it is reported that Dicty ’resistant to inhibitors of cholinesterase 8’ (Ric8) is a nonreceptor GEF for , which converts GDP into the activated GTP form [30]. The regulation of Ric8 activity is currently not clear, but its role as a GEF probably involves binding of to Ric8 [30].
Ras GTPases
Ras belongs to the family of small G proteins that function as molecular switches to control a wide variety of important cellular functions. In Dicty, there are 5 characterized isoforms: RasS, RasD, RasB, RasC, and RasG encoded by 14 Ras family genes [8]. RasC and RasG proteins appear to be particularly important for chemotaxis, of which RasG is the key Ras protein in the regulation of cAMP-mediated chemotaxis [19].
In the chemotactic backbone the Ras module provides a link between G proteins and downstream pathways. Ras proteins exist in an inactive GDP-bound state and an active GTP-bound state, and conversion between these is regulated by RasGEFs and GTPase activating proteins (RasGAPs). RasGEFs catalyze the exchange of GDP for GTP, thereby activating Ras, whereas RasGAPs stimulate the GTPase activity, converting the protein into the inactive GDP-bound form. Regulation by GEF and GAP conversion of Ras includes protein-protein or protein-lipid interactions, binding of second messengers, and post-translational modifications that induce one or more of the following changes: translocation to a specific compartment of the cell, release from autoinhibition, and the induction of allosteric changes in the catalytic domain [46]. Several methods have been developed to detect Ras protein and small GTPases activation [47], while the dynamics of Ras are usually monitored by the translocation of a tagged Ras-binding domain (RBD) peptide. The RBD of Raf1 only binds to the activated Ras-GTP, which enables localized visualization of Ras activity. The response of activated Ras in Dicty shows near-perfect adaptation, although some deviation from perfect adaptation can be observed [21].
The full set of reactions and translocation steps are given in Table LABEL:rxntab, wherein reactions and translocations are labeled as and , respectively, and the corresponding rate laws, which are derived by assuming mass-action kinetics for all steps, are denoted by and , respectively. In reality the translocation of a substance between the cytosol and the membrane takes place within a layer near the membrane, but we treat this as a surface reaction. Moreover, we assume that complex formation is always fast and that a negligible amount of the factors is in the complex form, so that the conversion rate of the substrate is proportional to the product of regulator and substrate densities, unless otherwise indicated. To eliminate the effects of intrinsic polarity and investigate the system dynamics without feedback from the cytoskeleton, we assume that the cells are pretreated with LatA, in which case they lose polarity and become rounded and immobile.
The applicable conservation conditions on the various species are implicit in the evolution equations, which are given in detail in the Materials and Methods section. For simplicity, we model a cell as a 3D sphere centered at the origin, of radius [45]. The initial condition for the system is the steady state in a very small concentration () of cAMP in the extracellular space. The system is solved numerically by a finite element discretion in space and backward differentiation for the time stepping, implemented in the COMSOL multiphysics package. In the following sections, we exhibit the cell response under various stimulation protocols, and for notational simplicity, we use in place of . Some of the results that will be discussed are as follows.
-
•
Under uniform stimuli –
-
–
The transient response
-
–
Imperfect adaptation
-
–
The response of and cells.
-
–
-
•
Under graded stumuli –
-
–
The origin of the biphasic Ras activation and the necessity of ’activator’ diffusion
-
–
How the magnitude of gradient amplification depends on the cAMP amplitude and gradient
-
–
The response of and cells in a gradient.
-
–
The ’back-of-the-wave’ problem.
-
–
| Label and Description | Kineti | Rate | Reference |
| ligand binding | , | [40, 42] 000The affinity values of four receptors in Dicty have been measured in various conditions [38] and receptors have the ability of switching their affinity between high affinity and low affinity [39]. To avoid modeling all four receptors, we model the binding with an averaged binding affinity and dissociation rate. | |
| G2 cycling | [44, 17] | ||
| G2 dissociation | [29, 8] | ||
| Gβγ cycling | [44, 17] 000Following the dissociation, the free Gβγ could diffuse away from the membrane and enter the cytosol. | ||
| GTPase of G | [29, 8] 000The intrinsic guanosine triphosphatase (GTPase) activity of the activated hydrolyses the bound GTP on the plasma membrane, whose rate can be varying depending on the influence of regulator of G protein signalling (RGS) proteins [48, 49] | ||
| Ric8 cycling | [30] 000The regulation of Ric8 activity is still not clear. We assume a translocation-activation mechanism here. The possibility of translocation-only mechanism is investigated. | ||
| Promoted Ric8 cycling | Assumed 000We assume that Ric8 translocation can be promoted by G. The scenarios of Gα promotion and no promotion (g-null) are also investigated. | ||
| Ric8 activation | Assumed 000We assume Ric8 is activated by Gβγ,m. The scenario of translocation-only is investigated, in which case converts Gα directly into G. The simulations suggest that this activation is not essential to induce symmetry breaking. | ||
| Gα reactivation | [30] | ||
| Ric8 inactivation | Assumed 000An inactivation is introduced to balance the Ric8 activation step. In the translocation-only scenario, this step is eliminated. | ||
| G2 reassociation | [29, 8] | ||
| RasGEF cycling | [50] | ||
| Promoted RasGEF cycling | [51, 52, 53, 54] | ||
| RasGAP cycling | [46] | ||
| RasGEF activation | [27, 19] | ||
| RasGEF inactivation | [27, 19] | ||
| RasGAP activation | [27, 19] | ||
| RasGAP inactivation | [27, 19] | ||
| Ras activation | [27, 19] | ||
| Ras inactivation | [27, 19] | ||
| Spontaneous Ras activation | [27, 19] | ||
| Spontaneous Ras inactivation | [27, 19] | ||
| RBD cycling | [27, 19] | ||
| Promoted RBD cycling | [27, 19] |
Results
The response under a uniform stimulus
dynamics
999Hereafter we use for where possible to simplify the notation.As previously noted, G2 dissociates rapidly upon addition of chemoattractant and G and reach a dose-dependent steady-state level during continuous stimulation, even though downstream responses subside [42]. The computed dose-dependent time evolutions of G2 and are shown in the first row of Fig. 2. Under a spatially-uniform stimulus the concentration of G2 decreases due to dissociation induced by cAMP-bound cAR, the concentration of subunits increases, and the steady state level of each is dose-dependent. The time to reach a steady state level decreases as the cAMP increases, and at cAMP the dissociation is stabilized within 5 seconds of activation, which is consistent with results in [42].
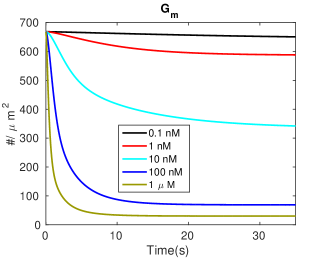
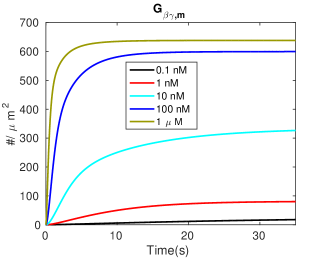
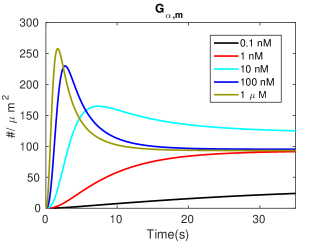
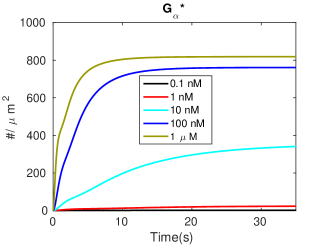
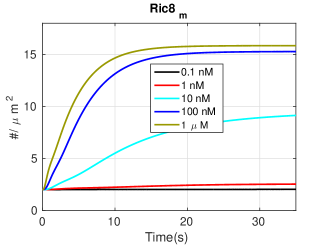
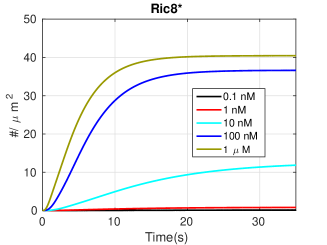
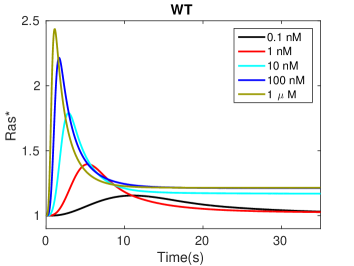
The dynamics of the subunits are shown in the second row of Fig. 2. As shown in the right panel, is activated in a dose-dependent persistent manner similar to , but reaches steady state more slowly than and the steady state concentration is higher at a given cAMP stimulus, because both forms of remain membrane-bound. Surprisingly, the simulation shows that exhibits a biphasic response when the cAMP concentration is above a certain threshold. When the cAMP concentration is lower than 1 nM the concentration increases to the steady state monotonically, but if the cAMP concentration is greater than 10 nM the concentration shows an initial overshoot and then decreases to the steady state, which illustrates the kinetic diversity of G protein signalling [55]. Furthermore, unlike the response of and , for which a higher concentration of cAMP produces a higher steady state levels of subunits, for there is an optimal cAMP concentration at which the steady state level of is maximized.
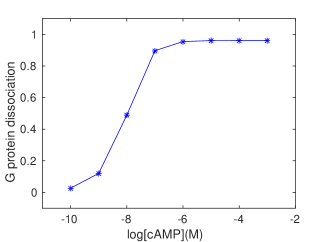
In light of our assumption that Ric8 is localized on the membrane by and activated by , it follows that the model predicts that Ric8 activation is also nonadaptative, as demonstrated in the third row of Fig. 2. In the fourth row of Fig. 2 we show the comparison of dose-dependent G2 dissociation between the observations in [42] and our model prediction. One sees that the predictions matches the experimental data and both show that dissociation of G2 is saturated at 1 cAMP.
Imperfect adaptation at the level of Ras
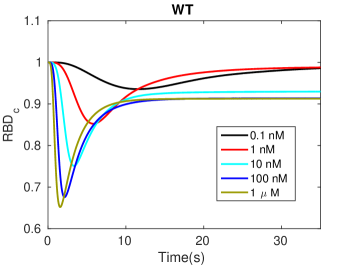
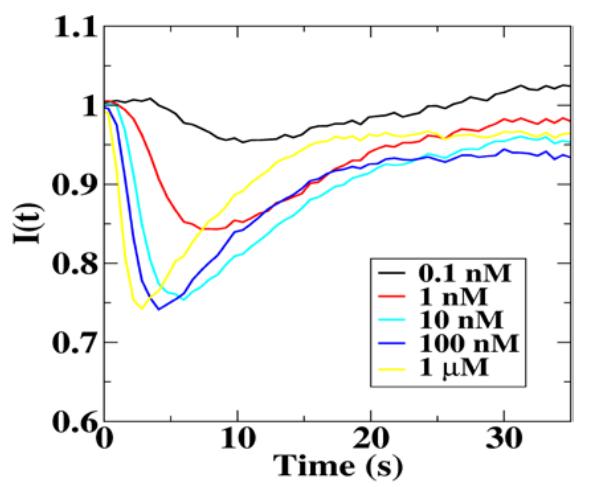
It is suggested in [27] that adaptation of Ras activity is due to incoherent feedforward control via activation and inactivation of Ras by RasGEF and RasGAP, resp. Ras activation is monitored via membrane localization of RBD, which diffuses freely in the cytosol and is localized at the membrane by binding to active Ras. The comparison between the experimental results for LatA-treated cells and the model predictions are shown in the top row of Fig. 3. One sees that the model captures several basic aspects seen in the observed Ras activation.
-
•
After an increase in cAMP, RBD rapidly translocates to the membrane and binds to – whose dynamics are shown in bottom left of Fig. 3 – reaching a maximum in a few seconds. This is followed by a more gradual return to the cytosol, where RBD returns to approximately its basal level.
-
•
The maximum response increases with increasing concentrations and saturates at about 1 cAMP.
-
•
The time to the peak of the response decreases with increasing cAMP concentration.
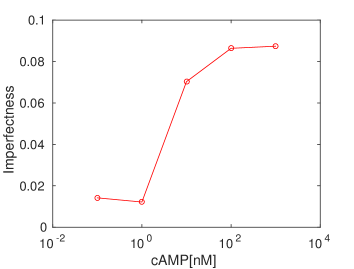
While perfect adaptation has been confirmed in bacterial gradient sensing [56], the experimental evidence in eukaryotes is mixed and sometimes suggests that only partial adaptation takes place[57, 58, 59]. Although it was claimed that the adaptation is near-perfect in Dicty [27], the experimental results in the top right panel of Fig. 3 show that it is not. Imperfect activation is also reported in [21], and the degree of imperfection is quantified at various cAMP stimulus levels there. The model also predicts imperfect adaptation, as shown in the top left panel of Fig. 3, and the deviation from perfect adaptation is shown in the bottom right panel of that figure. Both the simulations and experimental measurements show that the deviation from perfect adaptation increases with the level of stimulation and saturates at about 100 nM, and in both cases the relative deviation from perfect adaptation does not exceed 0.1.
It is suggested in [27] that the local activator and global inhibitor of a LEGI model are RasGEF and RasGAP, respectively, and that only RasGAP diffuses in the cytosol. Our model differs from this at the level of Ras activation by incorporating a diffusion-translocation-activation mechanism for both RasGEF and RasGAP. In other words, RasGEF and RasGAP are both globally supplied through diffusion – with the same diffusion coefficients – while only localization of RasGEF is increased by the locally constrained , resulting in stronger persistent RasGEF activation. Consequently, RasGAP activation cannot offset this, even under spatially-uniform stimuli, thereby inducing imperfect adaptation (see Supporting Information for a theoretical analysis).
Refractoriness induced by subtle temporal regulation of RasGEF and RasGAP activation
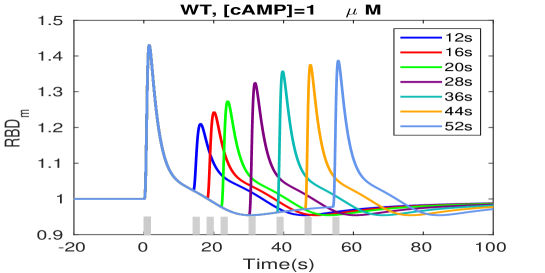
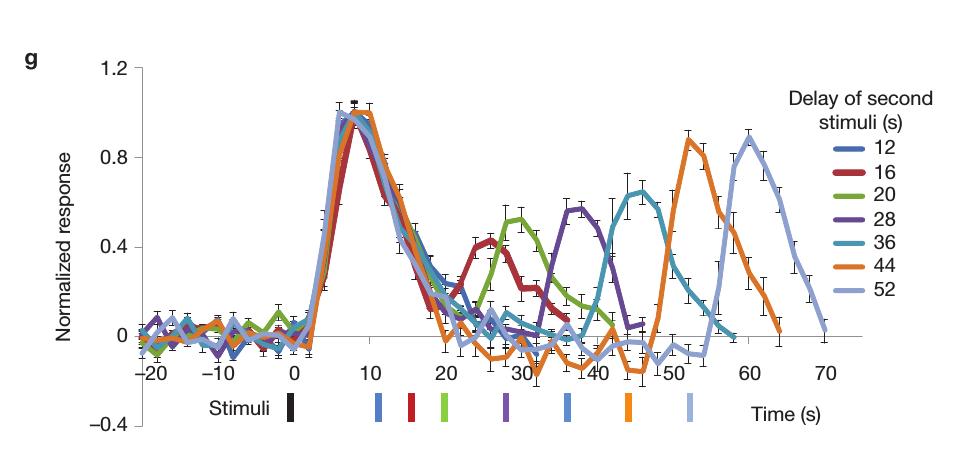
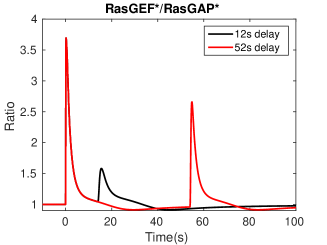
Refractoriness, which is a characteristic of excitable systems, has been reported for Dicty in [20]. When two brief large stimuli are applied to the same cell, the response to the second stimulus depends on the interval between it and the first, as shown in Figure 4 (right), which suggests the existence of a refractory period. We repeated this experiment computationally by applying 1 cAMP stimuli for 2 sec 101010The model exhibits a maximal response to this short saturating stimuli, see Supporting Information separated by increasing intervals. As shown in Figure 4, refractoriness is observed and the decrease in the second response decreases as the separation time increases, consistent with the experimental observations. Moreover, the peak response with a 52 delay is still weaker than the first response, both in simulation and experimental measurements, probably due to the fact that Ras does not adapt perfectly.
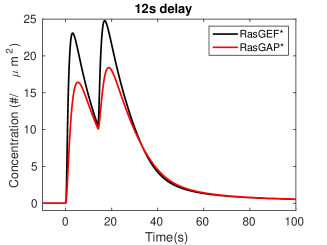
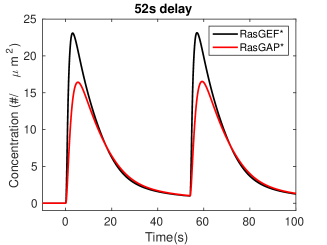
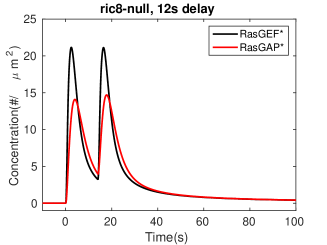
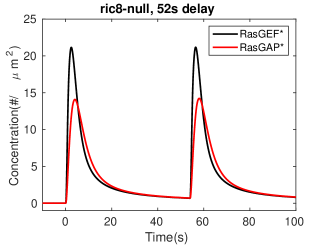
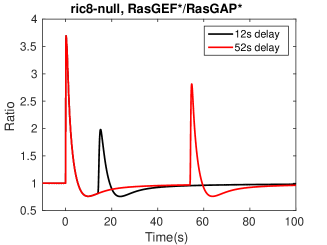
As to the refractory period, note that under large stimuli large fractions of RasGEF and RasGAP are activated, and when the duration between the stimuli is too short, neither RasGEF nor RasGAP can return to prestimulus levels, as shown by comparison of the left and center panels of Fig. 5. As a result, the peak ratio of activated RasGEF and RasGAP decreases for short inter-stimulus intervals as compared with long intervals, as shown in the right panel of Fig. 5. Note that the ratio for a 12 sec interval in Fig. 5 differs from the corresponding RBD ratio in Fig. 4 because there is a basal, unstimulated translocation of RBD to the membrane.111111The refractory periods for non-saturating cAMP stimuli are reported in Supporting Information.
-null and ric8-null cells
To investigate the role of G and Ric8, we simulated -null cells and ric8-null cells by blocking the - and Ric8-related pathways, respectively121212In wild type cells, most of the Gβγ comes from , but Gβγ can also be released from other G proteins [19]. To simulate the responses in -null cells, we assume for simplicity that Gβγ is released from and that the total amount of is the same as in WT cells. Moreover, we assume that the dynamics of are the same as for , but that the released G subunits do not promote RasGEF and Ric8 localization. More precisely, we assume that when cAMP binds to the receptor, dissociates at the same rate as in WT cells, and that Ric8 regulates G hydrolysis through spontaneous membrane localization and Gβγ-mediated activation. G and G only affect G protein cycling and no other components in the network.. As shown in the first row of Fig. 6, G2 dissociation decreases in both -null cell and ric8-null cells. Note that since Ric8 translocation is not enhanced in -null cells, is reactivated at a lower rate in wild type cells. Consequently, cycling dynamics is altered and dissociation decreases. Similarly, -null cells also show decreased G2 dissociation because there is no Ric8 binding to .
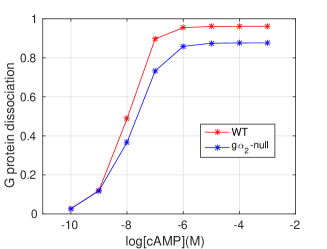
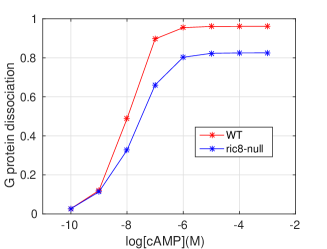
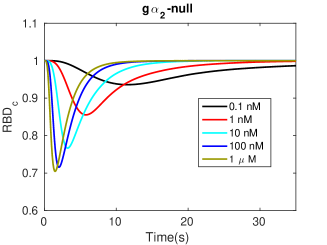
The RBD responses are shown in the second row of Fig. 6. Adaptation is perfect for any physiologically-reasonable cAMP stimulus in -null cells, and the rate of Ras activation is initially the same as in WT cells, but the RBD response is less pronounced (cf. Fig. 3). RasGEF activation is weaker in -null cells due to the absence of G-promoted RasGEF recruitment, and the incoherent feedforward circuit in the model guarantees that the activation of RasGEF and RasGAP are perfectly balanced. Hence perfect adaptation occurs and the maximum response is reduced compared to that in WT cells, which agrees with the results in [30]. For ric8-null cells, one sees that -null cells still exhibit imperfect adaptation, since -promoted RasGEF translocation still occurs, but the imperfectness is reduced due to the fact that there is no Ric8 available to reactivate . Simulations show that -null cells with a reduced -GTP hydrolysis rate approximately resemble the WT behaviors (not shown).
The bottom row shows that the refractory response is still observable in both mutant cells, but the dependence on the time interval is less sensitive compared with WT cells. For -null cells, the change in the RBD response is less than 10% (from 1.11 to 1.2) when the interval ranges from 12 to 52 seconds, compared with a 20% change (from 1.2 to 1.4) in WT cells (Fig. 4). There is less than a 10% difference in maximum response between a 12s interval and a 52s interval ( right panel, from 1.3 to 1.38) for ric8-null cells.
The response under a graded stimulus
Next we investigate how cells respond to a linear cAMP gradient along the x-axis, which we define as follows.
where is the cAMP concentration on the membrane at (a sphere of radius 5), , and subscripts and denote the points (5,0,0) (the ’front’) and (-5,0,0) (the ’rear’).
Biphasic Ras activation in LatA-treated cells
It was shown in [19] that spatially-localized stimuli lead to three phases of Ras activation. In the first, which is transient, Ras is activated on the entire membrane, and this phase requires and exists in -null cells. The second phase is symmetry breaking, in that Ras is only activated at the side of the cell facing the higher cAMP concentration, and this phase requires . The third phase is confinement, wherein the crescent of activated Ras at the front half of the cell localizes to a small area around the high point of the gradient. The first two phases are observed in LatA-treated cells, but the third phase requires actin polymerization. Since the model is based on LatA- pretreated cells, we only test whether it exhibits the first two phases of Ras activation.
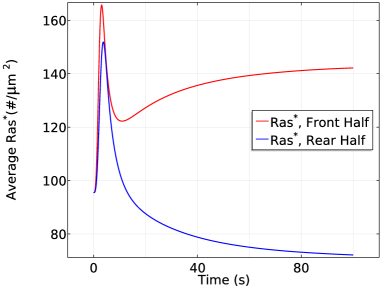
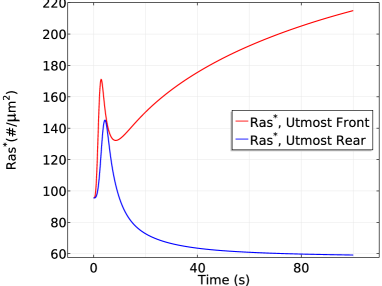
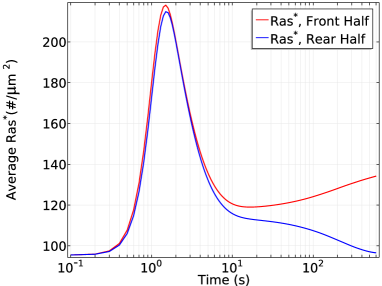
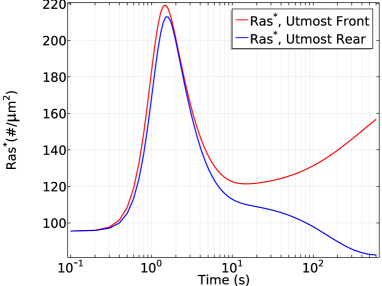
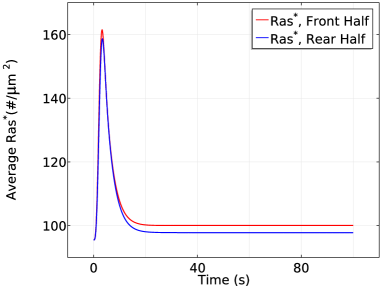
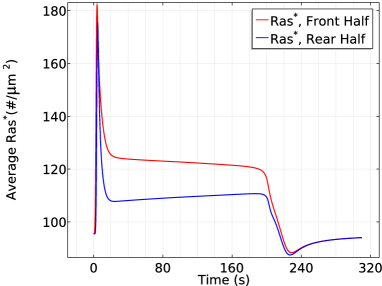
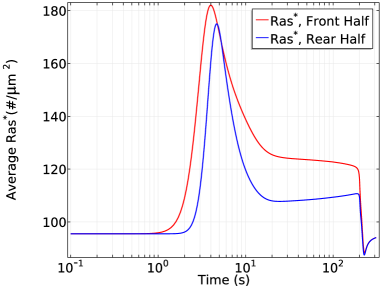
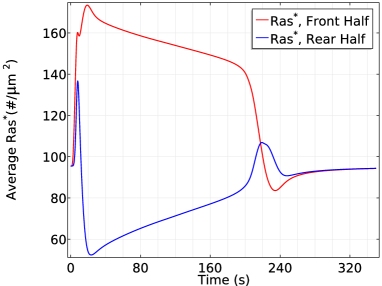
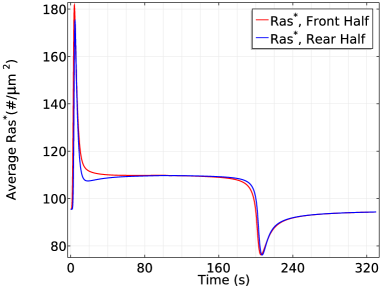
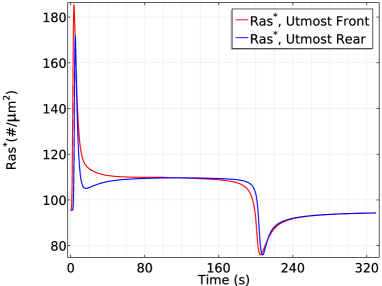
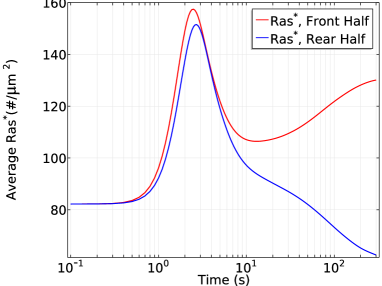
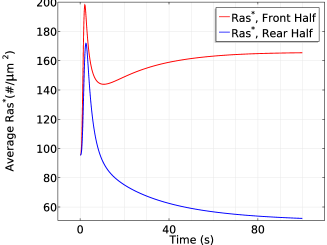
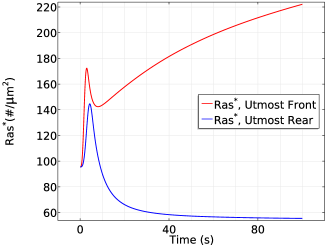
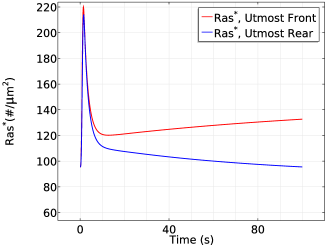
Fig. 7 (left) shows that the initial response is transient activation of Ras on the entire boundary, which is completed in s, followed by a pronounced asymmetric activation pattern131313Here and hereafter we display the average of various species at the front and rear halves of a cell because this is how experimental results are reported.. In the second phase Ras is reactivated exclusively at the front half of the cell, where the peak Ras∗ activation is roughly twice that at the rear, which reflects the difference in receptor occupancy and G protein activation. Thus symmetry breaking occurs in this phase, which is stabilized at around s. The biphasic behavior in a cAMP gradient is even more pronounced in a time plot of at the antipodal points of the gradient, as shown in the right panel of Fig. 7.
The critical components that give rise to the biphasic response are several globally diffusing molecules (, , , and ) and localized G. The sequence of events following application of the graded stimulus is as follows.
-
(i)
G2 dissociation is higher at the front, resulting in more Gβγ there initially (Fig. 8 (left)), but can diffuse in the cytosol, which reduces the spatial difference. A similar difference applies to , but it remains membrane-bound.
-
(ii)
Gβγ activates RasGEF faster than RasGAP everywhere (Fig. 8 (right) for ) which favors the activation of Ras. Because the dissociation of Gαβγ is higher at the front increases faster there and induces a higher maximum.
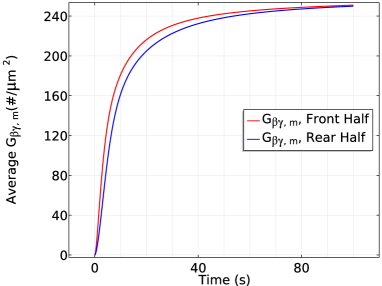
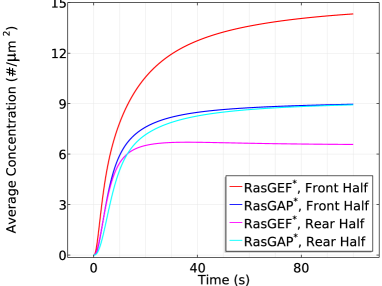
Figure 8: Left: The time course of membrane at the front and rear halves of the cell in the cAMP gradient used in Fig. 7. Right: The time cource of and activity in the same cAMP gradient at the front half and rear half. -
(iii)
activation increases on a slower time scale, resulting in a decrease of everywhere. However, the localization of at the membrane enhances translocation of RasGEF from the cytosol to the membrane, and this is higher at the front than at the rear (Fig. 9 (left)). This leads to higher RasGEF activation at the front (Fig. 8 (right)), which offsets the Ras deactivation due to , and reactivation of Ras occurs.
-
(iv)
At the same time, the nonuniform distribution of on the membrane induces a nonuniform localization of Ric8. Although diffusion of tends to equalize Ric8 activation, this is offset by the difference in the distribution of (Fig. 9 (right)). Consequently, is reactivated at the front of the cell, which further promotes RasGEF localization at the front. Moreover, the asymmetrical reactivation generates an asymmetrical G2 reassociation profile – less reassociation at the front and more at the rear. As a result, diffusion of that re-associated at the rear provides a source of needed at the front, which further contributes to symmetry breaking.
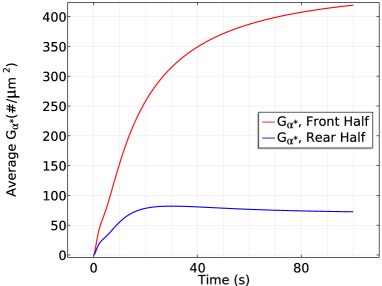
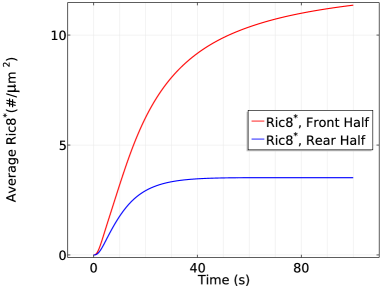
Figure 9: Left: The time course of membrane at the front half and rear half in the cAMP gradient used in Fig. 7. The gradient generates a difference of concentrations, which is amplified further by Ric8. Right: The time course of membrane at the front half and rear half in the same cAMP gradient. -
(v)
Note that the cAMP gradient introduces a larger sink of Gαβγ and a larger Gβγ concentration at the front initially, but the diffusion of Gαβγ guarantees the continuous supply at the membrane as long as saturation is not reached. Moreover, the distribution of Gβγ is essentially uniform on the membrane and within the cytosol (Fig. 8 (left)) after , as was reported in [45]. This eventually leads to a uniform distribution of at the entire cell boundary, but is higher at the front due to the asymmetrical recruitment of RasGEF from the cytosol. Ras activity at the rear of the cell decreases below the prestimulus level because the activity offsets the activity there.
In summary, the fast time scale of -mediated RasGEF and RasGAP activation induces the first transient Ras activation on the entire membrane, while the slow time scale of overall equilibration (redistributions due to diffusion and membrane localization) induces the delayed secondary response that produces the symmetry breaking.
The effects of diffusion
The results in the previous section suggest that diffusion plays an important role in inducing the biphasic response. To investigate this, we do simulations in which the diffusion coefficients of , RasGEF/GAP, G2, and Ric8, all of which are present in the cytosol and diffuse, are individually set to ( of the normal value) and compare the Ras response with that in WT cells.
-
•
Slow Gβγ diffusion
In the absence of apparent diffusion after dissociation, localized leads to highly polarized activation of RasGEF (Fig. 10 (left)). Correspondingly, in the transient activation phase the peak value of at the rear half is the same as in WT cells, but the peak at the front half increases from to (cf. the right panel of Fig. 10 and the left panel of Fig. 7). Moreover, RasGAP activity is polarized (cf. the left panels of Fig. 10 and Fig. 8), causing a stronger deactivation at the front. Hence we observe a slightly reduced steady state response ( v.s. ) in the front half during the symmetry breaking phase of Ras activation. It is not surprising that the reduced diffusion still captures the biphasic behavior in the sense that is still polarized and its downstream pathways are minimally affected. Although varies along the cell perimeter, it is counterbalanced by a stronger polarized (Note that both and at the front in the left panel of Fig. 10 are much larger than the ones in the right panel of Fig. 8).
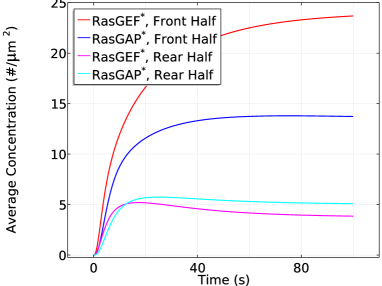
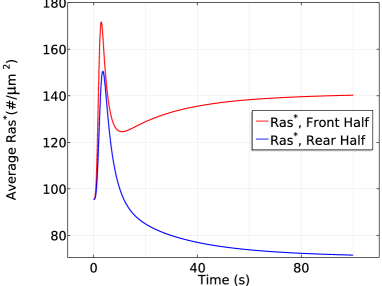
Figure 10: Left: The time course of and activity at the front and rear halves in the absence of apparent Gβγ diffusion in the same gradient as previously used. Right: The time course of average activity in the absence of apparent Gβγ diffusion in that gradient. -
•
Slow RasGEF diffusion: the necessity of ‘activator’ diffusion
The supply of RasGEF is localized on the membrane when RasGEF diffuses slowly, since can only attract very limited RasGEF from the cytosol very close to the membrane. Moreover, diffusion of ensures an almost uniform RasGAP and RasGEF activity at the front and the rear at steady state. Consequently, we observe that both the front and rear half of the cell adapts to the cAMP gradient and there is no Ras reactivation at the front due to limited availability of RasGEF, as shown in Fig. 11. The front settles down at a slightly higher level of comparing to the rear due to a slightly stronger RasGEF activity.
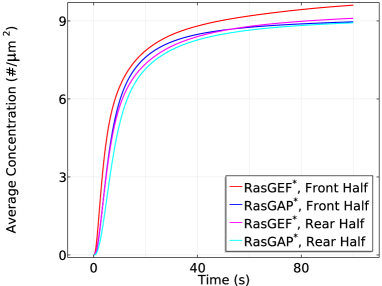
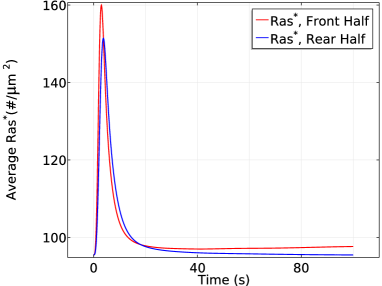
Figure 11: Left: The time course of average and at the front and rear halves in the absence of apparent RasGEF diffusion in the same gradient as previously used. Right: The time course of average in the absence of apparent RasGEF diffusion in that gradient at the front and rear halves. -
•
Slow RasGAP diffusion: ‘inhibitor’ diffusion is not necessary
Although the supply of RasGAP is also primarily restricted to the membrane when RasGAP diffuses slowly, there is enough RasGAP on the membrane due to the relatively small mean cAMP concentration (5.5 nM) in the gradient used. As a result, the biphasic behavior is not affected, as shown in Fig. 12.
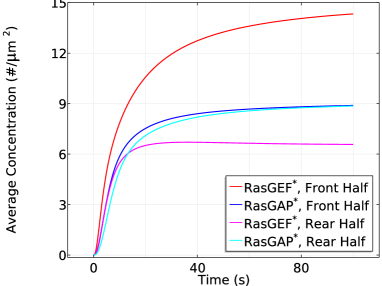

Figure 12: Left: The time course of the average and at the front and rear halves in the absence of apparent RasGAP diffusion using the previous gradient. Right: The time course of average in the absence of apparent RasGAP diffusion in that gradient. In LEGI based models, the global diffusion of inhibitor is essential for inducing symmetry breaking. It is proposed [27] that the inhibitor might be RasGAP, but our model predicts that the diffusion of RasGAP is not a key component as long as there is sufficient amount of RasGAP on the membrane. Instead, a diffusible activator RasGEF becomes essential to induce symmetry breaking. In a LEGI scheme, the diffusion of inhibitor creates a uniform inhibitor distribution and the gradient induced nonuniform activator activity generates the symmetry breaking. In our model, the incoherent activation of both activator (RasGEF) and inhibitor (RasGAP) are induced through diffusing . Hence the Ras activity induced by alone is balanced along the cell. In other words, the cell can not develop a sensitive gradient sensing from a diffusing . Alternatively, facilitated pathways are the critical elements.
We also tested scenarios in which both G2 and Ric8 diffuse slowly, and when both Gβγ and RasGEF diffuse slowly (see Supporting Information). In summary, various Ras activity patterns can be realized by controlling only the diffusion rates, thus revealing a potential role for diffusion in explaining the observed diverse sensitivities of genetically identical Dicty species in response to cAMP [60].
The dependence of Ras activation on the magintude of the gradient and the mean concentration
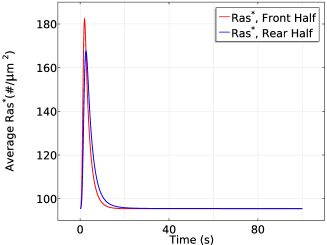
To determine how the front-to-back gradient affects the activation of Ras, we stimulate the cell using two gradients: a shallow one with nM and nM, and the previously-used gradient with nM and nM, both at the same mean cAMP concentration of 5.5 nM. The cell responses are shown in Fig. 13. Ras activation is qualitatively similar in both a shallow gradient and a steep gradient, but smaller in magnitude in both phases for a shallow gradient. This is not surprising, since a steep gradient produces more Gβγ locally, which accounts for the slightly higher initial response, and a steeper gradient that initiates the second phase. Note that the front-rear difference in a steep gradient is around 70 while the front-rear difference in shallow gradient is around , giving a ratio of , which is roughly the ratio of the front-rear difference between the steep gradient (9 nM across the cell) and the shallow gradient (2 nM across the cell). Our model predicts results similar to those reported in [19], where gradient-dependent activation of Ras is observed.
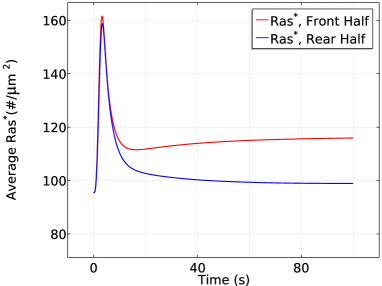

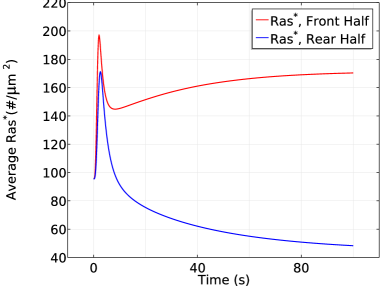
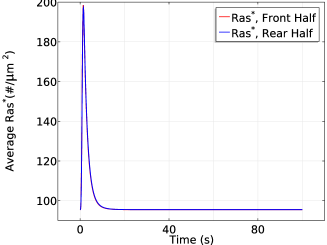
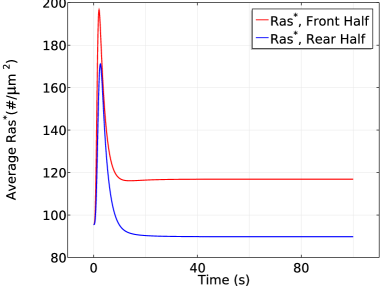
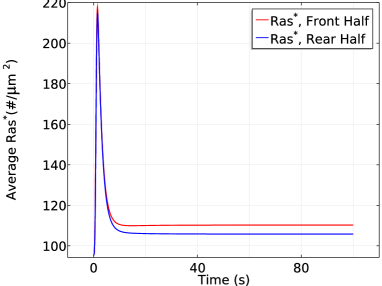
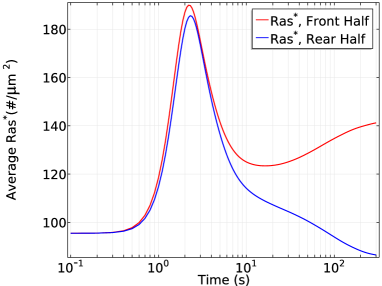
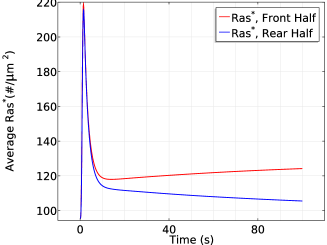
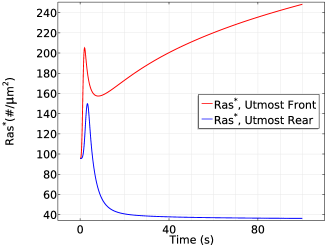
Next we test whether the cell responds differently in the same large gradient () with different mean concentrations. As shown in Fig. 14, in a steep gradient at a mean concentration of 25 nM, the front and back halves respond differently in the first phase of Ras activation — the front half reaches a maximum of while the rear half only reaches a maximum of . Ras is reactivated at the front when the average drops to and symmetry breaking is well established after 100 seconds of cAMP stimulation, resulting in a 3.5 fold difference () between the front half and rear halves. Surprisingly, we observe different response when the cell is exposed to the steep gradient at a higher mean concentration of 150 nM. In the first phase of Ras activation, the front and the rear responses almost exactly the same – both increase to a maximum of – which is followed by a decrease to . Then Ras is slowly reactivates at the front and the front-rear difference reaches less than after 100 seconds of stimulation.
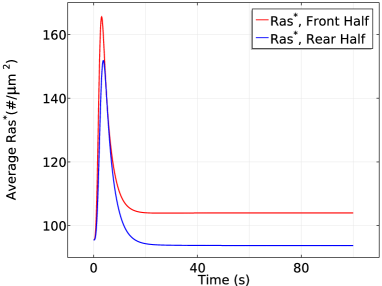
It is tempting to say that symmetry breaking is strongly reduced when the mean concentration increases to a saturation level, but strong symmetry breaking appears and the steady state difference between front and rear halves reaches approximate 1.3 fold if we observe the cell for a longer time, as shown in Fig. 15. This shows that a higher mean concentration induces a more ’uniform’ initial transient activation followed by much slower symmetry breaking.
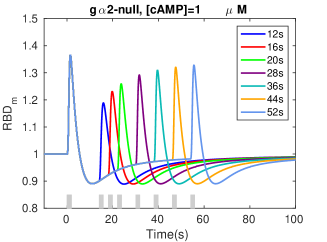
No symmetry breaking in -null cells
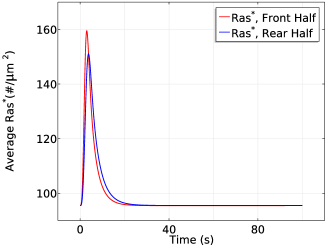
It is reported [19] that in -null cells, the cAMP gradient induces a short transient uniform Ras activation but the specific upgradient Ras reactivation never occurs. We test our model for -null cells by blocking the promoted RasGEF and Ric8 localization, and the simulation results are illustrated in Fig. 16 for different gradients and same gradient with different mean concentrations. In all three gradients we tested, -null cells only exhibit the initial transient activation of Ras in consistent with the experimental findings. The cell settles down at the same level of at both the front and rear of the cell, suggesting the failure of direction sensing. Both the experimental measurements and computational simulation reveal the essential role of in generation of direction sensing.
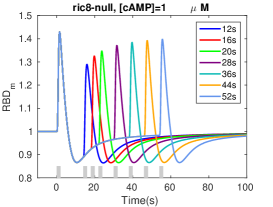
No direction sensing when ric8-null cells are exposed to a shallow gradient or a steep gradient with high mean concentration
Recall that ric8-null cells have a decreased G2 dissociation at the steady state compared with WT cells in uniform stimulus, and here we test whether ric8-null cells are able to sense directions effectively in a cAMP gradient. Ras activation is illustrated in Fig. 17 when ric8-nulls are exposed to gradients of the same mean concentrations with different steepness. Comparing with the plot in the left panel of Fig. 13, the average front-rear difference is reduced 8 fold for the shallow gradient (from in WT cells to ). Consistent with experimental findings [22], the almost identical activity at the front and rear suggests failure of direction sensing when ric8-null cells are exposed to a shallow gradient. The plot in the right panel suggests that the cell is still able to sense direction when the gradient is large enough, but the biphasic responses disappear.
It has been shown that ric8-null cells migrate with an efficiency similar to that of wild-type cells when cells are exposed to a steep gradient of cAMP () [22]. We tested our model with a gradient of with different mean concentrations, and the results are shown in Fig. 18. As shown in the left figure, ric8-null cells still sense direction by creating an asymmetrical distribution of . However, the asymmetry is strongly reduced comparing to WT cells (left panel of Fig. 14). Moreover, ric8-null cells do not exhibit a biphasic response. Instead, the front and rear half of the cell settle at different levels after initial transient activation. Surprisingly, when the mean concentration is elevated to 150 nM, ric8-null cells lose the ability to sense direction, as shown in the right panel of Fig. 18 (front rear difference is less that ). Hence our model predicts that Ric8 is essential for chemotaxis in both shallow gradients of cAMP and steep gradients with high mean concentration. In the range of cAMP gradients where ric8-null cells can sense direction, our model predicts that there is no biphasic Ras activation and little amplification.
A solution to the back-of-the-wave problem
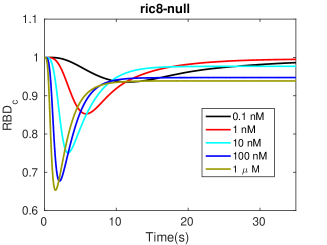
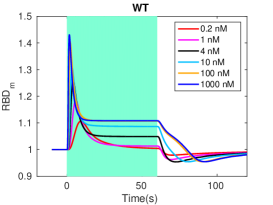
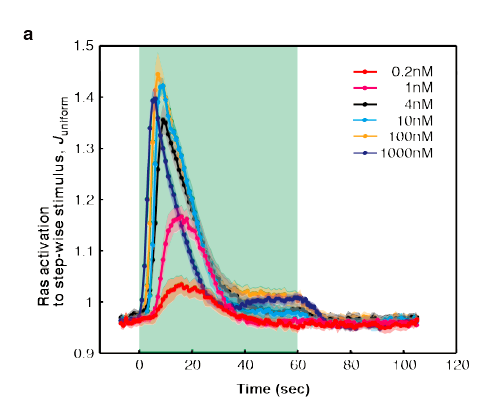
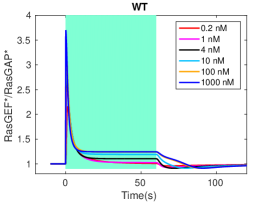
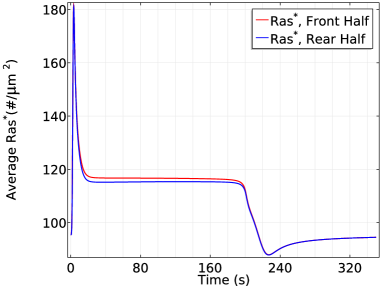
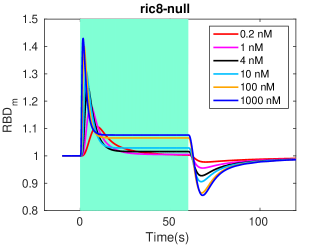
In the context of Dicty aggregation, the ‘back-of-the-wave’ problem refers to the fact that cells do not turn to follow the cAMP gradient after the wave has passed, despite the fact that the spatial gradient reverses as the wave passes over a cell [61, 15]. This requires some level of persistence of ’orientation’ of a cell, but there is as yet no agreed-upon mechanistic solution for this problem, since polarization and other factors may play a role. Under uniform stimuli, cells are said to show rectification if there is an asymmetry in the amplitude and evolution of the response to a step increase in cAMP compared with the response following removal of the stimulus [21]. To test whether the proposed network exhibits rectification in this sense, we apply a uniform stimulus of various concentrations for 60 seconds and then remove it, as was done experimentally in fully aggregation-competent cells [21]. Fig. 19 (left and center) show the simulation and the experimental results, resp. In both cases the concentration of cAMP is increased from 0 M to the concentrations indicated for 60 seconds (green shaded area), followed by a decrease to 0 M, and in both cases one sees a much larger and faster change in RBD following application of the stimulus than on removal. We also applied the same stimuli as used above to -null cells and ric8-null cells. Results given in the Supporting Information show that Ric8 plays a significant role in the rectification, as will also be seen later in the traveling wave analysis.
Some insight into this behavior can be gained from simple models of excitation and adaptation, such as the cartoon description defined by the system of equations
| (1) |
Here represents the signal and the magnitudes of and reflect the time scale for excitation and adaptation, resp., and one see that adapts perfectly to a constant stimulus whereas compensates for the stimulus. However, the temporal responses to increasing and decreasing stimuli are symmetric, and therefore such a simple model cannot explain the observed response. Nakajima et al. [21] suggest that a single-layered incoherent feedforward circuit with zero-order ultrasensitivity [62] is necessary to generate rectification, but our model does not include an ultrasensitive circuit. Instead, rectification is induced solely by the balanced regulation of RasGEF and RasGAP activity. The ratio of to increases 2-4 fold very rapidly in response to a step increase in the cAMP concentration, but when the stimulus is removed this ratio does not drop significantly, as shown in the right panel of Fig. 19. Thus Ras activation persists because the ratio equilibrates rapidly while the absolute levels of the factors decrease more slowly.
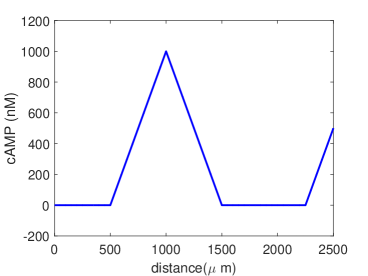
To study how cells would respond in wave-like spatially-graded stimuli, we first generate a simple trianglular wave that approximates a natural cAMP wave. Let denote the cAMP concentration at of the cell at time , and specify it as
where is the wave speed and . This wave resembles a natural wave when we choose the natural wave speed , as shown in Fig. 20. The wave length is m, and at the natural speed any point on a cell is subject to an increasing stimulus for 100 sec on the upstroke of the wave and a decreasing stimulus for 100 sec on the downstroke.

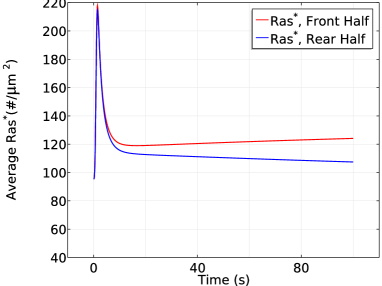
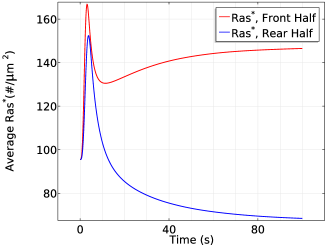
As shown in Fig. 21, Ras is activated everywhere as the wave passes, but Ras activation is delayed about 1 sec in the rear half (Fig. 21 -right) for a wave traveling at the natural wave speed. Ras activation is higher at the front of the cell than at the rear throughout passage of the wave, thereby providing persistent directionality in Ras activation and the potential for persistent orientation as the wave passes. It should be emphasized that we are simulating the rounded LatA-treated cells that have no intrinsic polarity, which suggests that polarity is not necessary for the persistence of direction sensing at the natural wave speed, even at the level of Ras activity. By comparing Fig. 19 and Fig. 21, one sees a similar pattern in Ras activation. In fact, due to the rectification characteristic observed in uniform stimuli, activity does not drop significantly in a wave, and therefore the front is able to maintain a higher . To determine whether the cell is able to respond after the first wave passes, we applied the same wave for three periods, and one sees in Fig. 22 that the cell responses are almost identical for three successive passages of a wave.
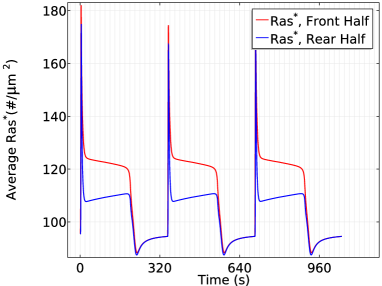
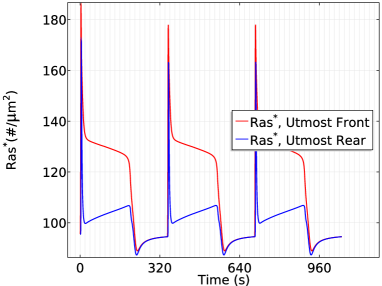
It is also known that wave speeds affect the spatial pattern of Ras activity over a cell [21], in that Ras is activated uniformly for a fast wave, and activated at both the wavefront and waveback for slow waves. To test the effects of the wave speed, we apply a fast wave () and a slow wave () to the rounded LatA-treated cells. The results are shown in Fig. 23. At a wave speed of , Ras activation is uniform along the cell periphery, as is observed in the experiments, but at we see a significant Ras reactivation at the rear of the cell and the distribution reverses at the back of the wave.
As was pointed out earlier, Ric8 plays an essential role in rectification under uniform stimuli, and to further emphasize that the back of the wave problem is closely connected with the disparity in the response to increasing vs. decreasing stimuli, we applied the same wave used previously to a ric8-null cell. The activity is shown in Fig. 24, where one sees that the persistence of directional information is essentially lost. It is not surprising to see that at the front becomes smaller than the rear, which indicates a reversal in the distribution, further reinforcing the importance of the asymmetric response to increasing vs decreasing stimuli in solving the back of the wave problem.
The trade-off between persistence of directionality and the ability to reorient
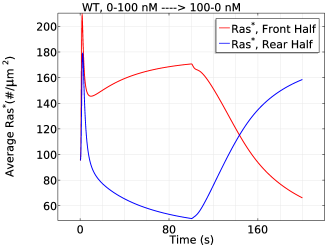
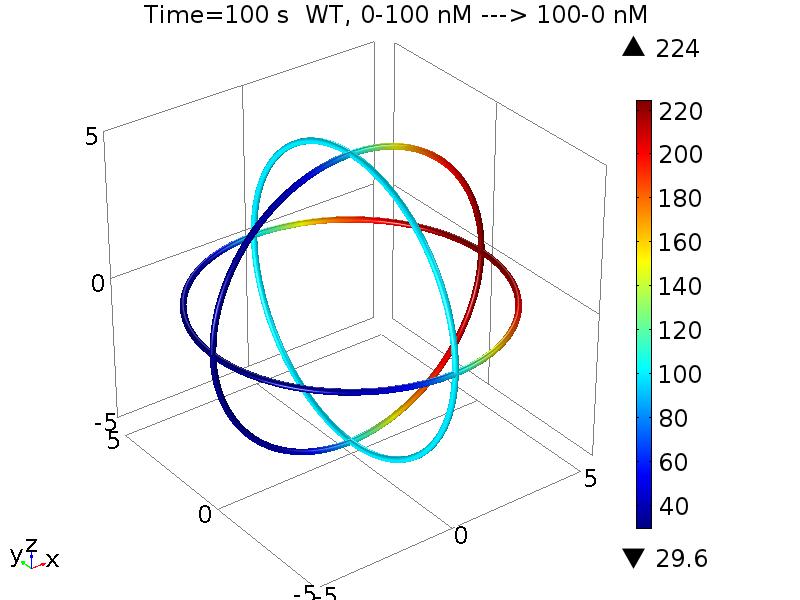
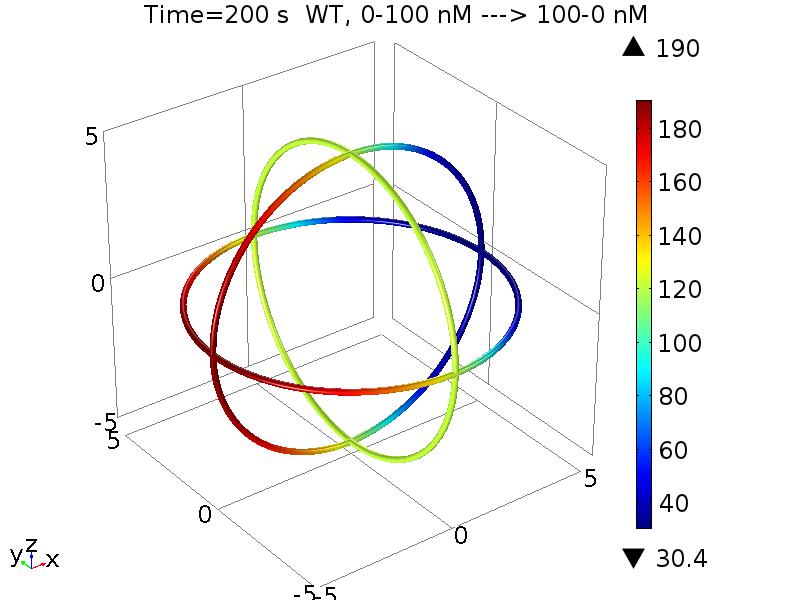
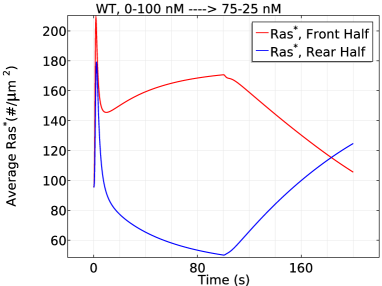
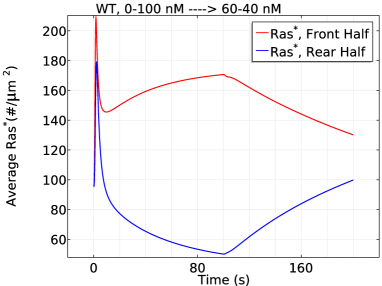
Clearly there is a trade-off between the persistence of directionality in Ras activation and the ability of cells to respond to new gradients. To investigate whether the Ric8-induced rectification has an adverse effect on reorientation in response to a reversed gradient, we subject cells in a 0-100 nM gradient to reversals to increasingly weaker gradients. In each case we keep the mean concentration experienced by the cell fixed to eliminate the mean concentration effect (see. Fig. 14). For an equally strong reverse gradient (100-0 nM), the directional persistence of is reversed within 100 seconds of gradient reversal, as shown in Fig. 25. The spatial profile also indicates that distribution is strongly reversed after switching to equally strong reversed gradients, (Fig. 25 –center and right). It is observed in Dicty that all cells () reversed their direction of migration under this protocol [22]. For intermediate gradients (75-25 nM), is slightly reversed (Fig. 26 –left) in the same time window (0-200 s). The spatial plot of indicates a fluctuation along the cell periphery at the end of time window s, (not shown) suggesting uncertainties in redistribution. Consistently, experiments show that a fraction of the cells () did not reverse their migration direction. For weak gradients (60-40 nM) a difference in Ras activation is still maintained at the end of the time window ( s) (Fig. 26 (right)), consistent with the observation that that all cells continued moving in their original direction in this case [22]. These simulations suggest that Ric8-induced rectification does not harm cells’ reorientation in response to large amplitude reversals of the gradient, but it delays the reorientation in a weak reversed gradient.
Variants of the model
Robustness of the Gα-G-Ric8 triangle
In the current signal transduction mechanism Ric8 cycles between a cytosolic pool and the membrane, where it is activated by Gβγ and it in turn reactivates Gα. There is some evidence in other systems that Ric8 may not require an activation step on the membrane [64, 65], and here we investigate the robustness of the Gα-Gβγ-Ric8 triangle by considering other possibilities. For convenience in comparing schemes, we call the current translocation-activation mechanism Mode 1, and consider two alternative schemes.
-
•
Mode 2: Translocation-only mechanism. Reaction and in Table LABEL:Table_reaction are eliminated. is modified so that reactivates Gα directly.
-
•
Mode 3: Alternative translocation-only mechanism. We remove the activation steps as in Mode 2, and Gα is assumed to be the membrane recruitment promoter in reaction .
The simulations demonstrate that Mode 2 still captures the basic characteristics of Ras activation, very similar to the results for Mode 1, except that the magnitudes are slightly changed (see Supporting Information for plots). This suggests that Gβγ activation (Reaction in Table LABEL:Table_reaction) is not an essential step.
As for Mode 3, it is shown that the cell is still able to sense direction and exhibit biphasic responses under various cAMP gradients (see Supporting Information for plots). They differ from the results in Mode 1 and Mode 2 in that the point Ras activity equilibrates more rapidly and the magnitudes of the front-back differences are smaller.
These results demonstrate the robustness of the the Gα-G-Ric8 triangle in the signal transduction pathways, providing flexibility in modeling this triangle.
Amplification at the level of Ras
It has been reported that the gradient of active Ras across the cell is substantial in an imposed cAMP gradient [66]. Recent quantitative analysis also suggests that amplification may occur at the level of Ras [19]. We test the magnitude of amplification by calculating the amplification factor [67, 68]
where is the mean value of . and are the concentrations of at the point on the cell surface exposed to the highest and lowest concentration of stimulus, respectively. If , the signal is amplified.
The amplification indices are summarized in Table 2. As one sees in the table, the signal is amplified at the level of Ras in both Mode 1 and Mode 2, but the signal amplification indices for Mode 3 are smaller than 1, which indicates that the signal is not amplified.
| 1-10 nM | 0-50 nM | 125-175 nM | |
|---|---|---|---|
| Mode 1 | 1.3 | 1.7 | 2.7 |
| Mode 2 | 1.6 | 2.0 | 1.6 |
| Mode 3 | 0.6 | 0.7 | 0.7 |
There are two sources of amplification in the proposed network. Firstly, the higher concentration of on the membrane at the front of the cell induces a higher localization and activation of Ric8, which reactivates and further promotes RasGEF localization at the front. Secondly, faster G2 reassociation at the back due to higher hydrolysis induces a faster G2 cycling, providing more G2 at the back. As a result, the faster reassociated at the back can provides a source of needed at the front by diffusion, which creates an imbalanced sequestration of between the front and the back. These two positive feedback loops are built into Mode 1 and Mode 2, but not into Mode 3.
The effect of cell shape
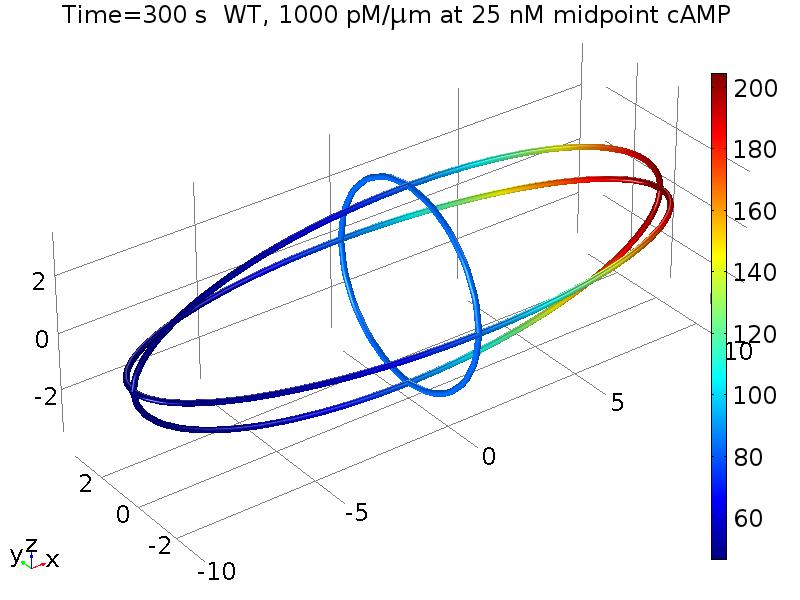
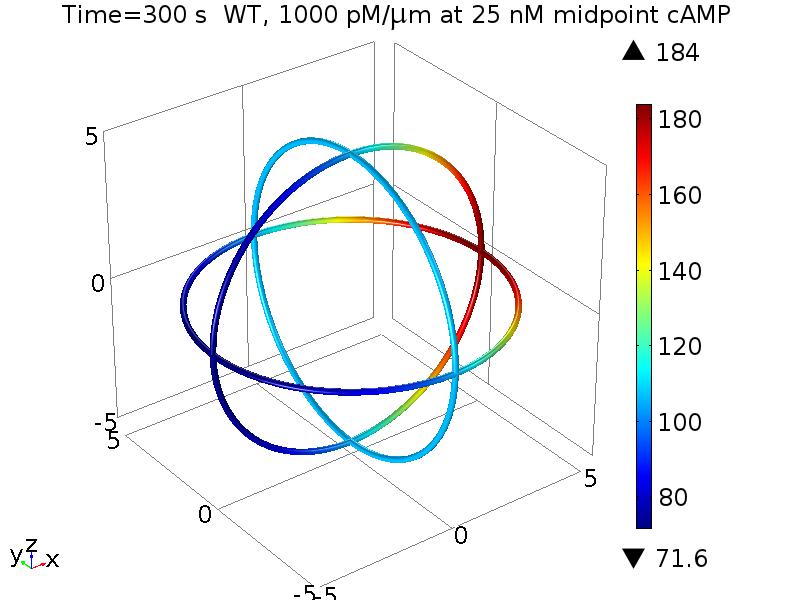
Heretofore we have assumed that the cell is pretreated with LatA, hence the cell is spherical with radius . To investigate how cell shape may alter the dynamics, we construct an ellipsoid with the same volume as that of the standard cell. By assuming that the ellipsoid is prolate, we have
To test the effect of this shape change, we applied a cAMP gradient of 1000 with a 25 midpoint, and the resulting responses are shown in Fig. 27. The basic characteristics of Ras activation are still maintained for an ellipsoidal cell: the cell first experiences a transient activation both at the front and rear; then Ras is reactivation at the front and a clear symmetry breaking emerges.
Fig. 27 illustrates how cell shapes affect Ras activity. On one hand, the density of molecules is reduced when the cell is changed from a sphere to an ellipsoid with the same volume. Hence we see that the peak of first phase for an ellipsoid is smaller than for a sphere due to lower availabilities of molecules, although the endpoint cAMP sensed by a cell is increased from a 10 nM difference (20-30 nM) to a 20 nM (15-35 nM) difference. On the other hand, although the point at the frontal point for a ellipsoid cell is higher than a sphere cell (see right panels of Fig. 27), the average at the front half of the ellipsoid cell is still smaller than for the sphere cell, suggesting that the larger gradident does not compensate for the smaller molecular densities.
Discussion
Chemotaxis is a dynamic spatio-temporal process that involves direction sensing, polarization, and cell movement, and direction sensing is the first essential step in this process, becuase it defines the cell’s compass. A growing body of evidence suggests that Ras is an ideal candidate within the chemotactic signalling cascade to play an essential role in direction sensing [66, 30]. In this article, we developed a novel modular model of direction sensing at the level of Ras activation. The model incorporates biochemical interactions in Dicty and captures many aspects of its response. The model consists of the cAMP receptor, the G-protein G2, and a Ras GTPase module in which both adaptation and amplification occur. Utilizing a rounded cell pretreated by LatA as was done in experiments, we investigated Ras activation patterns in various cAMP stimuli. Simulations of this model give insights into how the signal transduction network determines Ras activation characteristics in wild type cells, how an altered network in mutant cells changes Ras activation, and how the spatial profile and persistence of Ras activation can lead to directional persistence.
We proposed an experimentally-based kinetic model of G2 signaling in which the intact G2 and the subunit can cycle between the membrane and the cytosol, while the subunit remains membrane-bound. Moreover, can be reactivated by the only known (to date) GEF for , Ric8. The regulation of Ric8 is not well-defined, but we assume that it is also cycles between the cytosol and the membrane, and that its recruitment to the membrane is promoted by . The model replicates the persistent dissociation in the presence of cAMP, and also demonstrates that and are produced in a dose-dependent manner. Interestingly, the model reveals that exhibits dose-dependent kinetic diversities. The variety of dynamics revealed here may have important implications in direction sensing because in neutrophils -GDP accumulates at the leading edge and is involved in regulating directionality [69], although it has not been demonstrated that Ric8 is involved there.
Adaptation of Ras activity is controlled by a balance between RasGEF and RasGAP, both of which can cycle between the membrane and the cytosol. This component of the network involves incoherent feed-forward, and becuase both can cycle between membrane and cytosol, can give rise to spatial asymmetry in Ras activation. Both RasGEF and RasGAP are activated at the membrane by free , but the translocation of RasGEF from the cytosol is enhanced by . The proposed translocation-activation topology is able to capture the dose-dependent Ras activation and various patterns such rectification and refractoriness under uniform stimuli. It also predicts that imperfect adaptation is inevitable in wild type cells due to the asymmetrical translocation of RasGEF. Takeda et al. [27] proposed an incoherent feedforward activation model to explain adaptation of Ras activity in which RasGEF is assumed to be confined to the membrane and RasGAP diffuses in the cytosol. In our model, both RasGEF and RasGAP can diffuse in the cytosol at equal rates, and both can be recruited to the membrane and activated by .
Direction sensing, biphasic Ras activation and signal amplification are achieved by complex interactions between the modules. The incoherent-feedforward-activation by globally-diffusing contributes to a transient activation along the entire cell perimeter. The activation at the front of the cell (facing the higher cAMP concentration) is initially faster and stronger due to the cAMP gradient, but it provides no symmetry breaking or signal amplification since diffusion eliminates the initial concentration gradient. This means that Gβγ does not reflect the external stimulus gradient and provides no basis for direction sensing in LatA-treated cells, although it is essential for RasGEF and RasGAP activation. It is the Ric8 regulated, membrane-bound that determines the symmetry breaking and signal amplification. creates an asymmetrical recruitment of RasGEF in a cAMP gradient, which in turn induces asymmetrical RasGEF activation, providing a basis for symmetry breaking. More importantly, Ric8 recruitment to the membrane is elevated by , while activated Ric8 reactivates , forming a positive feedback loop. In addition, faster G2 reassociation at the back of the cell due to less reactivation of there induces faster G2 cycling. Since G2 diffuses in the cytosol, this provides a potential redistribution of G2 from the back to the front, which in turn results in more at the front, thereby forming another positive feedback loop. These two positive feedback loops generate the symmetry breaking and signal amplification of Ras activation in a cAMP gradient.
In contrast to LEGI-type models, the global diffusing Gβγ does not act as an inhibitor directly in our model – instead, it induces both activation and inhibition by activating RasGEF and RasGAP respectively. Gβγ also serves as a ‘global’ activator for the pool of and as a ‘global’ inhibitor by creating a uniform inhibition pool of . Asymmetry in their localization at the membrane arises from the fact that membrane-bound G recruits RasGEF from the cytosol, thereby creating an asymmetrical pool of . Hence, our model can be regarded as a local-global transitions of both excitation and inhibition with a delayed local sequestrations of excitation model, in the sense that initially both activation and inhibition go through a local-global transition due to diffusion of while a delayed localized translocation by contributes to a local excitation. Direction sensing is results from the - mediated, -Ric8 dependent signal transduction network.
The genome of Dictyostelium contains 25 genes encoding for RasGEFs and 17 genes encoding for RasGAPs that potentially activate and inactivate Ras, respectively [50, 70]. Various RasGEF and RasGAP could be utilized at different stages of chemotaxis [19]. Our model suggests that both refractoriness and rectification are managed by subtle temporal regulation of RasGEF and RasGAP activity, highlighting the importance of RasGEF and RasGAP activation.
We also studied cell responses to and ric8 mutations extensively. It is predicted in numerical simulations that in the presence of uniform stimulus, adaptation of Ras activity is perfect and the maximum cytosolic RBD depletion is reduced in -null cells. In a cAMP gradient, -null cells fail to sense directions and there is only an initial transient Ras activation. Adaptation of Ras activity is still imperfect in ric8-null cells, but the magnitude of imperfectness is reduced comparing to wild type cells. Moreover, simulations suggest that ric8-null cells fail to sense direction when they are exposed to a shallow gradient or a steep gradient with high mean concentration, highlight the importance of Ric8 in regulating Ras activation.
There are still missing links in our proposed model. Firstly, there are no direct evidence in Dicty that is connected to RasGEF translocation. Secondly, there is no Ric8 activation mechanism established in Dicty. To establish the missing link, it is important to study molecules that interact with and Ric8 in experiments, where our model could provide guidance in experimental designs.
Although the model is based on cAMP induced Ras activation in Dicty, GPCR mediated Ras activation is remarkable conserved between Dicty and mammalian leukocytes [8]. GEF translocation through interacting with an upstream GTP-bound G protein is a principle conserved in evolution [46] and Gα’s role in GPCR mediated signalling has been emphasized in other systems [71, 51] and in drug discovery [72]. Therefore, our model could serve a generic framework for GPCR mediated Ras activation in other systems.
Materials and Methods
The evolution equations for the reaction-diffusion model
We first formulate the reaction-diffusion system of signal transduction in general terms and then list the specific equations for the model.
Consider a bounded three dimensional domain representing a cell, and denote as the plasma membrane. Then the reaction diffusion equation for a cytosolic species A is
| (2) |
in which represents the concentration of A at time at and is the diffusion coefficient of A. The summation is a reaction term indicating participates in cytosolic reactions which either depletes it or produces it. The th reaction produces molecules of A, or consumes molecules of A with a reaction rate . In the signal transduction network considered in this article, .
The boundary conditions involve reactions on the boundary and binding and release of molecules at the membrane. We assume that the volume density (the concentration in the cytosol) for A has the units and that the surface density (the concentration on the membrane), , has the units . We also assume that the binding reactions at the membrane take place within a layer of thickness at the membrane. Then the net flux to the boundary, which can be positive or negative, can be written as
| (3) |
where is the exterior unit normal to , are the on and off rate of binding to the membrane, and relates the units of volume density and surface density scaled by Avogadro’s constant.
For the membrane form of species A we have the translocation-reaction-diffusion equation,
| (4) |
where denotes the concentration on the membrane and is the surface diffusion coefficient [73, 74]. The first term represents the diffusion on the membrane, which we ignore throughout, and the second represents transolcation between cytosol and membrane, which could be absent if A is confined on the membrane, such as , .
There may also be conservation laws for certain substances. If the substances are confined to the membrane we write
| (5) |
where s are the concentrations of different forms and represents the total amount in the cell. If the substances are present both in the cytosol and on the membrane, we write
| (6) |
where s are the concentrations of different forms in the cytosol and s are the concentrations of different forms on the membrane.
We are now ready to assemble the system of equations that constitute the full kinetic model in a given geometry . We have to account for 6 cytosolic species in the system: , , , , and . The evolution can be described by a system of diffusion-translocation equations
with the following conditions on ,
The species that evolve on the membrane are: , , , , , , , , , , , , and . The evolution equations for these are given by
The following conservation laws are also imposed:
| (7) |
where is the total amount of receptors.
| (8) |
where is the total amount of heterotrimetric G protein, indicating the cell does not produce additional heterotrimetric G protein.
| (9) |
Similarly, for RasGAP
| (10) |
For Ras, we have
| (11) |
Parameters
We have to adjust the parameters to incorporate and where needed.
The parameters involved in the Receptor module are taken from the literature. We estimated the parameters in the heterotrimeric G protein module from steady state analysis (SSA) of the spatially lumped model averaged from the spatially distributed model, see Parameter estimation. The parameters in the Ras module are also estimated from steady state analysis and characteristics of Ras activation. The detailed estimation scheme is described in the appendix. We summarize the parameters in the following table.
| Parameter | Value | Description | References |
| 5 | Cell radius | [45] | |
| 10 | Effective length for membrane reactions | [75] | |
| 80000 #/cell | Total RasGEF molecules | [76, 77] | |
| 80000 #/cell | Total RasGAP molecules | [76] | |
| 300000 #/cell | Total Ras molecules on the membrane | [76] | |
| 300000 #/cell | Total heterotrimeric G protein molecules | [76, 75] | |
| 80000#/cell | Total receptors on the membrane | [38, 78] | |
| 30 | Diffusion constant of RasGEF | [79] | |
| 30 | Diffusion constant of RasGAP | [79] | |
| 30 | Diffusion constant of Gαβγ | [79] | |
| 30 | Diffusion constant of Gβγ | [79] | |
| 30 | Diffusion constant of | [79] | |
| 30 | Diffusion constant of | [79] | |
| 5.6 | Average binding rate of cAMP to GPCR | [40, 42] | |
| 1 | Average unbind rate of cAMP-bound GPCR | [40, 78] | |
| 0.02 | Gαβγ dissociation rate by | Estimated from SSA and [42] | |
| 1 | GTPase rate | [75] | |
| 0.004 | Ric8 activation rate on the membrane | ||
| 0.2 | reactivation rate by | ||
| 1 | deactivation rate | ||
| 0.0070 | Reassociation rate of Gα and Gβγ,m | Estimated from SSA and [42] | |
| 1 | Off rate of Gαβγ,m | [44] | |
| Translocation rate of G | Estimated from SSA | ||
| 1 | Off rate of Gβγ,m | Set the same as | |
| Translocation rate of Gβγ,c | Estimated from SSA | ||
| 1 | Off rate of | Set the same as | |
| Translocation rate of | Estimated from SSA | ||
| Translocation rate of facilitated by | |||
| 0.0004 | RasGEF activation rate by Gβγ,m | ||
| deactivation rate | |||
| 0.0001 | RasGAP activation rate by Gβγ,m | ||
| 0.5 | deactivation rate | ||
| 0.11 | Ras activation rate by | ||
| 1 | deactivation rate by | ||
| Spontaneous Ras activation rate | |||
| Spontaneous deactivation rate | |||
| Off rate of | Set the same as PTEN [80] | ||
| Translocation rate of | Estimated from SSA | ||
| Translcation rate of facilitated by | |||
| Off rate of | Set the same as PTEN [80] | ||
| Translocation rate of | Estimated from SSA |
Acknowledgments
This work was supported by NSF Grant DMS #s 9517884 and 131974 to H.G. Othmer, and by the Newton Institute and the Simons Foundation.
Supporting Information
Other characteristics under uniform stimuli
Short vs Long saturating stimuli
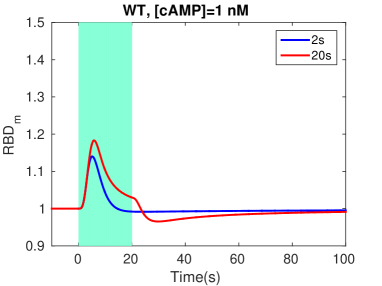
Our proposed network exhibits a maximal response to short saturating stimuli. RBD translocation is illustrated in Figure 28 when the cell is applied a short (2s) and a long (20s) saturating stimuli (1 ). Short and long stimuli lead to a response with the same rise time, the same peak and the same initial decline, although there is a additional slowly-declining phase for the longer stimulus. Similar experiments are reported in [20], in which it is suggested that this slowly declining phase could be related to the start of the secondary responses usually seen during continued stimulation [81, 82].
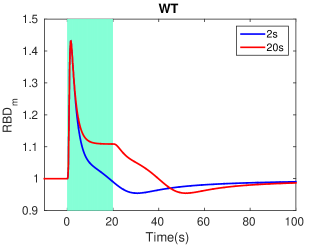
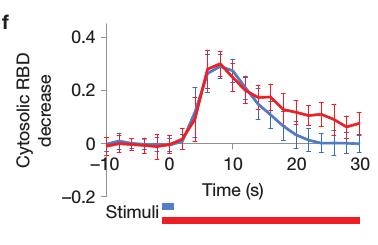
Left: Simulation; Right: Results reported in [20]. Blue indicates a 2s stimulus and red indicates a 20s stimulus.
In the model the ratio of and determines the Ras activation, and for saturating cAMP stimuli the ratio rises instantaneously and arrives at a maximum within 2 seconds, whereas it takes longer to achieve maximum RasGEF and RasGAP activation separately. Hence we observe a response with the same rise time and the same peak for short and long stimuli. In the latter case there is an additional slowly-declining phase due to the higher peak of and . This indicates that subtle regulation of RasGEF and RasGAP activation at saturating cAMP is essential for the observed characteristics.
Cell responses under non-saturating cAMP stimuli
We predict that the cell loses the ability to induce full responses by short stimuli and the existence of a refractory period greater than 12 seconds (which was the smallest time interval between stimuli used in [20]) at low cAMP level since temporal dynamics of RasGEF and RasGAP are much weaker, which is confirmed by simulation results shown in Fig. 29 where the cAMP level is reduced from to . Indeed, longer stimulus induces higher peak of and duration between stimuli no longer affects second response.
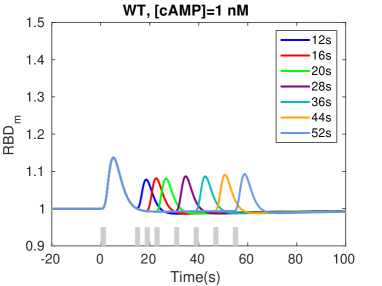
Left: time course of when the cell is applied a 1 nM short stimulus and long stimulus; Right: time course of to two 2s cAMP stimuli of 1 nM separated by increasing duration.
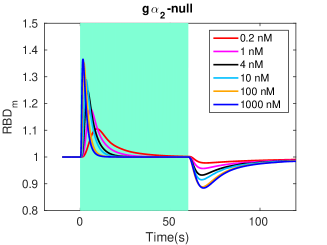
Rectification in -null cells and ric8-null cells
As seen from Figure 30, the simulated -null cells show a much larger response to termination of the stimulus, as shown in the middle panel. At 1 cAMP, RBD drops 15% below the prestimulus level, compared to 5% in WT cells. Surprisingly, rectification is significantly reduced compared to that in WT cells, and even compared to -null cells. To understand these behaviors, recall that G2 re-association is increased in -null cells because activation is absent. As a result, the time dynamics of RasGEF and RasGAP are altered correspondingly (see Figure 31), and consequently, Ras activation patterns are changed.
Other characteristics under a graded stimulus
Effects of diffusion
-
•
Slow G2 and Ric8 diffusion
The cell responds similarly when there is no apparent and Ric8 diffusion, as demonstrated in Fig. 32 and Fig. 33. In both cases, Ras activation first occur at both ends, to reach a maximum, and then to decline to reach different steady-state levels in distinct parts of the cell. Only a shallow reactivation of Ras can be observed after it declines to a minimum, suggesting that symmetry breaking is strongly severed in the absence of and Ric8 diffusion.
These two simulations suggest that the two sources of signal amplification are equally important: The imbalanced sequestration of is sabotaged in the absence of diffusion and asymmetrical recruitments of Ric8 is destroyed in the absence of Ric8 diffusion. Therefore, the symmetry breaking phase collapses in either cases due to deficiency of signal amplification.
Our model reveals the importance of Ric8 in amplifying the signal at the level of Ras by regulating G2 cycling: on one hand, it amplifies RasGEF activation at the front by reactivating ; on the other hand, it amplifies activation by redistributing G2 between the front and the rear of the cell.
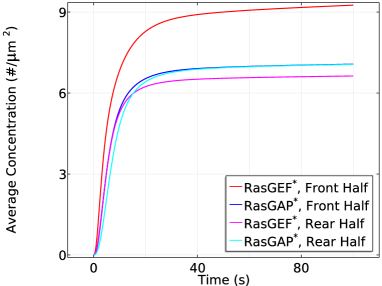
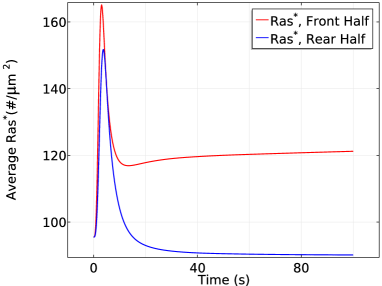
Figure 32: Time course of average and (left), and (right) in a cAMP gradient defined by nM and = 1nM in the absence of apparent diffusion. 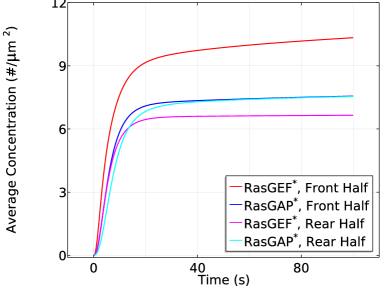
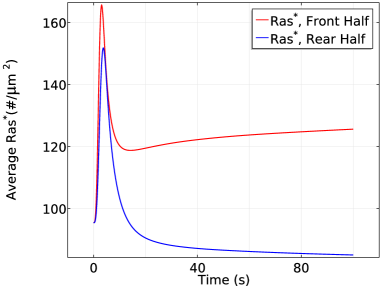
Figure 33: Time course of average and (left), and (right) in a cAMP gradient defined by nM and = 1nM in the absence of apparent Ric8 diffusion. -
•
Slow G and RasGEF diffusion
We also tested the cell response when both and RasGEF diffusion are absent (see Fig. 34). Because there is no diffusion, the activity of is stronger at the front of the cell. Meanwhile, the supply of RasGEF and facilitated asymmetrical recruitment of RasGEF is limited since RasGEF diffusion is absent. Therefore, we observe a higher activity at the rear of the cell even though the cAMP gradient is opposite.
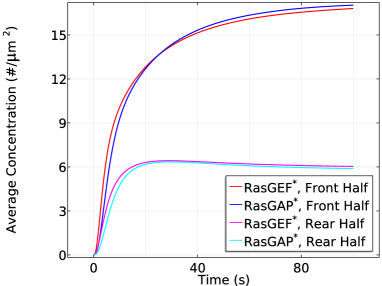
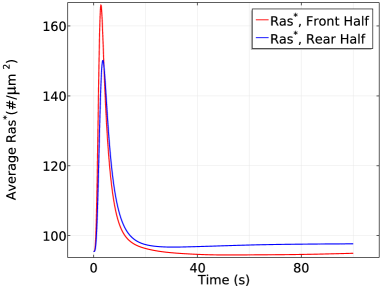
Figure 34: Time course of average and (left), and (right) in a cAMP gradient defined by nM and = 1nM in the absence of apparent Gβγ and RasGEF diffusion.
Robustness of the G-G-Ric8 triangle
A schematics of the different modes is shown in Fig. 35, which illustrates the importance of Gβγ amd Gα.
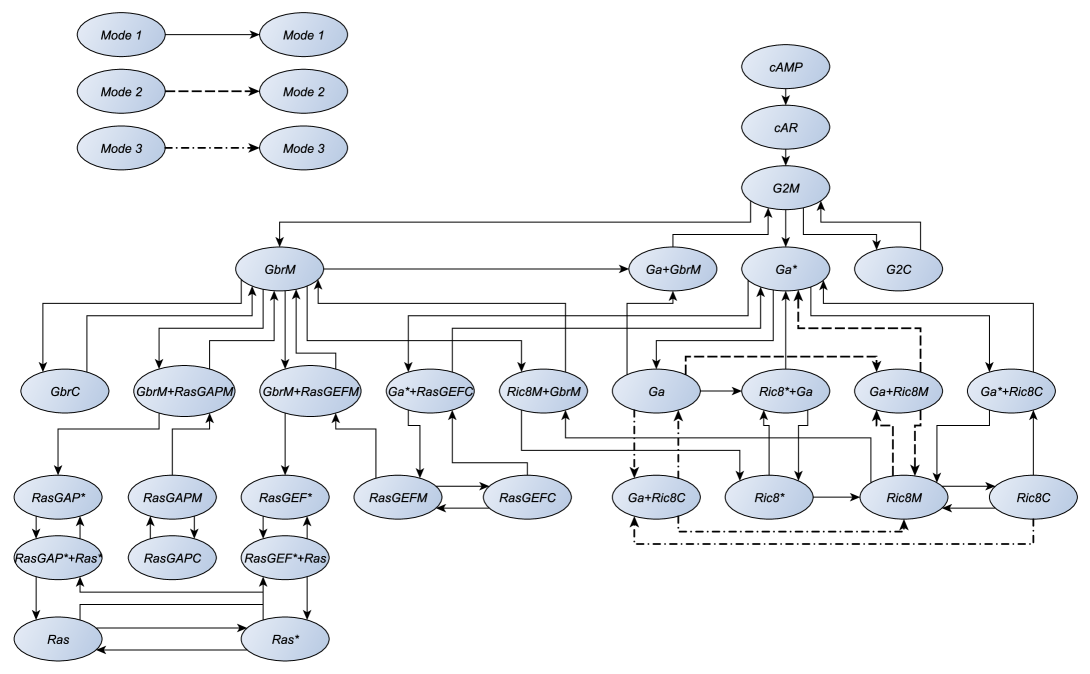
Components end with M represents membrane species and components end with C represents cytosolic species. Gbr: Gβγ; Ga: Gα.
We tested three gradients in Mode 2 and the simulation results are illustrated in Fig. 36 and Fig. 37.
Left: nM and nM. Center: nM and nM. Right: nM and nM.
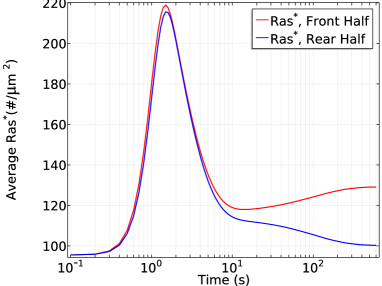
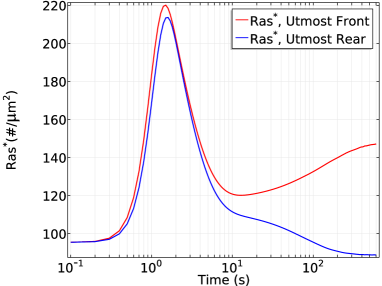
Fig. 36 and Fig. 37 demonstrate that Mode 2 still capture the basic characteristics of Ras activation, almost the same as Mode 1 except the magnitudes are slightly changed. This suggests that the robustness of the network and activation is not an essential step.
Next, we test the possibility that Membrane recruitment of Ric8 is promoted by (Mode 3). The results are illustrated in Fig. 38 and Fig. 39. These plots suggest that the cell is still able to sense direction and exhibit biphasic responses under various cAMP gradients. They differ from the plots in Mode 1 and Mode 2 in the sense the point Ras activity equilibrates quicker and the magnitudes of the symmetry breaking are smaller.
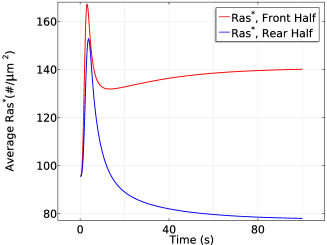
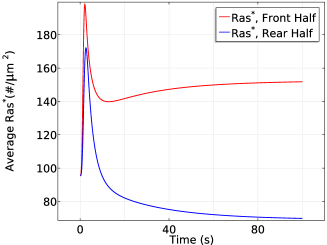
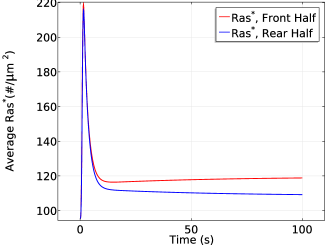
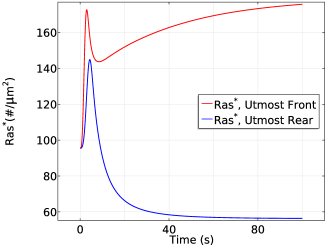
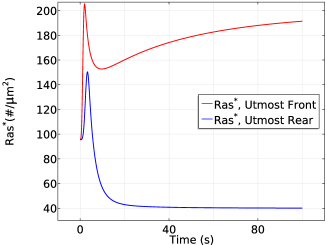
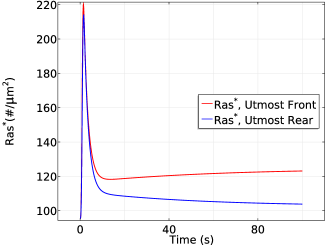
Left: nM and nM. Center: nM and nM. Right: nM and nM.
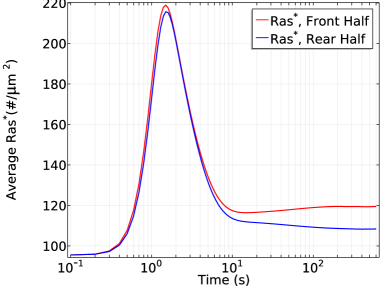
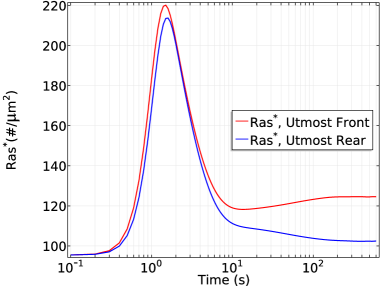
Reaction Rates
The reactions considered in signal transdution are mostly bimolecular reactions:
and we model the reaction rate as
where is the reaction rate and represent the concentrations of A and B.
Reactions on the membrane and membrane-cytosol translocation are expressed in the form
| (12) |
To model this kind of reactions in a realistic way, we first write the full dynamics
then the full dynamics can be described by
| (13) | |||||
| (14) | |||||
| (15) | |||||
| (16) |
Now we assume that fast relaxation to a steady state for the intermediate enzyme-substrate complexes is achieved,
Hence
Therefore,
Then we have
and
| (17) | |||||
| (18) | |||||
| (19) |
Denote
we obtain the reaction rate of (12)
| (20) |
Parameter estimation
We first show that a spatially lumped model can be derived by mean approximation of the generic reaction diffusion system. The spatially lumped model will be used to analyse the adaptation of Ras activity under uniform stimulation.
Define the mean concentration of a given species in the cytosol to be
where is the volume of the cytosol, or the volume of the cell.
Integrating both sides of the reaction diffusion equation, we obtain by the divergence theorem,
| (21) | |||||
in which the average reaction rates are defined as
Substitute the boundary conditions into (21), we have
| (22) |
If we assume that and are space invariant, (22) can be simplified as
| (23) |
where is the surface area of the cell membrane. If the cell has a spherical shape, then
Since the membrane diffusion is small compared to diffusion in the cytosol, we omit the membrane diffusion for simplicity, and similarly, define the mean concentration of a given species on the membrane to be
and integrate both sides of the translocation reaction equation, we obtain
| (24) | |||||
where
If we assume the parameters and the concentrations on the membrane are spatially invariant, the parameters in the spatially distributed model and the spatially lumped model are identical in the sense that
Through mean approximation, we obtain a spatially lumped model consisting of equations in the form (22) and (24).
Now we explain how we the parameters are estimated using the spatially lumped model and steady state analysis (SSA). The spatially lumped model for the G protein module is given by
| (25) | ||||
| (26) | ||||
| (27) | ||||
| (28) | ||||
| (29) | ||||
| (30) | ||||
| (31) | ||||
| (32) | ||||
| (33) |
At steady state, from (26), we have
It is reported in [44] that roughly 30% of the heterotrimeric G protein is in the cytosol, hence
This is true at all stimulus level. When no stimulus presents, we have
Also,
[44] measures the recovery rate for the G proteins in fluorescence recovery after photobleaching (FRAP) was independent of the amount of bleached area with a half-time of approximately 5 seconds. Hence we estimate , which value is also assigned for , , and .
It is reported in [42], half of the G protein dissociates at cAMP concentration . Assume represents the ratio of quantities of and at this cAMP concentration level, then by (30), we have
We speculate that Gβγ,m dissociates from the membrane with the same rate of G, , and then can be calculated. In the numerical simulations we assign .
From conservation of G protein, at cAMP concentration, we have
| (34) |
and
| (35) |
Note that
we have
| (36) |
| (37) |
which leads to
| (38) |
Also, from (36),
| (39) |
Moreover, from (32), we have
| (40) |
| (41) |
Substitute (40) and (41) into (39), we obtain a equation consisting of , and ,
| (42) |
By conservation of total Ric8 and (38), we have
from which we have
| (43) |
Substitute (43) and (38) into (42), we obtain a equation of , which can be simplified into a quadratic equation
| (44) |
where
and
Finally, by solving (44), we have
Then we can calculate backward to get , and estimate
Imperfect adaptation
The spatially lumped model for the RasGTPase module is given by
| (45) | ||||
| (46) | ||||
| (47) | ||||
| (48) | ||||
| (49) | ||||
| (50) | ||||
| (51) |
At steady states, we have
From the conservation law for RasGEF,
we obtain
| (52) |
Similarly, from steady states and conservation of RasGAP, we have
Then
We impose
and
then there exists perfect adaptation when . But when ,
which means adaptation can not be perfect.
To determine the values of and , we use steady state of equation (46)
If a partition of and is determine, we can calculate based on . In the numerical simulation, we choose the ratio as
the same as G2 partition without further information. The simulation results do not change significantly by varying this ratio.
We assign based on a measurement of PTEN dissociation rate in [80]. We speculate that PTEN and RasGEF and RasGAP share similar time constants, since no explicit values for RasGEF and RasGAP dissociation are available.
To ensure Ras is activated when Gβγ both activates and , we require
In the simulation, we choose . Varying this value would only change the peak value of Ras activation.
Note that when , perfect adaptation gives us
In simulation we assign the ratio of and as , whose value does not alter the system behaviors.
References
- 1. Albert B, Johnson A, Lewis J, Raff M, Roberts K, Walter P. Molecular Biology of The Cell. 4th ed. New York and London: Garland Science; 2002.
- 2. Christensen ST, Leick V, Rasmussen L, Wheatley DN. Signaling in unicellular eukaryotes. Int Rev Cytol. 1998;177:181–253.
- 3. Schneider L, Cammer M, Lehman J, Nielsen SK, Guerra CF, Veland IR, et al. Directional Cell Migration and Chemotaxis in Wound Healing Response to PDGF-AA are Coordinated by the Primary Cilium in Fibroblasts. Cell Physiol Biochem. 2010;25:279–292.
- 4. Wood W, Faria C, Jacinto A. Distinct mechanisms regulate hemocyte chemotaxis during development and wound healing in Drosophila melanogaster. J Cell Bio. 2006;173:405–416.
- 5. Eisenbach M. Chemotaxis. Imperial College Press; 2004.
- 6. Kolaczkowska E, Kubes P. Neutrophil recruitment and function in health and inflammation. Nat Rev Immunol. 2013;13:159–175.
- 7. Bravo-Cordero JJ, Hodgson L, Condeelis J. Directed cell invasion and migration during metastasis. Curr Opin Cell Biol. 2012;24:277–283.
- 8. Artemenko Y, Lampert TJ, Devreotes PN. Moving towards a paradigm: common mechanisms of chemotactic signaling in Dictyostelium and mammalian leukocytes. Cell Mol Life Sci. 2014;71:3711–3747.
- 9. Swaney KF, Huang CH, Devreotes PN. Eukaryotic chemotaxis: a network of sinaling pathways ccontrols motility, directional sensing, and polartiy. Annu Rev Biphys. 2010;39:265–289.
- 10. Li L, Cox EC, Flyvbjerg H. ’Dicty dynamics’: Dictyostelium motility as persistent random motion. Phys Biol. 2011;8. 046006.
- 11. Parent C, Devreotes PN. A cell’s sense of direction. Science. 1999;284:765–770.
- 12. Othmer H, Schaap P. Oscillatory cAMP signaling in the development of Dictyostelium discoideum. Comments on Theoretical Biology. 1998;5:175–282.
- 13. Charest PG, Firtel RA. Big roles for small GTPases in the control of directed cell movement. Biochem J. 2007;401:377–390.
- 14. Sasaki AT, Chun C, Takeda K, Firtel RA. Localized Ras signaling at the leading edge regulates PI3K, cell polarity and directional cell movement. The Journal of Cell Biology. 2004;167:505–518.
- 15. Nichols JME, Veltman D, Kay RR. Chemotaxis of a model organism: progress with Dictyostelium. Curr Opin Cell Biol. 2015;36:7–12.
- 16. Kolsch V, Charest PG, Firtel RA. The regulation of cell miotility and chemotaxis by phospholipid signaling. J Cell Sci. 2008;121:551–559.
- 17. Jowhar D, Janetopoulos C. The Chemotactic Compass. In: Romeralo M, Baldauf S, Escalante R, editors. Dictyostelids: Evolution, Genomics and Cell Biology. Springer Publishing; 2013. .
- 18. Charest PG, Firtel RA. Feedback signalling controls leading-edge formation during chemotaxis. Curr Opin Genet Dev. 2006;16:339–347.
- 19. Kortholt A, Keizer-Gunnink I, Kataria R, Haastert PJM. Ras activation and symmetry breaking during Dictyostelium chemotaxis. J Cell Sci. 2013;126:4502–4513.
- 20. Huang CH, Tang M, Shi C, Iglesias PA, Devreotes P. An excitable signal integrator couples to an idling cytoskeletal oscillator to drive cell migration. Nat Cell Biol. 2013;15:1307–1316.
- 21. Nakajima A, Ishihara S, Imoto D, Sawai S. Rectified directional sensing in long-range cell migration. Nat Commun. 2014;5. 5367.
- 22. Skoge M, Yue H, Erickstad M, Bae A, Levine H, Groisman A, et al. Cellular memory in eukaryotic chemotaxis. Proc Natl Acad Sci. 2014;111:14448–14453.
- 23. Iglesias PA, Devreotes P. Navigating through models of chemotaxis. Curr Opin Cell Biol. 2008;20:35–40.
- 24. Iglesias PA. Chemoattractant signaling in Dictyostelium: Adaptation and amplification. Cell Biology. 2012;5. Pe8.
- 25. Levchenko A, Iglesias PA. Models of eukaryotic gradient sensing: application to chemotaxis of amoebae and neutrophils. Biophys J. 2002;82:50–63.
- 26. Levine H, Kessler DA, Rappel WJ. Directional sensing in eukaryotic chemotaxis: a balanced inactivation model. Proc Natl Acad Sci USA. 2006;103:3639–3644.
- 27. Takeda K, Shao D, Adler M, Charest PG, Loomis WF, Levine H, et al. Incoherent feedforward control governs adaptation of activated Ras in a eukaryotic chemotaxis pathway. Cell Biology. 2012;5. Ra2.
- 28. Tang Y, Othmer HG. A G protein-based model of adaptation in Dictyostelium discoideum. Math Biosci. 1994;120:25–76.
- 29. Tang M, Wang M, Shi C, Iglesias PA, Devreotes PN, Huang CH. Evolutionarily conserved coupling of adaptive and excitable networks mediates eukaryotic chemotaxis. Nat Commun. 2014;5(5175).
- 30. Kataria R, Xu X, Fusetti F, Keizer-Gunnink I, Jin T, van Haastert PJM, et al. Dictyostelium Ric8 is a nonreceptor guaine exchange factor for heterotrimeric G proteins and is important for development and chemotaxis. Proc Natl Acad Sci. 2013;110:6424–6429.
- 31. Shukla AK, Xiao K, Lefkowitz RJ. Emerging paradigms of -arrestin-dependent seven transmembrane receptor signaling. Trends Biochem Sci. 2011;36:457–469.
- 32. Evron T, Daigle TL, Caron MG. GRK2: multiple roles beyond G protein-coupled receptor desensitization. Trends Pharmacol Sci. 2012;33:154–164.
- 33. Hereld D, Vaughan R, Kim JY, Borleis J, Devreotes P. Localization of ligand-induced phosphorylation sites to serine clusters in the C-terminal domain of the Dictyostelium cAMP receptor, cAR1. J Biol Chem. 1994;269:7036–7044.
- 34. Vaughan R, Devreotes P. Ligand-induced phosphorylation of the cAMP receptor from Dictyostelium discoideum. J Biol Chem. 1988;263:14538–14543.
- 35. Caterina MJ, Devreotes P, Borleis J, Hereld D. Agonist-induced loss of ligand binding is correlated with phosphorylation of cAR1, a G protein-coupled chemoattractant receptor from Dictyostelium. J Biol Chem. 1995;270:8667–8672.
- 36. Kim J, Soede RDM, Schaap P, Valkema R, Borleis JA, Van Haastert PJM, et al. Phosphorylation of chemoattractant receptors is not essential for chemotaxis or termination of G-protein-mediated responses. J Biol Chem. 1997;272:27313–27318.
- 37. Kim JY, Borleis JA, Devreotes P. Switching of chemoattractant receptors programs development and morphogenesis in Dictyostelium: receptor subtypes activate common rresponse at different agonist concentrations. Dev Biol. 1998;197:117–128.
- 38. Johnson RL, Van Haastert PJM, Kimmel AR, Saxe CL, Jastorff B, Devreotes P. The cyclic nucleotide specificity of three cAMP receptors in Dictyostelium. J Biol Chem. 1992;267:4600–4607.
- 39. Van Haastert PJM, Dewit RJW. Demonstration of receptor heterogeneity and affinity modulation by nonequilibrium binding experiments. J Biol Chem. 1984;259:13321–13328.
- 40. Ueda M, Sako Y, Tanaka T, Devreotes P, Yanagida T. Single-molecule analysis of chemotactic signaling in Dictyostelium cells. Science. 2001;294:864–867.
- 41. Zhang N, Long Y, Devreotes P. Ggamma in dictyostelium: its role in localization of gbetagamma to the membrane is required for chemotaxis in shallow gradients. Mol Biol Cell. 2001;12:3204–3213.
- 42. Janetopoulos C, Jin T, Devreotes P. Receptor-mediated activation of heterotrimeric G-proteins in living cells. Science. 2001;291:2408–2411.
- 43. Xu X, Meier-Schellersheim M, Jiao X, Nelson LE, Jin T. Quantitative imaging of single live cells reveals spatiotemporal dynamics of mutlstep signaling events of chemoattractant gradient sensing in dictyostelium. Mol Biol Cell. 2005;16:676–688.
- 44. Elzie CA, Colby J, Sammons MA, Janetopoulos C. Dynamic localization of G proteins in Dictyostelium discoideum. J Cell Bio. 2009;122:2597–2603.
- 45. Jin T, Zhang N, Long Y, Parent CA, Devreotes P. Localization of the G protein complex in living cells during chemotaxis. Science. 2000;287:1034–1036.
- 46. Bos JL, Rehmann H, Wittinghofer A. GEFs and GAPs: critical elements in the control of small G proteins. Cell. 2007;129:865–877.
- 47. Sasaki AT, Firtel RA. Spatiotemporal regulation of Ras-GTPases during chemotaxis. Methods Mol Biol. 2009;571:333–348.
- 48. De Vries L, Zheng B, Fischer T, Elenko E, Farquhar MG. The regulator of G protein signalling family. Annu Rev Pharmacol Toxicol. 2000;40:235–271.
- 49. Berman DM, Gilman AG. Mammalian RGS proteins: barbarians at the gate. J Biol Chem. 1998;273:1269–1272.
- 50. Wilkins A, Szafranski K, Fraser DJ, Bakthavatsalam D, Muller R, Fisher PR, et al. The Dictyostelium genome encodes numerous RasGEFs with multiple biological roles . Genome Biology. 2005;6. R68.
- 51. Fukuhara S, Chikumi H, Gutkind JS. RGS-containing RhoGEFs: the missing link between transforming G proteins and Rho? Oncogene. 2001;20:1661–1668.
- 52. Hart MJ, Jiang X, Kozasa T, Roscoe W, Singer WD, Gilman AG, et al. Direct stimulation of the guanine nucleotide exchange activity of p115 RhoGEF by G13. Science. 1998;280:2112–2114.
- 53. Jackson M, Song W, Liu M, Jin L, Dykes-Hoberg M, Lin CG, et al. Modulation of the neuronal glutamate transporter EAAT4 by two interacting proteins. Nature. 2001;410:89–93.
- 54. Zheng Y. Dbl family guanine nucleotide exchange factors. Trends Biochem Sci. 2001;26:724–732.
- 55. Katanaev V, Chornomorets M. Kinetic diversity in G-protein-coupled receptor signalling. Biochem J. 2007;401:485–495.
- 56. Alon U, Surette MG, Barkai N, Leibler S. Robustness in bacterial chemotaxis. Nature. 1999;397:168–171.
- 57. Arrieumerlou C, Meyer T. A local coupling model and compass parameter for eukaryotic chemotaxis. Dev Cell. 2005;8:215–227.
- 58. Servant G, Weiner OD, Herzmark P, Balla T, Sedat JW, Bourne HR. Polarization of chemoattractant receptor signaling during neutrophil chemotaxis. Science. 2000;287:1037–1040.
- 59. Postma M, Roelofs J, Goedhart J, Loovers HM, Visser AJWG, Van Haastert PJM. Sensitization of Dictyostelium chemotaxis by phosphoinositide-3-kinase-mediated self-organizing signalling patches. J Cell Sci. 2004;.
- 60. Wang CJ, Bergmann A, Lin B, Kim K, Levchenko A. Diverse sensitivity thresholds in dynamic signaling responses by social amoebae. Science Signaling. 2012;5(213):ra17–ra17.
- 61. Huang CH, Iglesias PA. Cell memory and adaptation in chemotaxis. Proceedings of the National Academy of Sciences. 2014;111(43):15287–15288.
- 62. Goldbeter A, Koshland DE. An amplifed sensitivity arising from covalent modification in biological systems. Proc Natl Acad Sci. 1981;78:6840–6844.
- 63. Postma M, van Haastert PJ. Mathematics of experimentally generated chemoattractant gradients. In: Chemotaxis. Springer; 2009. p. 473–488.
- 64. Gong J, Grodsky JD, Zhang Z, Wang P. A Ric8/Synembryn Homolog Promotes Gpa1 and Gpa2 Activation To Respectively Regulate Cyclic AMP and Pheromone Signaling in Cryptococcus neoformans. Eukaryotic cell. 2014;13(10):1290–1299.
- 65. Eps NV, Thomas CJ, Hubbell WL, Sprang SR. The guanine nucleotide exchange factor Ric-8A induces domain separation and Ras domain plasticity in Gi1. Proceedings of the National Academy of Sciences. 2015;112(5):1404–1409.
- 66. Zhang S, Charest PG, Firtel RA. Spatiotemporal regulation of Ras activity provides directional sensing. Current Biology. 2008;18:1587–1593.
- 67. Koshland Jr DE, Goldbeter A, Stock JB. Amplification and adaptation in regulatory and sensory systems. Science. 1982;217:220–225.
- 68. Iglesias PA, Levchenko A. Modeling the cell’s guidance system. Science Signaling. 2002;2002(148):re12–re12.
- 69. Kamakura S, Nomura M, Hayase J, Iwakiri Y, Nishikimi A, Takayanagi R, et al. The cell polarity protein mInsc regulates neutrophil chemotaxis via a noncanonical G protein signaling pathway. Dev Cell. 2013;26:292–302.
- 70. Weeks G. The small GTPase superfamily. Horizon Bioscience; 2005. p. 173–210.
- 71. Moore TI, Tanaka H, Kim HJ, Jeon NL, Yi TM. Yeast G-proteins mediate directional sensing and polarization behaviors in response to changes in pheromone gradient direction. Mol Biol Cell. 2012;24:521–534.
- 72. Kimple AJ, Bosch DE, Giguere PM, Siderovski DP. Regulators of G-Protein signaling and their G substrates: promises and challenges in their use as drug discovery targets. Pharmacol Rev. 2011;.
- 73. Ramadurai S, Holt A, Krasnikov V, van den Bogaart G, A KJ, Poolman B. Lateral diffusion of membrane proteins. J Am Chem Soc. 2009;131:12650–12656.
- 74. Almeida PFF, Vaz WLC. Lateral diffusion in membranes. In: Lipowsky R, Sackmann E, editors. Structure and Dynamics of Membranes. vol. 1A. Amsterdam: Elsevier Science; 1995. p. 305–357.
- 75. Xu X, Meckel T, Brzostowski JA, Yan J, Meier-Schellersheim M, Jin T. Coupling mechanism of a GPCR and a heterotrimeric G protein during chemoattractant gradient sensing in Dictyostelium. Science Signaling. 2010;3:ra71.
- 76. Meier-Schellersheim M, Xu X, Angermann B, Kunkel EJ, Jin T, Germain RN. Key role of local regulation in chemosensing revealed by a new molecular interaction-based modmodel method. PLoS Computational Biology. 2006;2:e82.
- 77. Aoki K, Nakamura T, Inoue T, Meyer T, Matsuda M. An essential role for the SHIP2-dependent negative feedback loop in neuritogenesis of nerve growth factor-stimulated PC12 cells. J Cell Biol. 2007;177:817–827.
- 78. Ueda M, Shibata T. Stochastic signal processing and transduction in chemotactic response of eukaryotic cells. Biophys J. 2007;93:11–20.
- 79. Postma M, van Haastert PJM. A diffusion-translocation model for gradient sensing by chemotactic cells. Biophys J. 2001;81:1314–1323.
- 80. Vazquez F, Masuoka S, Sellers WR, Yanagida T, Ueda M, Devreotes P. Tumor suppressor PTEN acts through dynamic interaction with the plasma membrane. Proc Natl Acad Sci. 2006;103:3633–3638.
- 81. Chen L, Janetopoulos C, Huang YE, Iijima M, Borleis JA, Devreotes P. Two phases of actin polymerization display different dependencies on PI(3,4,5)P3 accumulation and have unique roles during chemotaxis. Mol Biol Cell. 2003;14:5028–5037.
- 82. Postma M, Roelofs J, Goedhart J, Gadella TWJ, Visser AJWG, van Haastert PJM. Uniform cAMP stimulation of dictyostelium cells Induces localized patches of signal transduction and pseudopodia. Mol Biol Cell. 2003;14:5019–5027.