Giant H nebula surrounding the starburst merger NGC 624011affiliation: Based on data collected at the Subaru Telescope, which is operated by the National Astronomical Observatory of Japan.
Abstract
We revealed the detailed structure of a vastly extended H-emitting nebula (“H nebula”) surrounding the starburst/merging galaxy NGC 6240 by deep narrow-band imaging observations with the Subaru Suprime-Cam. The extent of the nebula is 90 kpc in diameter and the total H luminosity amounts to erg s-1. The volume filling factor and the mass of the warm ionized gas are 10-4–10-5 and , respectively. The nebula has a complicated structure, which includes numerous filaments, loops, bubbles, and knots. We found that there is a tight spatial correlation between the H nebula and the extended soft X-ray-emitting gas, both in large and small scales. The overall morphology of the nebula is dominated by filamentary structures radially extending from the center of the galaxy. A large-scale bi-polar bubble extends along the minor axis of the main stellar disk. The morphology strongly suggests that the nebula was formed by intense outflows – superwinds – driven by starbursts. We also found three bright knots embedded in a looped filament of ionized gas that show head-tail morphologies in both emission-line and continuum, suggesting close interactions between the outflows and star forming regions. Based on the morphology and surface brightness distribution of the H nebula, we propose the scenario that three major episodes of starburst/superwind activities which were initiated 102 Myr ago formed the extended ionized gas nebula of NGC 6240.
Subject headings:
galaxies: active — galaxies: starburst — galaxies: interactions — galaxies: individual (NGC 6240)(catalog NGC 6240)
1. Introduction
Galaxy mergers lead to intense star formation, i.e., starburst (Mihos & Hernquist, 1994; Barnes, 1998; Schweizer, 1998; Genzel et al., 2001; Hopkins et al., 2008). The gravitational perturbations and dynamical disturbances induced by the merging process remove angular momentum from the galactic interstellar medium (ISM), The ISM thus settles into the gravitational center of the system leading to starburst (Teyssier et al., 2010; Hopkins et al., 2013). The collective effects of supernovae and stellar winds from massive stars within the starburst region drive large-scale outflows, or “superwinds” (e.g., Veilleux et al., 2005). Galaxy mergers and their successive processes, starbursts and superwinds, significantly alter the morphology, stellar population, gas content, and chemical abundance of the galaxy. Together with statistical investigations based on a large sample of mergers, detailed case studies of merging starburst galaxies provide us with important clues for understanding the above process and its impact on galaxy evolution.
NGC 6240 is a well studied merger/starburst galaxy in the local universe (; Downs et al., 1993). It has a highly disturbed morphology indicating that two spiral galaxies are in the process of colliding with each other. NGC 6240 is often considered as an ultra-luminous infrared galaxy (ULIRG) in the local universe, although its infrared luminosity ( : Sanders & Mirabel, 1996) is slightly smaller than that of the criterion for ULIRG ((8 – 1000 m) ; Lonsdale et al., 2006). This system includes double nuclei (the northern and southern nuclei; hereafter referred to as the n-nucleus and the s-nucleus) whose separation is 1 kpc. These nuclei are hard X-ray point sources suggesting that these are the colliding active galactic nuclei (AGNs) of the progenitor galaxies (Komossa et al., 2003). The s-nucleus is 3 times brighter than the n-nucleus in the 0.2–10 keV band (Komossa et al., 2003).
It is well known that a bright optical emission line nebula is associated with NGC 6240. Early studies by various authors (e.g. Heckman et al., 1987; Armus et al., 1990; Keel, 1990) suggested that this optical nebula is primarily excited by shock-heating induced by a starburst superwind. High spatial resolution Chandra observations have revealed that the central H nebula (“butterfly nebula”) is spatially coincident with the soft X-ray-emitting hot gas surrounding the double nuclei (Komossa et al., 2003; Gerssen et al., 2004).
In addition, there is a highly extended ionized gas region surrounding NGC 6240. Heckman et al. (1987, 1990) detected faint H+[N II] emission filaments extending 30 kpc from the center. Veilleux et al. (2003) revealed a more extended optical emission line nebula approximately 80 kpc in diameter. An extended hot gas nebula of NGC 6240 has also been found in soft X-rays (Komossa et al., 2003; Huo et al., 2004). A spatial correlation between the optical emission line nebula and the extended soft X-ray gas was identified by Veilleux et al. (2003). Recently, Nardini et al. (2013) showed the extent and detailed structure of the very extended (its total size reaches 100 kpc) soft X-ray-emitting gas.
Although the central region of NGC 6240 has been studied many times, the detailed structure of the extended optical emission line gas is not yet understood. Here we present the results of deep optical narrow-band imaging of NGC 6240 using the Subaru Suprime-Cam. Our deep observations are the first to reveal the detailed structure of the extended H emitting warm ionized gas surrounding this galaxy.
We assumed cosmological parameters of (, , ) = (0.705, 0.27, 0.73) (Komatsu et al., 2011) and that the luminosity distance of NGC 6240 is 107 Mpc. The linear scale at the galaxy is 492 pc arcsec-1 under this assumption.
2. Observations
| Filter ID | PSF size | SBlim aa1 fluctuation of sky flux in an aperture of 2 arcsec diameter. | Exposure |
|---|---|---|---|
| [arcsec] | [ABmag arcsec-2] | ||
| N-A-L671 | 0.88 | 27.5 | 10 600 s |
| 0.91 | 28.5 | 5 300 s | |
| 0.76 | 27.7 | 5 180 s | |
| 0.87 | 27.3 | 5 180 s |
Narrow-band H+[N II] and broad-band , , and imaging observations of NGC 6240 were made using the Suprime-Cam (Miyazaki et al., 2002) attached to the Subaru Telescope on April 30 (UT) 2014. A journal of the observations is shown in Table 1. We used the N-A-L671 narrow-band filter (Yagi et al., 2007; Yoshida et al., 2008) for H+[N II] imaging of the galaxy (). The central wavelength and full-width at half maximum (FWHM) of the transmission curve of the filter were 6712 Å and 120 Å respectively. The total exposure time was 6,000 sec for N-A-L671. The sky was clear and photometric. Seeing was 07–09 on the observing night (Table 1).
3. Data Reduction
Data reduction was carried out in a standard manner. Overscan subtraction, flat-fielding, distortion correction, sky subtraction, and mosaicking were performed with custom-made Suprime-Cam data-reduction software, nekosoft (Yagi et al., 2002). During the overscan subtraction procedure, we also conducted cross-talk correction and gain correction between the CCDs (see Yagi, 2012). We used sky flats, which had been created from a number of object frames taken during the same observing run, for the flat-fielding correction of the and band frames. For the N-A-L671 and frames, dome flat data were used for flat-fielding. We then extracted an area of 400″ 400″ (197 kpc 197 kpc) centered on the s-nucleus of NGC 6240 from each flat-fielded frame.
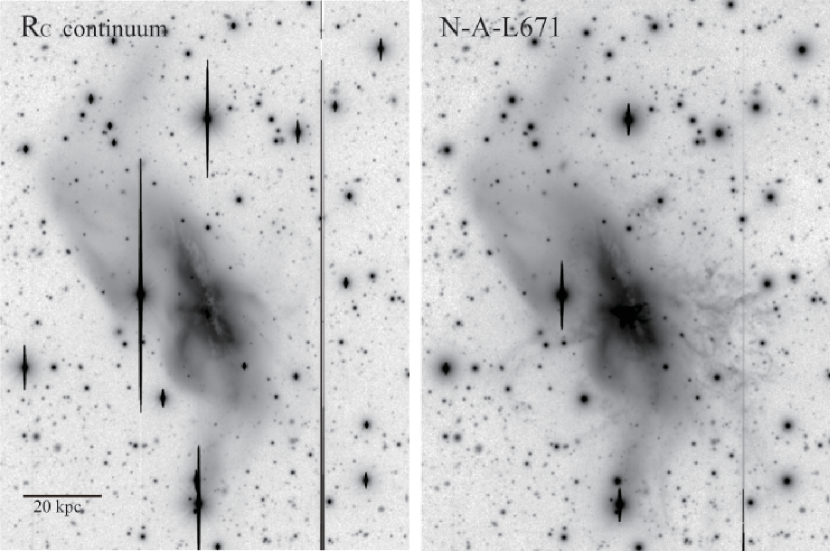
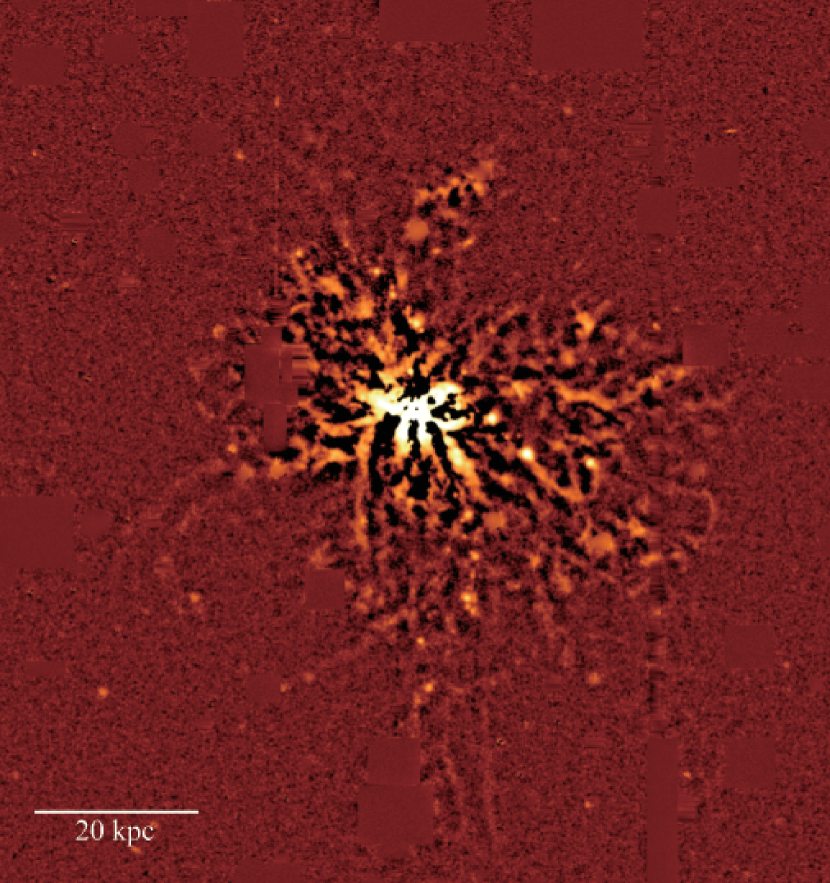
After adjusting the positions and scales, the frames for each band were combined using a 3 sigma clipping method. The flux calibration was performed using the 9th Data Release of the Sloan Digital Sky Survey (SDSS) photometric catalog (Ahn et al., 2012). The details of the flux calibration are described in Appendix A and also in Yagi et al. (2013). The FWHM of the point-spread function (PSF) was measured by fitting a two-dimensional (2D) Gaussian function to the brightness profiles of non-saturated star images for each band. The limiting surface brightness was estimated by photometry using randomly-sampled 2 arcsec apertures on the blank regions. The PSF FWHMs and limiting magnitudes of the final , , and N-A-L671 images are listed in Table 1. The reduced N-A-L671 image is shown in the right panel of Figure 1.
To obtain a net (pure) H+[N II] image of NGC 6240, we subtracted the scaled frame from the N-A-L671 frame. Scaling was performed using several unsaturated field stars common to both frames. Before subtraction, we convolved 2D double Gaussian functions to the frame to adjust the PSFs of both of the frames. After subtraction, we multiplied the net H+[N II] image by a factor of 1.23 to correct the over-subtraction of the H+[N II] flux due to the contamination of the emission lines in the frame (see Appendix B).
In addition, we subtracted the net H+[N II] that was multiplied by a factor of 0.23 from the scaled frame to create the emission-line-free frame. The emission-line-free image is shown in the left panel of Figure 1. The net H+[N II] image is shown in Figure 2 using three different contrasts.
The H+[N II] image thus created is affected by the positional variation of the emission line ratios in the nebula. We assumed constant emission line ratios over the entire region of the H nebula in the above procedure. However, it is well known that there is a tendency for the flux ratios of the forbidden lines to the H emission line to be large at larger distances from the center of NGC 6240 (Heckman et al., 1990; Keel, 1990; Veilleux et al., 2003). This causes the systematic underestimation of the net H+[N II] flux at the outer region of the nebula. In addition, the combination of the recession velocity variation of the nebula and the transmission curve of the N-A-L671 filter affects the detected H+[N II] flux. The error of the H+[N II] flux due to this effect was estimated to be 5%; the variation of the transmission of the filter is 5% in the recession velocity range of the ionized gas nebula of NGC 6240 (Heckman et al., 1990; Keel, 1990; Gerssen et al., 2004).
4. Results
4.1. Main stellar disk
The morphology of NGC 6240 in optical broad bands (e.g. band image: Left panel of Figure 1) is complicated, but there are some characteristic features in it. The bright part of the system is elongated as long as 20 kpc with a position angle (PA) of 30∘ and the clear dust lane runs along this structure. In the southeastern side of this bright feature, a “banana”-shaped tail whose PA is is connected to the center. A “S”-shaped extended faint tidal feature surrounds these bright parts of NGC 6240 (Figure 1).
From a morphological point of view, we suspect that the elongated bright part would be the remnant of the disk of the primary galaxy of this colliding system. We tried to extract the disk component from the central bright part by fitting an exponential disk to the band image. We used GALFIT (Peng et al., 2002, 2010) for profile fitting. We added four curved Srsic components to fit residuals of the exponential disk fitting. In the fitting procedure, we excluded the circular region whose radius is 3″at the center to avoid the influence of saturation and AGN components. In addition, we also excluded bright stars and blooming patterns around the galaxy.
| magnitude aaTotal magnitude (AB) of the exponential disk. | bbDisk scale length. | PA | inclination ccInclination angle of the disk. |
|---|---|---|---|
| 12.67 | 4.7 kpc | 28∘ | 62∘ |
The best fit parameters of the exponential disk are listed in Table 2. This exponential disk component dominates in the band brightness; its brightness is more than half of the SDSS band magnitude, 11.990.05 (Brown et al., 2014). The other Srsic components are 2–3 magnitude fainter than the disk, thus do not contribute to the continuum light significantly. Bland-Hawthorn et al. (1991) performed a Fabry-Perot spectroscopy of the central region of NGC 6240 and found a rotating disk component whose PA and inclination are 45∘ and 70∘, respectively. These values are roughly consistent with the parameters of the exponential disk we fitted. Thus we conclude that there still is a large stellar disk, which is probably the remnant of the primary galaxy of the merger, in the center of the system. We refer to this disk as the “main stellar disk” of NGC 6240.
4.2. Morphology of H nebula
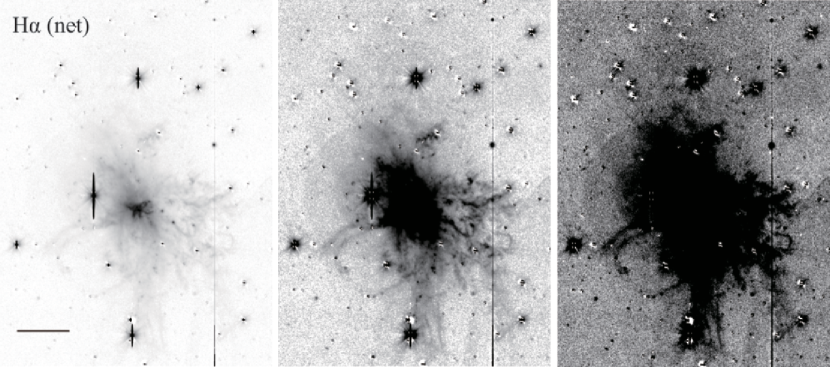
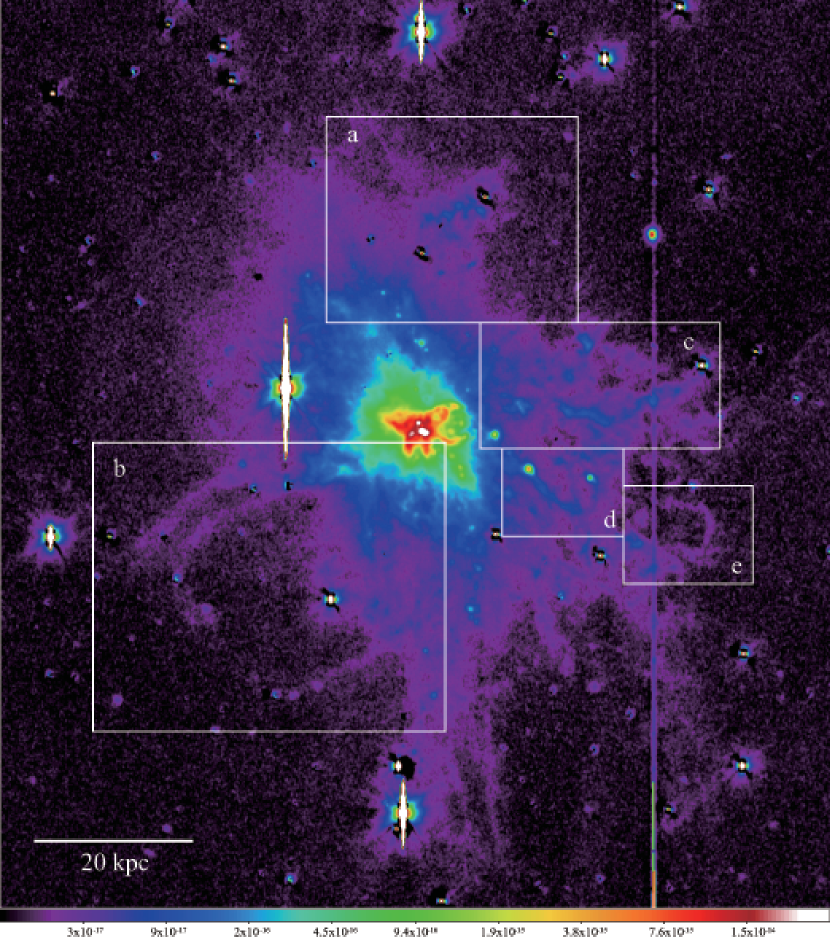
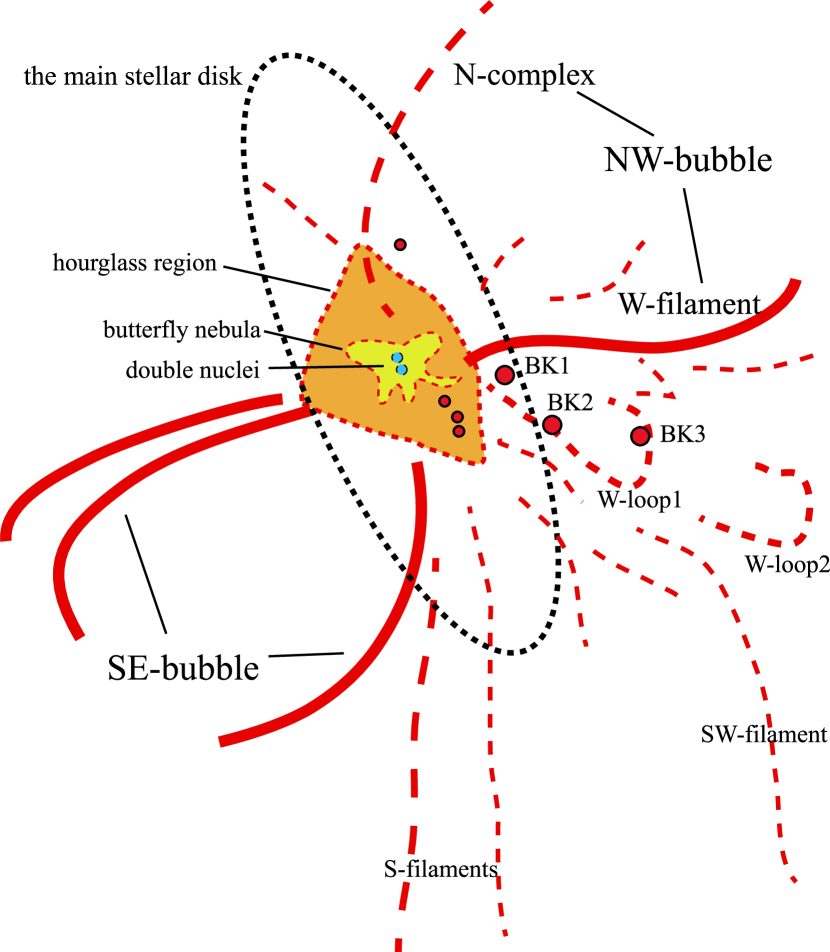
The net H+[N II] image obtained in this study revealed the rich and complex structure of the optical emission line nebula of NGC 6240 (Figures 2, 3, and 4). We refer to this nebula as the “H nebula”. The H nebula has a diameter of 90 kpc. The central “butterfly” nebula (e.g. Gerssen et al., 2004) is surrounded by a relatively bright hourglass shaped region (“hourglass region”; light blue color in Figure 3; Heckman et al. 1987). In addition to these well-known features, Veilleux et al. (2003) also detected a faint optical emission line region extending out to over 70 kpc 80 kpc around NGC 6240. Our deep Suprime-Cam observations are the first to reveal the detailed and complex structure of this extended component of the H nebula.
We applied an unsharp masking technique to the net H+[N II] image to enhance the filamentary structure of the H nebula. We first masked bright stars and blooming patterns in the H+[N II] image. Second, we smoothed the masked image with a 35 35 pixels (3.4 kpc 3.4 kpc) median filter, then subtracted the smoothed image from the masked image. The unsharp masked image is shown in Figure 5. It is clear that a number of filaments are running radially from the galactic center. A sketch of the structure of the H nebula is shown in Figure 6.
We identified several characteristic features in this nebula. In the following subsections, we describe these features in detail.
4.2.1 West filament
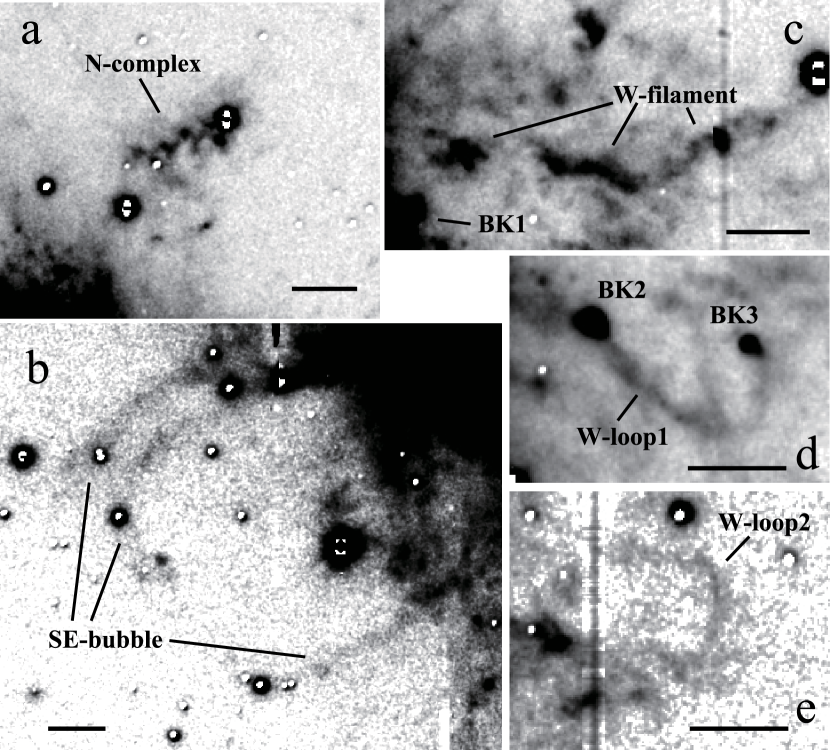
The most remarkable feature of the extended H nebula is a bright, wiggled filament (“W-filament”) in the western region. It is prominent in the middle panel of Figure 2 (see panel (c) of Figure 7 for the detailed structure). Although the W-filament was previously visible in the narrow-band H images taken by Heckman et al. (1987) and Veilleux et al. (2003), its detailed structure and surrounding complex features were only revealed in our H+[N II] image. The bright part of the W-filament begins at 18 kpc west from the s-nucleus and extends to the west-southwest. The filament turns slightly west-northwest at 25 kpc and reaches 36 kpc from the s-nucleus. There is a bright cloud to the east of the bright region of the W-filament (12 kpc west from the s-nucleus). We assume, from a morphological point of view, this could be a part of the W-filament (Figure 6).
4.2.2 Northern complex of clouds and filaments
On the northern side of the galaxy, there exists a complex of clouds and filaments (“N-complex”: Figure 6 and panel (a) of Figure 7), which extends along the PA 310∘ from 25 kpc north to 33 kpc north-northwest of the galaxy. The unsharp masked image indicates that the N-complex is the tip of a large curved structure connected to the hourglass region (Figure 5).
4.2.3 Southeastern and northwestern bubbles
A clear bubble-like structure is visible in the southeastern side of the galaxy (“SE-bubble”: Figure 6 and panel (b) of Figure 7). This faint bubble was unknown before this study. The size and PA of the SE-bubble are 28 kpc 38 kpc and 135∘, respectively. On the other side of the galaxy, the N-complex and W-filament appear to form a large broken bubble whose size is comparable to the SE-bubble (“NW-bubble”). The PA of the NW-bubble axis is approximately 40∘. The axes of these two bubbles are almost perpendicular to the major axis of the main body of NGC 6240. The opening angle of the SE-bubble and the NW-bubble is 70∘–90∘ (Figures 5 and 6).
4.2.4 Bright knots and western loops
The western side of the H nebula is much brighter and has a more complex structure than the eastern side. In particular, the W-filament and its surroundings have a rich structure consisting of many filaments and blobs.
There are several bright knots (“BK1”–“BK3”: Figure 6) located in a loop-like filament extending from the central nebula towards the southwest (“W-loop1”: Figure 6). These knots are marginally resolved in our H+[N II] image; the FWHMs of the knots are 10–11. W-loop1 extends almost straight towards the southwest from the center, then turns to the north at 23 kpc drawing a loop-like trajectory (panel (d) of Figure 7). One of the bright knots (BK3) is located at the tip of this loop.
Another loop (“W-loop2”) is located at 35 kpc from the center (panel (e) of Figure 7). The size and shape of W-loop2 are similar to those of W-loop1, but its surface brightness is much lower than that of W-loop1.
4.2.5 Southern and southwestern filaments
There are two streams extending along the north-south direction on the south side of the galaxy (“S-filaments” and “SW-filaments”: Figure 6; see also Figure 5). The S-filaments consist of several filaments extending from the center towards the south. The SW-filaments consist of a number of filaments distributed from the region close to W-loop2 to 59 kpc southwest from the s-nucleus. The extension of the S-filaments is similar to but slightly offset from that of the southern tidal feature which is the southern end of the S-shaped morphology of the optical continuum emission of NGC 6240. There is no clear optical continuum counterpart to the SW-filaments.
4.3. Physical parameters of H nebula
4.3.1 H surface brightness profile and luminosity

We performed multiple aperture photometry for the H emission of NGC 6240. We selected the region further out than 140″ (70 kpc) from the s-nucleus for sky background estimation. Before performing photometry, bright stars and artifacts were masked and interpolated by linear functions around the patterns. We adopted circular apertures whose center was the brightest point of the H+[N II] image corresponding to the s-nucleus. We excluded the very center (″) region in this aperture photometry procedure, because the band frame that was subtracted from the N-A-L671 frame to create the net H+[N II] image was saturated at the central 1″ region of the galaxy. The contamination of the [N II]6548,6583 emission was corrected assuming (Heckman et al., 1990; Keel, 1990; Veilleux et al., 2003) for the entire region of the nebula. In addition, we assumed that the foreground extinction is the same as the band Galactic extinction toward NGC 6240; = 0.165 magnitude (Schlafly & Finkbeiner, 2011).
The surface brightness profile of the H emission is given in Figure 8. It is clear that the H surface brightness distribution indicates the core-halo structure of the nebula, which is similar to the case of the soft X-ray nebula (Huo et al., 2004; Nardini et al., 2013), whereas the core is more compact in H.
The total H flux of NGC 6240 was derived by integrating the fluxes in the regions at which the H surface brightness is greater than 2 of the sky background. We assumed that the H surface brightness within the central 1″ region which we excluded in the aperture photometry is the same as that at 1″ away from the s-nucleus. As mentioned above, we assumed that for the whole region of the nebula. This ratio tends to increase toward the outer part of the H nebula, reaching 1.4 around the W-filament (Veilleux et al., 2003). Thus our method may underestimate the contribution of the [N II] emission in some parts of the nebula. However, since most of the bright regions of the nebula have almost constant (Keel, 1990; Veilleux et al., 2003), the variation of this ratio does not significantly affect the estimation of the total H flux. The resultant total H flux is 1.3 10-12 erg s-1 cm-2. The H luminosity is 1.6 1042 erg s-1.
4.3.2 Electron density, filling factor and mass
| range aaAveraging radial range. | (rms) bbNardini et al. (2013). | bbNardini et al. (2013). | (rms) ccRMS electron density of H emitting gas calculated by emission measure of the H nebula, assuming a spherical symmetric geometry of the nebula. | ||
|---|---|---|---|---|---|
| [kpc] | [cm-3] | [K] | [cm-3] | case 1) ddThe volume filling factor of H gas calculated assuming a simple thermal pressure equilibrium with and K. | case 2) eefootnotemark: |
| 0 1.7 | |||||
| 1.7 3.4 | |||||
| 3.4 7.4 | |||||
| 7.4 11 | |||||
| 11 15 | |||||
| 15 20 | |||||
| 20 27 | |||||
| 27 39 |

We derived the root mean square (rms) electron density (rms) of the H nebula assuming Case B recombination. We did not, however, apply an extinction correction to this calculation. The surface brightness of H is defined as
| (1) |
where and EM are the photon production coefficient of H in Case B recombination (Osterbrock & Ferland, 2006) and the emission measure, respectively. Assuming a fully-ionized pure hydrogen gas (; is proton density) and a constant density distribution along the line of sight, the EM can be written as , where is the line of sight length of the nebula. In the case of spherically symmetric nebula, , where and are the radius of the nebula and the projected distance from the nebula center, respectively.
The mass of the H emitting gas is given by
| (3) |
where and are the volume filling factor of the H emitting gas and the mass of a hydrogen atom, respectively.
We estimated the volume filling factor by the following procedure. First, considering the close spatial correlation between the H nebula and the soft X-ray-emitting hot gas (see section 4.4 below), we assumed that the H gas and X-ray gas are locally coexisting, Then we considered the following two cases for the coexistent state; 1) a simple thermal pressure equilibrium case and 2) a ram pressure balance case.
In the case 1), we calculated the local electron densities of the H emitting cloud assuming that the equation holds over each radial zone in which Nardini et al. (2013) provided the averaged electron densities and temperatures of the hot gas individually. Here, is the volume filling factor of the hot gas. Because the optical emission line filaments of NGC 6240 show clear shock excitation nature in its emission line ratios (Heckman et al., 1990; Keel, 1990), we assumed that K (typical temperature of optical shock excitation gas (Shull & McKee, 1979)) for all of the zones in this case.
The case 2) is the one that shock excitation is responsible for the H emission gas and X-ray emitting hot gas. We calculated the assuming the ram pressure balance equation (Spitzer, 1978), , where and are the shock velocities at the shock front between the hot gas and warm gas, respectively. The shock velocity required to produce X-ray emitting gas with a temperature of 107 K is 1000 km s-1 for an adiabatic shock (Hollenbach & McKee, 1979). Heckman et al. (1990) found that the averaged [O I]/H and [S II]6717+6731/H emission line intensity ratios of the optical filaments of NGC 6240 are 0.3 and 0.8, respectively. These values are consistent with shock models with the shock velocity 100 km s-1 (e.g., Shull & McKee, 1979). Hence, we assume that and are 1000 km s-1 and 100 km s-1, respectively.
We then derived by for the both cases. In the case 1), is given by
| (4) |
In the case 2), we obtain
| (5) |
where .
The volume filing factor is not well known, but the soft X-ray would be strongly enhanced at the upstream of the shocks in the wind (Strickland & Stevens, 2000; Cooper et al., 2008, 2009) and the of such shocked gas clouds is considerably smaller than 1. Strickland & Stevens (2000) found that the typical of the X-ray gas in a superwind is of order 10-2. Assuming that , K, and , we found that the resultant volume filling factors are orders of 10-4–10-5 for the both cases (Table 3). Although these values are much smaller than the typical of H II regions or planetary nebulae in our Galaxy (10-2–10-3; e.g. Osterbrock & Ferland, 2006), they are comparable to the derived for outflow/wind gas by the observations of nearby starburst galaxies and AGNs (Yoshida & Ohtani, 1993; Robinson et al., 1994; Cecil et al., 2001; Sharp & Bland-Hawthorn, 2010).
Under the assumption of spherically symmetric nebula, we obtained using the derived above. The spherical symmetry is, however, too simple assumption for the geometry of the emission line nebula. Hence, we next considered a more realistic geometry for the H nebula; it has a filamentary structure and the emission line filaments occupy a fraction () along the line of sight of the spherical nebula. In this case, the rms electron densities are increased by a factor of . Since we think that the X-ray gas and H gas spatially coexist, the line-of-sight occupation factor is the same for the both gas. Thus the factor vanishes in the calculation of the volume filling factor (see equations (4) and (5)). On the other hand, the total volume of the nebula is decreased by a factor of . As a result, the alters by a factor of . Then we obtained for this partly occupied filamentary nebula case.
4.4. Comparison with X-ray and UV emission
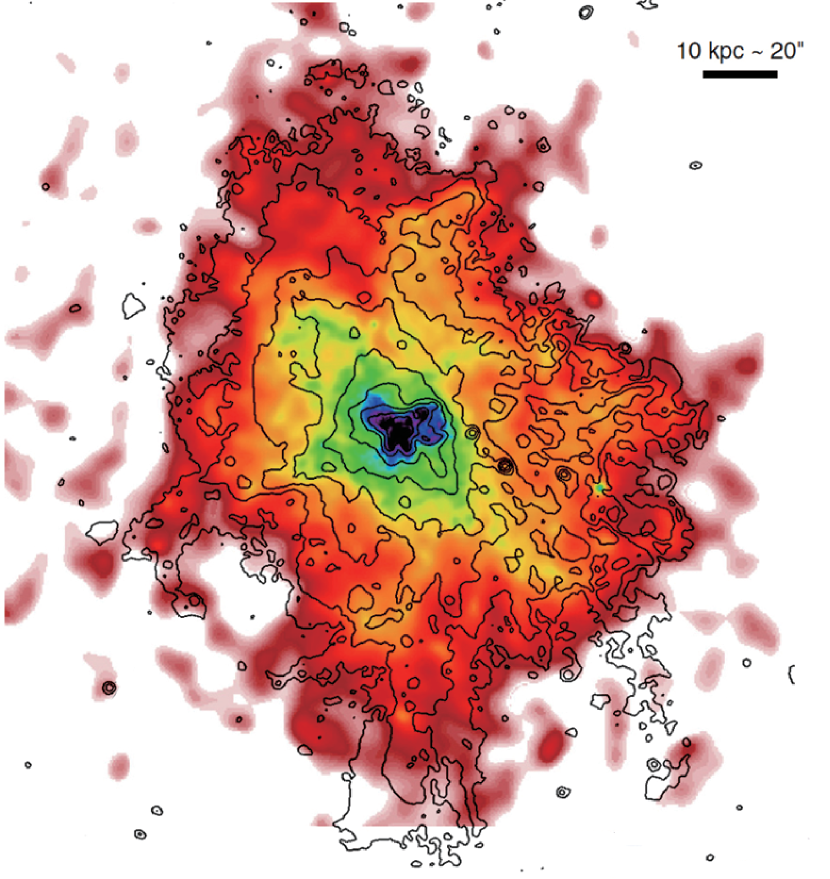
We found that the H nebula shows a very good spatial correlation with the highly extended soft X-ray-emitting hot gas nebula (Huo et al., 2004; Nardini et al., 2013), both in large and small scales. A tight spatial correlation between the H and soft X-ray is well known for the butterfly nebula of NGC 6240 (Komossa et al., 2003; Gerssen et al., 2004). The overall coincidence between the optical emission line gas and the extended soft X-ray gas of NGC 6240 has been previously pointed out by some authors (Veilleux et al., 2003; Huo et al., 2004). Our deep observations, however, allow us to make a more detailed comparison between the hot and warm phase gases.
We overlaid the contours of the H+[N II] image on the 150 ks deep soft X-ray image111This X-ray image is an “adaptively smoothed” image (Figure 4 of Nardini et al., 2013); the smoothing scale changes with the signal-to-noise ratio of the original image. See also http://chandra.harvard.edu/photo/2013/ngc6240/ngc6240_xray.jpg, and compare the jpg image with our Figure 5 to inspect the spatial correlation between the H nebula and the X-ray nebula in, more detail. taken with Chandra (Nardini et al., 2013) in Figure 10. The overall shape (a “diamond shape”) of the faint emission level of the soft X-ray image is well traced by the H+[N II] emission. On smaller scales, there are a number of common features between the X-ray and H+[N II], including the central butterfly nebula, the hourglass region, the N-complex, the SE-bubble, the W-filament, and W-loop2. There is also an indication of the counterpart of S-filaments in the X-ray image, but the southern tips of the filaments are located outside the X-ray-emitting gas. There seems to be no clear counterpart to the SW-filaments in the X-ray. A very tight spatial correlation between the warm ionized gas and the hot gas is maintained from the central region to the edge of the nebula of NGC 6240.
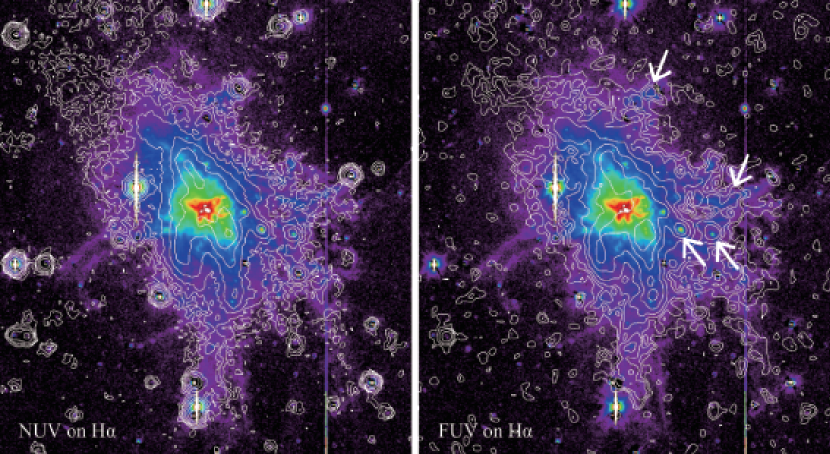
We additionally compared the H nebula image with ultraviolet (NUV and FUV) images of NGC 6240 taken with GALEX222GALEX GR6 data release: http://galex.stsci.edu/GR6/ (Figure 11). There also is a good spatial correlation between the H and the UV images, particularly in the western side of the galaxy. The western UV emission of NGC 6240 is mostly overlapped with the western complex of filaments of the H nebula. The W-filament and N-complex can be traced in the UV images (Figure 11). The bright knots (BK1 – BK3) are also visible in the UV images, and the S-filaments are well traced by the UV emission. There also are faint UV counterparts for the SW-filaments.
5. Discussion
5.1. Nature of the extended H nebula
5.1.1 Starburst-driven superwind
We found that the overall morphology of the H nebula is dominated by the radially-extended filamentary structure (Figure 5). We also identified a large-scale bi-polar bubble (SE- and NW-bubble) along with prominent loop structures (W-loop1 and 2). These morphological characteristics indicate that most of the H nebula consists of radially-outflowing gas – the starburst superwind.
The close spatial coincidence between the H nebula and the extended soft X-ray gas supports this idea. Many common features, including the SE-bubble, the N-complex, the W-filament, and W-loop2, are observed in the extended ionized gas of NGC 6240 in both H and X-ray. A similar morphological correlation between the optical emission line region and the soft X-ray gas has been widely observed in starburst galaxies (Strickland et al., 2000, 2004; Smith & Wilson, 2001; Cecil et al., 2002; Veilleux et al., 2003; Tullmann et al., 2006). Such good spatial coincidence has been interpreted as an indication that the hot and warm phase gases are heated and excited via the same mechanism – probably from shocks in the outflowing gas – over the entire region of the nebula. Numerical simulations of superwinds have supported this scenario (Strickland & Stevens, 2000; Cooper et al., 2008, 2009).
5.1.2 Star-forming bright knots
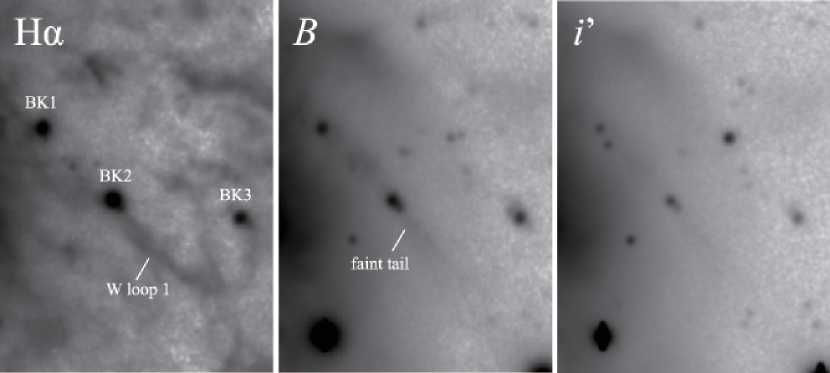
Heckman et al. (1990) obtained the optical spectra of two of the bright knots (BK1 and BK2), and found that they are active star-forming regions. Although there are no spectral data for BK3, we suggest that it is also a star-forming region because the continuum counterparts of the bright knots that show a blue color ( (AB) ) are clearly seen in our broad-band images (Figure 12)333 Although the and images in Figure 12 were not corrected for emission lines, we think that the most flux in these bands comes from the stellar continuum. In the band, there are several emission lines such as H, H and [O III]5007. We estimated that the contribution of these lines to the band flux is less than 10% assuming the ordinary Balmer decrement and / (Keel, 1990). In the band, there is no strong emission lines..
It appears that the bright knots are interacting with the outflowing filament, and the gas in the filament is intercepted by these knots, creating W-loop1. Tail-like structures are also observed in the broad-band images, in particular, the tails extending to the southwest are clearly visible in the band image (Figure 12). Indications of the tails are also marginally seen in the band image. This feature is recognizable in a Hubble Space Telescope (HST) public image of NGC 6240444 https://www.spacetelescope.org/images/potw1520a/. The head-tail morphology of the knots suggests that the outflow gas and condensed gas clouds in the main stellar disk interact with each other and that its ram pressure and/or shock may induce active star formation. The bright knots are also visible in the UV images supporting the view that these knots are the sites of active star formation. In all probability, the young stellar population observed in the tails of the bright knots was also formed by this process.
The S-filaments are well traced by the UV emission. There also are faint UV counterparts for the SW-filaments. Because these filaments have either a weak or no spatial correlation with the X-ray emission, we consider that the S- and SW-filaments are not closely related to the starburst winds. These features are more likely to be star-forming tidal tails.
5.1.3 Extended UV emission
The UV emission associated with the optical filaments may partly be the precursor emission of a shock within the nebula. The extended UV emission associated with a superwind has been observed in nearby starburst galaxies including M82 and NGC 253 (e.g. Hoopes et al., 2005). In these galaxies, most of the UV emission is thought to be from the stellar continuum scattered by dust entrained in the wind (Hoopes et al., 2005; Hutton et al., 2014), because it is too bright to be provided by shock-heated or photoionized gas in the wind. It is well-known that NGC 6240 is a dusty system, thus it is possible that the extended UV emission of NGC 6240 is mostly derived from light scattered by dust.
To estimate the contribution of dust scattering, we compared the UV intensity and H intensity at the W-filament. We measured the UV and H intensities in a 195 105 rectangular region at the W-filament (the center of the photometry region is located 54″ west and 5″ north from the s-nucleus), and determined that erg s-1 cm-2, erg s-1 cm-2, and erg s-1 cm-2 (assuming that , Veilleux et al. 2003). The average H surface brightness in this region was erg s-1 cm-2 arcsec-2. Both the and ratios – 7.4 and 3.4, respectively, – are slightly smaller than, but almost consistent with, values in the outflow filaments in M82 and NGC 253 at the same H surface brightness level (Hoopes et al., 2005). The ratios are, however, still larger than the values predicted by the shock model. This indicates that the UV emission of NGC 6240 is too bright to be attributed to shock-heated or photoionized gas emission in the wind. Thus, some part of the UV emission is possibly light scattering by dust.
Alternatively, this emission may reflect extended star-forming activity within the filaments. In this case, gas compression by the interaction of the outflowing gas and the interstellar medium in the main stellar disk may have induced star formation. Nardini et al. (2013) found that the X-ray hot gas of NGC 6240 has a spatially-uniform sub-solar metal abundance whose abundance pattern is consistent with Type-II supernova enrichment. They discussed the age of the nebula using the thermal velocity dispersion estimated from the temperature of the hot gas, and concluded that the whole NGC 6240 nebula could not be formed by the recent activity of the nuclear starburst or AGNs. They suggested that extended continuous star formation from the early phase of the merging event would be responsible for the formation of the outer nebula. The extended UV emission and its spatial coincidence with the H emission might support this scenario.
Most of the H emission of the H nebula, however, probably originates from shocks in the outflow, because the extended ionized gas shows a large [N II]/H intensity ratio ([N II]/H 1; Keel 1990; Veilleux et al. 2003). Detailed polarimetry and spectroscopy of the extended nebula are necessary to qualitatively understand the contribution of dust-scattering and local star formation to the H nebula.
5.2. Ages and durations of superwinds
| Region | Radius | aaTotal (H + X-ray) gas mass entrained and loaded by the superwinds assuming that the spherical symmetric geometry of the nebula and the volume filling factor of the X-ray gas is 0.01. is the line-of-sight occupation factor of the nebula (see text). | SFR | Age bbTimescale for the gas to reach the end of the region with a constant velocity km s-1. | Duration ccDuration of the starburst necessary to transfer the gas by superwind, where is the thermalization efficiency of the wind (see text). | |
|---|---|---|---|---|---|---|
| [kpc] | [] | [km s-1] | [ yr-1] | [Myr] | [Myr] | |
| Butterfly | 4.5 | 700 | 25 | |||
| Hourglass | 13 | 700 | 25 | |||
| Outer | 45 | 700 |
We discuss the ages and durations of the starburst superwinds of NGC 6240. From a morphological point of view, we divided the H nebula into three regions; the central butterfly nebula (Heckman et al., 1987; Keel, 1990; Lira et al., 2002; Gerssen et al., 2004), the hourglass region (Heckman et al., 1987), and the outer filaments. The characteristic radii of the three regions are 4.5 kpc, 13 kpc, and 45 kpc, respectively. We assume that these three regions were formed in the past by different starburst/superwind activities, and estimate the ages of the regions and the durations of these activities.
First, we estimate the outflow velocity of the winds and derive the dynamical ages of the regions. Heckman et al. (1990) studied the kinematics of the optical ionized gas of the central region of NGC 6240 and found that the FWHM of the H line exceeds 1000 km s-1 within 4–5 kpc from the center (see also Keel, 1990; Gerssen et al., 2004). They also found that some parts of the extended region have radial velocities of 500 km s-1. We thus adopted a value of 500 km s-1 as the line-of-sight component of the outflow velocity of the gas. Assuming that the typical inclination of the outflow is 45∘, we estimate the outflow velocity of the H nebula to be km s-1. We also assume that the outflow velocity is constant over the whole nebula. The ages of the three regions are thus 8 Myr, 24 Myr, and 84 Myr, for the butterfly nebula, the hourglass region, and the outer filaments, respectively.
Next, we estimate the durations of the superwind activities that formed the three regions based on the standard superwind model. The terminal velocity of a mass loading galactic wind is given by
| (6) |
where and are the thermalization efficiency and mass loading factor of the wind, respectively (Veilleux et al., 2005). Substituting km s-1 into the equation (6), we find . Although the exact value of is unknown and is difficult to estimate, it would be expected to lie between 0.1 and 1 (Strickland & Stevens, 2000). On the other hand, the mass-loss rate from the starburst region is scaled by the star formation rate (SFR) and given by
| (7) |
(Veilleux et al., 2005). Then the duration of the superwind is calculated by , leading to
| (8) |
where is the total mass of the wind including the loaded mass.
The SFRs are estimated as follows. Since the butterfly nebula was formed most recent star formation activities have played important roles in its formation. We found that there is a wide spread in the estimated values of the current SFR. A well-used equation for converting the far infrared luminosity to the SFR (Kennicutt, 1998), yr-1 , gives us an SFR of 120 yr-1. This value is clearly overestimated, because a significant fraction of the bolometric luminosity of NGC 6240 is known to originate from the AGNs and extended star formation other than the current nuclear starburst (Lutz et al., 2003; Engel et al., 2010; Mori et al., 2014). Engel et al. (2010) found a SFR of 25 yr-1 for the nuclear starburst based on the band luminosity. On the other hand, Beswick et al. (2001) found a SFR of 83 yr-1 based on the 1.4 GHz radio continuum observation. Engel et al. (2010) noted that the discrepancy between the above two values arises from the difference in the star formation histories they used; Beswick et al. (2001) assumed a constant star formation history over 20 Myr, whereas Engel et al. (2010) adopted a merger-induced increasing star formation scenario. The morphology of the H nebula suggests an intermittent star formation nature for the star-forming history of NGC 6240. In particular, the estimated age of the butterfly nebula is much shorter than the duration of the star formation assumed by Beswick et al. (2001). We thus adopt a SFR of 25 yr-1 for the butterfly nebula.
The age of the hourglass region estimated above (24 Myr) is almost consistent with the starburst age (15–25 Myr) estimated by Tecza et al. (2000). We thus interpret that the hourglass region was created by this starburst, and its SFR was 25 yr-1, which is the value estimated by Tecza et al. (2000) from the central red stellar population. We have no suitable observational basis for estimating the SFR for the outer filaments. Hence, for the outer filaments we tentatively assume a typical SFR from the local starburst galaxies, 10 yr-1.
The H gas masses of the three regions were determined by integrating the H gas mass in three concentric regions; 4.5 kpc, 4.5 kpc 13 kpc, and 13 kpc 45 kpc. The close morphological correlation between the H emission and soft X-ray of NGC 6240 indicates that these two-phase gases are spatially associated with each other. Therefore, the mass of the soft X-ray gas must be taken into account to derive the total mass of the superwinds . Nardini et al. (2013) estimated the total mass of the soft X-ray gas as 1010 with the assumption that the volume filling factor is almost unity and a spherically symmetric geometry of the hot gas nebula. However, this assumption is not adequate for the superwind. As we described in section 4.3.2, would be of order 10-2. In addition, we introduced the line-of-sight occupation factor to represent the filamentary structure of the nebula (see section 4.3.2). Using these factors, we calculated the total wind mass .
The ages and durations of the superwinds that formed the three regions derived by the above calculations are listed in Table 4. The duration of the superwind is approximately one order of magnitude smaller than the age of each region. This suggests that the starburst/superwind activity has an intermittent nature as suggested by numerical simulations of galaxy mergers (Mihos & Hernquist, 1996; Hopkins et al., 2006, 2013). It should be noted that the duration of the superwind for the hourglass region (4 Myr) is consistent with the starburst duration (5 Myr) estimated by Tecza et al. (2000).
In the above discussion, we ignored the AGN contribution to the wind evolution. Currently, there are double active nuclei at the center of NGC 6240 and they play a non negligible role in energetics in the central region of the galaxy (Elston & Maloney, 1990; Komossa et al., 2003; Feruglio et al., 2013). The AGNs are, however, deeply embedded and still not active enough to form the extended hot and warm gas nebula surrounding the galaxy (Sugai et al., 1997; Mori et al., 2014). Thus the most part of the nebula was probably formed by the starburst activity (Heckman et al., 1990; Keel, 1990; Nardini et al., 2013). Even in the vicinity of the nuclei, the influence of the AGNs to the surrounding excited gas region has not been clear yet (Sugai et al., 1997; Ohyama et al., 2000; Engel et al., 2010; Wang et al., 2014). Therefore, we conclude that the starburst superwind is the prime mover in forming the extended nebula and the contribution of the AGNs would be negligible except for the central region (a part of the butterfly nebula).
5.3. Starburst history of NGC 6240
NGC 6240 is thought to be in the late stages of a galaxy merger (Hopkins et al., 2006; Engel et al., 2010). Its morphology indicates that two gaseous spiral galaxies first encountered each other 1 Gyr ago and their nuclei are now in the final stages of coalescence. The H nebula was formed by intermittent starburst events which occurred within the last 100 Myr. Here, we propose a possible scenario of the starburst history of NGC 6240 from the point of view of the formation of the H nebula by starburst superwinds.
A starburst which occurred 80 Myr ago created powerful bi-polar galactic bubbles; the NW- and SE-bubbles. At that time, the ISM in the merging system might be more abundant in the northwestern and western sides of the merging galaxies than in the eastern and southeastern sides. A combination of the intermittent nature of the starburst activity and the lopsided ISM distribution formed a rich structure of loops, filaments, or blobs in the western side of the system. The extended active star formation as indicated by the UV images was also preferentially induced in the western side as the wind propagated outward from the central starburst. The bright knots observed in the western side of the system were probably formed by collisions between the high-speed outflowing gas from the center and dense gas blobs. The ram pressure of the outflow served to highly condense the gas blobs and initiated active star formation.
Approximately 20 Myr ago, a short duration starburst (4–5 Myr) occurred at the center of the system. This starburst and the subsequent superwind formed the central stellar population of NGC 6240 and the hourglass region of the H nebula.
Active star formation ceased temporarily following the short duration burst described above. Several Myr ago, the concentration of gas by the continuing approach of the two nuclei induced an intense starburst that continues to the present; and also drove AGN activity. The SFR may be steadily increasing, and has currently reached 25 yr-1 (Engel et al., 2010). This recent starburst and AGN activity formed various features including the butterfly nebula (Heckman et al., 1990; Keel, 1990; Komossa et al., 2003; Gerssen et al., 2004), the central extended hard X-ray gas (Wang et al., 2014), the molecular outflow (Tacconi et al., 1999; Nakanishi et al., 2005; Iono et al., 2007; Engel et al., 2010; Feruglio et al., 2013; Scoville et al., 2015), and the intense H2 and [Fe II] emission (Tanaka et al., 1991; van der Werf et al., 1993; Sugai et al., 1997; Ohyama et al., 2003).
6. Summary
We conducted unprecedented deep H narrow-band imaging observations of NGC 6240 using the Subaru Suprime-Cam. The 6,000-sec Suprime-Cam observation was the first to reveal the detailed structure of a highly-extended H emitting nebula (the H nebula) whose size reaches to 90 kpc in diameter. This nebula was probably formed by large-scale energetic outflows — or superwinds — driven by starburst events induced by a galaxy–galaxy merger. In addition to the butterfly-shaped inner nebula, which has already been investigated by various authors, the outer nebula has a complex structure consisting of wiggled narrow filaments, loops, bubbles, and blobs. We found a huge bi-polar bubble (the SE-bubble plus the NW-bubble), which extends along the minor axis of the main stellar disk of NGC 6240. The total H luminosity is 1.6 1042 erg s-1.
We estimated the volume filling factor of the H nebula assuming a simple thermal pressure equilibrium and a ram pressure balance between the warm ionized gas and the soft X-ray gas. The is of orders 10-4–10-5 for the both cases. We calculated the mass of the H emitting gas to be of 5 using the .
It is remarkable that the H extent and morphology are quite similar to the X-ray (0.7–1.1 keV) emitting hot gas detected with a deep Chandra observation (Nardini et al., 2013). Such a close spatial coincidence between the optical emission line nebula and the hot gas is generally observed in starburst superwinds. This strongly suggests that the same physical mechanism, shock-heating, plays an important role in the excitation of both phases of the gas at the outer regions of the H nebula.
The H nebula also has a close spatial correlation with the UV emission in the western region of the galaxy. Some bright star-forming knots are located in the western region. These facts suggest, therefore, that star-forming activity was induced by the interaction of the outflow and the ISM, and that the interaction was probably enhanced due to a lopsided gas distribution formed by the merger.
The morphology and surface brightness distribution of the H nebula suggest that there were probably three major episodes of starburst/superwind activities that formed the nebula. The most extended part of the nebula was initiated 80 Myr ago. Multiple intermittent starbursts in this era created many outflow filaments and clouds extending 40 kpc out from the center. At the same time, the outflowing gas interacted with the ISM and induced extended star formation in the main stellar disk. An intense short duration starburst then occurred 20 Myr ago, forming the hourglass region of the H nebula. NGC 6240 entered a new active phase 1 Myr ago. The galaxy is now in the final stages of the merger and its activity is increasing.
References
- Ahn et al. (2012) Ahn, C. P., et al. 2012, ApJS, 203, 21
- Armus et al. (1990) Armus, L., et al. 1990, ApJ, 364, 471
- Barnes (1998) Barnes, J. E. 1998, in Galaxies: Interaction and Induced Star Formation, Saas-Fee Advanced Course 26, ed. D. Friedli, L.Martinet, & D. Pfenniger (New York: Springer), 275
- Beswick et al. (2001) Beswick, R. J., Pedlar, A., Mundell, C. G., & Gallimore, J. F. 2001, MNRAS, 325, 151
- Bland-Hawthorn et al. (1991) Bland-Hawthorn, J., Wilson, A. S., & Tully, B. 1991, ApJ, 371, L19
- Blanton & Roweis (2007) Blanton, M. R., & Roweis, S. 2007, AJ, 133, 734
- Brown et al. (2014) Brown, M. J. I, et al. 2014, ApJS, 212, 18
- Cecil et al. (2001) Cecil, G., Bland-Hawthorn, J., Veilleux, S., & Filippenko, A. V. 2001, ApJ, 555, 338
- Cecil et al. (2002) Cecil, G., Bland-Hawthorn, J., & Veilleux, S. 2002, ApJ, 576, 745
- Cooper et al. (2008) Cooper, J. L., Bicknell, G. V., Sutherland, R. S., & Bland-Hawthorn, J. 2008, ApJ, 674, 157
- Cooper et al. (2009) Cooper, J. L., Bicknell, G. V., Sutherland, R. S., & Bland-Hawthorn, J. 2009, ApJ, 703, 330
- Downs et al. (1993) Downes, D., Solomon, P. M., & Radford, S. J. E. 1993, ApJ, 414, L13
- Elston & Maloney (1990) Elston, R., & Maloney, P. 1990, ApJ, 357, 91
- Engel et al. (2010) Engel, H., et al. 2010, A&A, 524, A56
- Feruglio et al. (2013) Feruglio, C., et al. 2013, A&A, 549, A51
- Genzel et al. (2001) Genzel, R., Tacconi, L. J., Rigopoulou, D., Lutz, D., & Tecza, M. 2001, ApJ, 563, 527
- Gerssen et al. (2004) Gerssen, J., et al. 2004, AJ, 127, 75
- Heckman et al. (1987) Heckman, T. M., Armus, L., & Miley, G. K. 1987, AJ, 92, 276
- Heckman et al. (1990) Heckman, T. M., Armus, L., & Miley, G. K. 1990, ApJS, 74, 833
- Hollenbach & McKee (1979) Hollenbach, D., & McKee, C. F. 1979, ApJS, 41, 555
- Hoopes et al. (2005) Hoopes, G. G., et al. 2005, ApJ, 619, L99
- Hopkins et al. (2006) Hopkins, P. F., et al. 2006, ApJS, 163, 1
- Hopkins et al. (2008) Hopkins, P. F., et al. 2008, ApJS, 175, 356
- Hopkins et al. (2013) Hopkins, P. F., et al. 2013, MNRAS, 433, 78
- Huo et al. (2004) Huo, Z. Y., Xia, X. Y., Xue, S. J., Mao, S., & Deng, Z. G. 2004, ApJ, 611, 208
- Hutton et al. (2014) Hutton, S., et al. 2014, MNRAS, 440, 150
- Iono et al. (2007) Iono, D., et al. 2007, ApJ, 659, 283
- Keel (1990) Keel, W. C. 1990, AJ, 100, 356
- Kennicutt (1998) Kennicutt, R. C. 1998, ApJ, 498, 541
- Komatsu et al. (2011) Komatsu, E., et al. 2011, ApJS, 192, 18
- Komossa et al. (2003) Komossa, S., et al. 2003, ApJ, 582, L15
- Gerssen et al. (2004) Gerssen, J., et al. 2004, AJ, 127, 75
- Lira et al. (2002) Lira, P., Ward, M. J., Zezas, A., & Murray, S. S. 2002, MNRAS, 333, 709
- Lonsdale et al. (2006) Lonsdale, C. J., Farrah, D., & Smith, H. E. 2006, Astrophysics Update 2 (Chichester: Praxis), 285
- Lutz et al. (2003) Lutz, D., et al. 2003, aap, 409, 867
- Mihos & Hernquist (1994) Mihos, J. C. & Hernquist, L. 1994, ApJ, 437, L47
- Mihos & Hernquist (1996) Mihos, J. C. & Hernquist, L. 1996, ApJ, 464, 641
- Miyazaki et al. (2002) Miyazaki, S., et al. 2002, PASJ, 54, 833
- Mori et al. (2014) Mori, T., et al. 2014, PASJ, 66, 93
- Nakanishi et al. (2005) Nakanishi, K., et al. 2005, PASJ, 57, 575
- Nardini et al. (2013) Nardini, E., et al. 2013, ApJ, 765, 141
- Ohyama et al. (2000) Ohyama, Y., et al. 2000, PASJ, 52, 563
- Ohyama et al. (2003) Ohyama, Y., Yoshida, M., & Takata, T. 2003, AJ, 126, 2291
- Osterbrock & Ferland (2006) Osterbrock, D. E. & Ferland, G. J. 2006, Astrophysics of Gaseous Nebulae and Active Galactic Nuclei (Sausalito, CA: Univ. Sci.)
- Peng et al. (2002) Peng, C. Y., Ho, L. C., Impey, C. D., & Rix, H. -W. 2002, AJ, 124, 266.
- Peng et al. (2010) Peng, C. Y., Ho, L. C., Impey, C. D., & Rix, H. -W. 2010, AJ, 139, 2097.
- Robinson et al. (1994) Robinson, A., et al. 1994, A&A, 291, 351
- Rupke, Veilleux & Sanders (2005) Rupke, D. S., Veilleux, S., & Sanders, D. B. 2005, ApJS, 160, 87
- Sanders & Mirabel (1996) Sanders, D. B. & Mirabel, I. F. 1996, ARA&A, 34, 749
- Schlafly & Finkbeiner (2011) Schlafly, E. F. & Finkbeiner, D. P. 2011, ApJ, 737, 103
- Scoville et al. (2015) Scoville, N., et al. 2015, ApJ, 800, 70
- Schweizer (1998) Schweizer, F. 1998, in Galaxies: Interaction and Induced Star Formation, Saas-Fee Advanced Course 26, ed. D. Friedli, L.Martinet, & D. Pfenniger (New York: Springer), 105
- Sharp & Bland-Hawthorn (2010) Sharp, R. G. & Bland-Hawthorn, J. 2010, ApJ, 711, 818
- Shull & McKee (1979) Shull, J. M., & McKee, C. F. 1979, ApJ, 227, 122
- Smith & Wilson (2001) Smith, D. A. & Wilson, A. S. 2001, ApJ, 557, 180
- Spitzer (1978) Spitzer, L. 1978, Physical Processes in the Interstellar Medium (New York: Wiley-Interscience)
- Strickland & Stevens (2000) Strickland, D. K. & Stevens, I. R. 2000, MNRAS, 314, 511
- Strickland et al. (2000) Strickland, D. K., Heckman, T. M., Kimberly, A. W., & Dahlem, M. 2000, AJ, 120, 2965
- Strickland et al. (2004) Strickland, D. K., Heckman, T. M., Colbert, J. M., Hoopes, C. G., & Weaver, K. A. 2004, ApJS, 151, 193
- Sugai et al. (1997) Sugai, H., Malkan, M., Ward, M., Davies, R., & McLean, I. 1997, ApJ, 481, 186
- Tacconi et al. (1999) Tacconi, L. J., et al. 1999, ApJ, 524, 732
- Tanaka et al. (1991) Tanaka, M., Hasegawa, T., & Gatley, I. 1991, ApJ, 374, 516
- Tecza et al. (2000) Tecza, M., et al. 2000, ApJ, 537, 178
- Teyssier et al. (2010) Teyssier, R., Chapon, D., & Bournaud, F. 2010, ApJ, 720, L149
- Tullmann et al. (2006) Tullmann, R., Pietsch, W., Rossa, J., Breitschwerdt, D., & Dettmar, R.-J. 2006, A&A, 448, 43
- van der Werf et al. (1993) van der Werf, P. P., et al. 1993, ApJ, 405, 522
- Veilleux et al. (2003) Veilleux, S., Shopbell, P. L., Rupke, D. S., Bland-Hawthorn, J., & Cecil, G. 2003, AJ, 126, 2185
- Veilleux et al. (2005) Veilleux, S., et al. 2005, 43, 769
- Wang et al. (2014) Wang, J., et al. 2014, ApJ, 781, 55
- Yagi et al. (2002) Yagi, M., et al. 2002, AJ, 123, 66
- Yagi et al. (2007) Yagi, M., et al. 2007, ApJ, 660, 1209
- Yagi (2012) Yagi, M. 2012, PASP, 124, 1347
- Yagi et al. (2013) Yagi, M., et al. 2013, PASJ, 65, 22
- Yoshida & Ohtani (1993) Yoshida, M. & Ohtani, H. 1993, PASJ, 45, 407
- Yoshida et al. (2008) Yoshida, M., et al. 2008, ApJ, 688, 918
Appendix A A. Color conversion from SDSS to the Suprime-Cam filter system
We adopted a color conversion from SDSS to the Suprime-Cam filter system with HPK CCDs as
| (A1) |
where the coefficients and the color range of the stars are given in Table 5. The coefficients are estimated using the method given in Yagi et al. (2013), with the model quantum efficiency curve of the CCDs.
We used stars of magnitude in SDSS DR9. The K-correct (Blanton & Roweis, 2007) v4 offset for SDSS555http://howdy.physics.nyu.edu/index.php/Kcorrect was applied; 0.012, 0.010 and 0.028 for , , and , respectively. The number of stars is approximately 60 - 200, and the estimated rms error around the best fit ranged from 0.05 to 0.07.
| SDSS-Suprime | SDSS color | range | ||||||||
|---|---|---|---|---|---|---|---|---|---|---|
| 0.070 | 0.881 | … | … | |||||||
| 0.006 | 0.312 | 1.601 | 9.992 | |||||||
| 0.020 | 0.536 | 0.021 | … | … | … | |||||
| 0.089 | 0.019 | … | … | … | … |
Appendix B B. Correction of the contaminated emission line flux for the net H+[N II] image
The use of the scaled frame as an off-band frame leads an over-subtraction of the continuum, because the H+[N II] emission is non-negligibly contaminated in the scaled frame. The optical emission line nebula of NGC 6240 primarily consists of shock-heated gas (e.g. Heckman et al., 1990; Keel, 1990), thus the [O I]6300 and [S II]6717,6731 lines must also contribute towards contaminating the emission line flux in the frame. Assuming that the emission line intensity ratio is constant over the whole region of the nebula, we can write the H+[N II] flux in the net H+[N II] frame as
| (B1) |
where is the contamination factor in the frame, is the H+[N II] flux uncorrected for over-subtraction of line emission from the frame, and is that corrected for this effect. Here, we assumed that the filter transmissions are the same for all the emission lines, for simplicity. We then derived the scaling factor in the following equation by subtracting the net H+[N II] frame multiplied by from the scaled frame so that the central butterfly nebula component disappears in the subtracted frame,
| (B2) |
Equations (B1) and (B2) give . We found that the best scaling factor was 0.23. Thus the correction factor for the H+[N II] flux of the net H+[N II] image is 1.23.