This is the accepted manuscript version of the following article:
Meyer, S., Warnke, I., Rössler, W., and Held, L. (2016).
Model-based testing for space-time interaction using point processes:
An application to psychiatric hospital admissions in an urban area.
Spatial and Spatio-temporal Epidemiology 17, 15–25,
which has been published in final form at
http://dx.doi.org/10.1016/j.sste.2016.03.002.
Model-based testing for space-time interaction using point processes:
An application to psychiatric hospital admissions in an urban area
Abstract
Spatio-temporal interaction is inherent to cases of infectious diseases and occurrences of earthquakes, whereas the spread of other events, such as cancer or crime, is less evident. Statistical significance tests of space-time clustering usually assess the correlation between the spatial and temporal (transformed) distances of the events. Although appealing through simplicity, these classical tests do not adjust for the underlying population nor can they account for a distance decay of interaction. We propose to use the framework of an endemic-epidemic point process model to jointly estimate a background event rate explained by seasonal and areal characteristics, as well as a superposed epidemic component representing the hypothesis of interest. We illustrate this new model-based test for space-time interaction by analysing psychiatric inpatient admissions in Zurich, Switzerland (2007–2012). Several socio-economic factors were found to be associated with the admission rate, but there was no evidence of general clustering of the cases.
keywords:
Spatio-temporal point process, Knox test, Mantel test, Space-time -function, Global test of clustering, Psychiatric inpatient admissions1 Introduction
Cases of infectious diseases naturally exhibit spatio-temporal interaction. Once an individual becomes infected, it may cause secondary cases by transmitting the infectious agent to susceptible individuals. If the force of infection triggered by an infectious individual decreases with time and distance, cases are likely to appear in spatio-temporal clusters, i.e., cases which are close in time tend to also be close in space. This contagion goes beyond any purely spatial clustering in densely populated areas or seasonal forcing. Spatio-temporal clustering can be observed in other fields as well, for example, seismology (Ogata, 1998), veterinary epidemiology (Ward and Carpenter, 2000), cancer epidemiology (Birch et al., 2000; Gustafsson and Carstensen, 2000), criminology (Grubesic and Mack, 2008; Johnson, 2010), and transportation research (Eckley and Curtin, 2013).
The spread of various mental health indicators in local social networks has been analysed: suicide (Haw et al., 2013), happiness (Fowler and Christakis, 2008), depression (Rosenquist et al., 2011), and even autism (Liu et al., 2010). Usually, this spread occurs within a short time period and in geographically close living areas. For hospital admissions of patients with mental disorders, previous studies have found associations with local socio-economic factors such as unemployment rate, average income, proportion of one-person households, proportion of foreigners, or level of urbanisation (see, e.g., Simone et al., 2013). However, to the best of our knowledge, space-time clustering of psychiatric hospital admissions has not been investigated so far, i.e., if admissions close in time are also close in space with respect to where the patients live. The idea is similar to the spread of rumours (Daley and Gani, 1999, Chapter 5), where here the rumour is the news that someone in the neighbourhood searches professional psychiatric treatment. For mentally stricken citizens, such news could lower help-seeking barriers, whereas people with a treatment history might remember own positive experiences by the knowledge about others’ hospital admissions.
The first statistical significance test for “low intensity epidemicity” is due to Knox (1963, 1964), who investigated space-time interaction of cases of cleft lip and palate. Several variations of his test have since been developed, for example, by generalizing the test statistic as a measure of correlation of spatial and temporal closeness (Mantel, 1967), or by replacing Euclidean distances by nearest neighbours (Jacquez, 1996). An enhanced version of the Knox statistic derived from point process theory is the spatio-temporal -function by Diggle et al. (1995). This approach enables a formal definition of the null hypothesis of no space-time interaction as a process with independent spatial and temporal components. However, these classical tests do not account for spatial or temporal inhomogeneity, e.g., variations in population density or seasonal effects, and are thus prone to bias (Kulldorff and Hjalmars, 1999; Mack et al., 2012).
Second-order characteristics of spatio-temporal point processes, such as the -function, have recently been generalized to the inhomogeneous case (Gabriel and Diggle, 2009; Møller and Ghorbani, 2012). In practice, adjusting the -function for spatial or temporal inhomogeneity requires a two-step procedure. The crucial first step is to obtain estimates of the spatial and temporal intensity functions. As in “empirical” point process models (Diggle, 2013, Chapter 12; Diggle et al., 2005), non-parametric kernel methods are commonly employed. Supplied with area-level data on relevant socio-economic factors, we will instead analyse interaction of events using a mechanistic spatio-temporal point process model. Such models are especially attractive if covariates can explain part of the heterogeneity in the observed point pattern, or if there is an explicit formulation of how past events affect the evolution of the process. For instance, mechanistic models have recently been applied to a range of epidemic phenomena, including residential burglaries (Mohler et al., 2011), infectious disease occurrence (Meyer et al., 2012), invasive plant species (Balderama et al., 2012), and epidemics among dolphins (Morris et al., 2015).
We propose to embed the test for space-time interaction of events in the endemic-epidemic point process regression framework of Meyer et al. (2012), which is implemented in the open-source R package surveillance (Meyer et al., 2016). The basic model formulation borrows from both the Epidemic-Type Aftershock-Sequences (ETAS) model (Ogata, 1998) and the multivariate time-series model for infectious disease counts proposed by Held et al. (2005). While the endemic model component reflects background heterogeneity due to, e.g., population structure and seasonality, the epidemic component makes the process “self-exciting” and causes spatio-temporal interaction. The basic idea of the proposed model-based test is to assess the evidence for an epidemic component with a Monte Carlo permutation approach (Besag and Diggle, 1977).
This paper is organized as follows: Section 2 briefly reviews the two most popular classical tests for space-time interaction, the Knox and the Mantel tests, as well as the space-time -function. The new test procedure via an endemic-epidemic point process model is introduced in Section 3. In Section 4, we apply the various tests to psychiatric hospital admissions in the city of Zurich (Switzerland), 2007–2012, and the supplementary material shows corresponding results for the invasive meningococcal disease data originally analysed by Meyer et al. (2012). Section 5 concludes the paper and A lists the software used to perform the analyses.
2 Classical approaches to testing for space-time interaction
Given a point pattern with spatial coordinates and time points observed in a region during a period , classical tests for space-time interaction basically check if events closer in time also tend to be closer in space. How closeness is measured varies between the different tests, but many use the form of test statistic put forward by Mantel (1967),
| (1) |
where and are measures of the spatial and temporal adjacency of the events and , respectively (Marshall, 1991). These measures are often defined as a function of the respective Euclidean distances and . Larger values of support the (one-sided) alternative hypothesis of positive association between spatial and temporal adjacency.
The distribution of under the null hypothesis of no space-time interaction is determined by a Monte Carlo permutation approach (Besag and Diggle, 1977). In each of , say, replications, the test statistic is computed for a random permutation of the time labels while holding the locations fixed. This destroys any systematic space-time interaction in the data but leaves both the marginal spatial and temporal distributions unchanged. The (one-sided) -value for a positive association between spatial and temporal adjacency (i.e., clustering) is then obtained as the proportion of test statistics greater than or equal to the observed one. The smallest attainable -value from this Monte Carlo procedure thus is (the “resolution”).
In the following subsections, we outline the various choices of adjacency measures employed by three different tests. For a broader overview of space-time interaction tests and references to applications we point to Tango (2010, Chapter 7) and Mack et al. (2012, Section 2).
2.1 Knox test
For the Knox test, critical distances in space () and time () have to be specified to yield a categorization of the distances into “close” vs. “not close”. The test statistic is then defined as the number of event pairs close both in space and time according to these distance thresholds:
| (2) |
If the point pattern exhibits clustering at the predefined spatio-temporal scales, the observed number of close pairs will be larger than the expected number under the null hypothesis of no space-time interaction.
The Knox test is appealing through simplicity but criticized for the subjectivity in specifying and . It is thus often applied over a range of critical distances (Grubesic and Mack, 2008).
2.2 Mantel test
Mantel (1967) elaborates on the general use of the test statistic (1) with any suitable distance measures for the application at hand. This includes the indicator functions of the Knox test, raw or transformed Euclidean distances such as (to collapse the range of large distances), but also other distance measures like travel time. An often used standardized version of Mantel’s test statistic is the Pearson correlation between the spatial and temporal distances of all event pairs, i.e.,
| (3) |
where the and symbols denote the respective sample means and standard deviations of the pairwise distances. Note that the standardized Mantel test statistic formulated in Jacquez (1996, Section 1.2), Ward and Carpenter (2000, Section 2.1), and Mack et al. (2012, Section 2.2) does not exactly correspond to the Pearson correlation (3) as used in this paper and in many open-source software packages implementing the Mantel test.111 We have inspected the R packages ecodist, vegan, and ade4 (all available at http://CRAN.R-project.org/), as well as the python packages PySAL (http://pysal.org/) and scikit-bio (https://github.com/biocore/scikit-bio/).
Unlike the Knox test, the standardized Mantel test does not require the specification of distance thresholds. However, it assesses a linear relationship between spatial and temporal distances, which might not be appropriate over the whole distance range (the clustering is expected to occur towards the origin in a plot of spatial against temporal distance). The reciprocal transformation of the pairwise distances suggested by Mantel (1967) would then again depend on the choice of a suitable constant to avoid division by zero.
2.3 Space-time -function analysis
The space-time -function essentially interprets the Knox statistic (2) as a function of the critical distances and while accounting for edge effects (Diggle et al., 1995). For stationary point processes, the -function is proportional to the expected number of further events occurring within distance and time of an arbitrary event (Diggle, 2013, Chapters 10 and 11). An approximately unbiased estimator of the -function is
| (4) |
where and are edge-correction weights (Diggle et al., 1995, Section 3). Note that this estimator is proportional to the Knox statistic (2) if the weights all equal unity. Similar estimators and exist for the purely spatial and temporal component processes, respectively. The test statistic is then derived from the property that the spatio-temporal -function factorizes into the component -functions under the null hypothesis of no space-time interaction. Specifically,
| (5) |
has an expectation of zero for any given thresholds and . Diggle et al. (1995) recommend a perspective plot of the surface to gain more insight into the relevant scales of spatio-temporal interaction than the previous tests. An omnibus test over a set of spatial and temporal scales is obtained by
| (6) |
and evaluating statistical significance by the common Monte Carlo permutation approach.
This test is used far less frequently than the Knox or Mantel tests, since a (polygonal) representation of the observation region is required in addition to the event times and locations to compute the edge-correction weights, which also needs specialized software. Some studies such as McNally et al. (2006) have used a simplification of this test procedure towards an omnibus Knox test by ignoring the edge-correction weights.
3 Model-based assessment of space-time interaction
The classical Knox and Mantel tests have the advantage of working solely on the observed event times and locations without the need for additional data. In practice, however, the question of space-time interaction is often accompanied by questions of how the event rate varies over time or space, how far the events interact, or if specific events trigger a higher amount of clustering. To address these issues, we propose to embed the test for space-time interaction in a regression framework for spatio-temporal point patterns of epidemic phenomena (Meyer et al., 2012; Meyer and Held, 2014).
3.1 Spatio-temporal point process model
The considered spatio-temporal point process model describes the conditional intensity for an event at location and time (given the history of the process) by a superposition of an endemic and an epidemic component:
| (7) | ||||
The endemic component reflects the background rate of new events (cases) as explained by the offset , usually population density, and effects of other local and/or time-varying characteristics in the log-linear predictor . Here the spatial and temporal indices refer to the regions and periods across which the covariates are collected, e.g., a district week grid. Interpretation of the stand-alone endemic model component is thus straightforward since it is equivalent to a Poisson regression model for the aggregated number of events across the cells of the chosen grid (Meyer et al., 2016, Section 3.1). Note that this data-driven formulation leads to a piecewise constant endemic intensity, which – depending on the chosen grid and the underlying event-generating process – may not be a maintainable simplification.
The second, observation-driven epidemic component adds “infection pressure” from the set of past events and thus causes spatio-temporal interaction. During its infectious period of length and within its spatial interaction radius , the model assumes each event to trigger secondary cases at a rate proportional to a predictor of event marks . The typical decay of infection pressure with increasing spatial and temporal distance from the infective event is modelled by parametric interaction functions and , respectively (Lawson and Leimich, 2000, Section 4). Depending on the application at hand, these could simply be assumed constant, or, e.g., a power-law distance decay for could be chosen to reflect human travel behaviour on larger scales (Meyer and Held, 2014). The (possibly infinite) upper bounds and provide a way of modelling event-specific interaction ranges, but since these have to be specified a common assumption is and .
The spatio-temporal point process model (7) corresponds to a branching process with immigration, where part of the event rate is due to the endemic (immigration) component reflecting sporadic cases caused by unobserved sources of infection. The expected number of offspring an event generates according to the “triggering function” can thus be interpreted as a model-based effective reproduction number. This number is obtained as the integral of the triggering function over the observed interaction period and region , where denotes the disc centered at with radius .
3.2 Testing for epidemic behaviour
A standard option to assess if the process at hand shows epidemic behaviour is a likelihood ratio test between the full model and the corresponding endemic-only model. The associated test statistic is , where is the maximized likelihood of the endemic-only model given the observed point pattern, and the corresponding likelihood of the full model with an epidemic component. Originally, Meyer et al. (2012) used a log-link for the epidemic predictor, i.e., , in which case the null hypothesis of an endemic-only model with is on the boundary of the parameter space (Self and Liang, 1987). Using the identity link for avoids this problem and allows for the model to represent an inhibition process with a negative epidemic intensity (as long as at all and at all events ).
However, the likelihood ratio test is still non-standard since parameters of the interaction functions and are not identifiable under the null hypothesis . More importantly, we will see that including an epidemic component can improve the fit for reasons other than pure presence of space-time interaction — if the data provide evidence against the piecewise constant endemic intensity. For these reasons, we will determine the null distribution of the test statistic by a Monte Carlo permutation approach just as for the classical significance tests described in Section 2. Note that this is only valid for models with a separable endemic intensity, i.e., independent spatial and temporal background processes. For each of random relabelings of the event times, the full model and the endemic-only model have to be re-estimated to determine the test statistic for the permuted point pattern. We perform the test conditionally on the estimated interaction functions and to avoid identifiability issues for permuted data with a naturally low epidemic intensity, and to drastically reduce the computational burden (the point process likelihood requires the integration of over , see Meyer et al., 2016, Section 3.1).
An advantage of the permutational approach is that we can replace the likelihood ratio statistic with a more accessible quantity, for example the reproduction number described above. Since the expected number of offspring implied by the point process model (7) is event-specific, we use
| (8) |
as a basic effect size, i.e., the estimated number of secondary cases triggered by an event with during an infectious period of length within a surrounding region of radius .
4 Psychiatric hospital admissions in Zurich, 2007–2012
We now investigate contagion of psychiatric hospital admissions in an urban catchment area using the tests for space-time interaction described in Sections 2 and 3. The spread of the news about a psychiatric hospital admission is thereby assumed to be most likely in close neighbourhood of the patient’s residence within a short period of time. Specifically, we assume a maximum interaction radius of metres and an infectious period of days starting from admission. For the main hypothesis, we make no distinction with respect to the patients’ diagnoses. However, since contagion might be restricted to a specific subset, we also apply the tests to admissions of the two main diagnostic subgroups separately: schizophrenia (ICD-10 F2x) and affective disorders (F3x).
The following section describes the spatio-temporal point pattern of hospital admissions and the additional socio-economic data to be adjusted for in the point process model. Subsequently, the classical and model-based tests for space-time interaction are applied, followed by a discussion of the results.
4.1 Materials
4.1.1 Case reports
We use data of inpatient episodes from the central register of the university hospital of psychiatry (PUK) in Zurich, Switzerland, from the years 2007 to 2012. The catchment area of the PUK includes about 450 000 to 500 000 inhabitants. The PUK is one of six psychiatric institutions which serve a defined catchment area in the canton of Zurich and which treat the whole spectrum of mental health problems. The PUK covers almost 40% of the treatment episodes of these institutions.
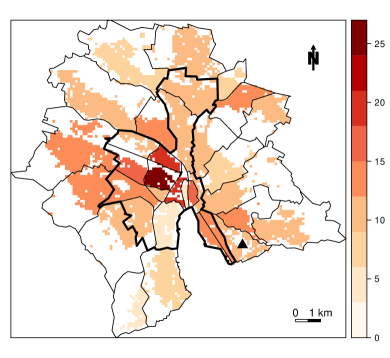
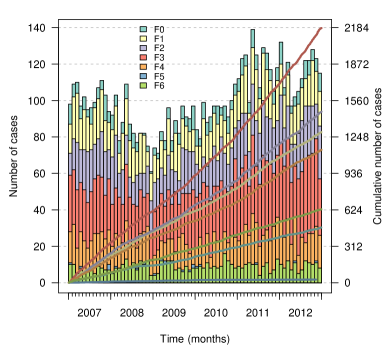
In total the PUK has registered 23 290 admissions of 12 280 different patients during the years 2007–2012. The patient’s entry date defines the event time , and the geographic coordinates of the patient’s residence in metre units define the corresponding event location . We include all voluntary admissions of adult patients living in the city of Zurich at the time of admission, where the primary diagnosis (as qualified at discharge) is in the range F0x–F6x. Of these 10 320 records, we exclude all admissions without proper coordinate information (e.g., unknown/ambiguous address, homeless patients), and all re-admissions within 14 days (to not infer self-infections). The remaining sample to analyse consists of 7 202 admissions of 4 498 patients. Figure 1 shows the quarter-wise number of patients per 1 000 inhabitants as well as the monthly number of admissions.222 Ethical approval for this study was obtained from the ethics committee of the Canton of Zurich, provided that the data will only be published in adequately aggregated form. The F2 and F3 subsets contain 1 465 (856) and 2 180 (1 602) admissions (patients), respectively.
4.1.2 Population
The Swiss Federal Statistical Office provided us with population data of the city of Zurich on a (i.e., 1 hectare) grid with a total of 392 435 inhabitants. With these data, the observation region of the point process can be defined as the populated area of Zurich (the shaded area in Figure LABEL:fig:pukepi1). Using the population-based observation region is more adequate than administrative boundaries, which also encompass the large unpopulated areas of the surrounding hills where no events can occur.
4.1.3 Quarter-specific socio-economic data
Socio-economic characteristics of Zurich’s 34 quarters were provided by the Statistics Office of the city of Zurich. Some of the variables were available on a yearly basis but there was not much variation across the years. We thus consistently use the data of the year 2010, which is also the year where most of the time-constant data has been collected as part of that year’s census. The following socio-economic characteristics are used: proportion of foreigners, proportion aged 40 to 64 years, proportion of one-person households, employment rate (proportion employed among the population aged 15 years and over), proportion of inhabitants with minimum (obligatory) education, and mean yearly income per taxpayer. Summary statistics for these quarter-level variables are given in Table 1. An extra indicator variable was constructed from land use statistics to distinguish between urban and rural quarters: each of the inner urban quarters, i.e., those surrounded by a thick line in Figure LABEL:fig:pukepi1, has more than 40% of its area occupied by buildings and infrastructure and less than 2% forest area.
| Min. | 1st Qu. | Median | Mean | 3rd Qu. | Max. | |
|---|---|---|---|---|---|---|
| % Foreigners | 20.1 | 26.0 | 29.4 | 29.9 | 34.4 | 41.0 |
| % 40–64 years | 26.0 | 29.4 | 31.4 | 31.8 | 33.8 | 41.4 |
| % One-person households | 12.1 | 20.2 | 23.4 | 23.8 | 26.4 | 39.1 |
| Employment rate | 54.6 | 62.4 | 66.1 | 66.8 | 71.2 | 83.2 |
| % Low-level education | 14.0 | 19.9 | 31.8 | 29.2 | 38.3 | 47.0 |
| Mean income (in 1000 CHF) | 35.0 | 40.8 | 46.2 | 47.1 | 54.0 | 69.5 |
4.1.4 Density of psychiatrists by city district
The number of psychiatric practices by city district (decomposing Zurich into 12 larger subregions) was obtained from the medical society of the canton of Zurich. To make use of this information when modelling the endemic risk at the smaller quarter level, the number was transformed to a density per hectare of populated district area. This density is then assumed to hold for all quarters of the corresponding district. It ranges from 0.003 to 0.437 practices per hectare. Aggregated over the whole populated area of Zurich, there are 0.08 psychiatric practices per hectare.
4.2 Classical significance tests
Table 2 shows the contingency tables underlying the conducted Knox tests. The associated -values are 0.79 (all cases), 0.93 (F2), and 0.81 (F3), respectively, suggesting no evidence for space-time interaction at the predefined scales, neither in the overall sample nor within the main diagnoses subgroups.
| km apart | |||
|---|---|---|---|
| days apart | 0.25 | 0.25 | |
| 14 | 2 408 | 346 953 | 349 361 |
| 14 | 179 271 | 25 402 169 | 25 581 440 |
| 181 679 | 25 749 122 | 25 930 801 | |
| km apart | |||
|---|---|---|---|
| days apart | 0.25 | 0.25 | |
| 14 | 119 | 14 388 | 14 507 |
| 14 | 9 774 | 1 048 099 | 1 057 873 |
| 9 893 | 1 062 487 | 1 072 380 | |
| km apart | |||
|---|---|---|---|
| days apart | 0.25 | 0.25 | |
| 14 | 214 | 32 564 | 32 778 |
| 14 | 16 156 | 2 326 176 | 2 342 332 |
| 16 370 | 2 358 740 | 2 375 110 | |
The standardized Mantel tests yield -values (Pearson correlations given in parentheses) of 0.092 (), 0.13 (), and 0.88 (), respectively. The correlations between spatial and temporal distances are generally very small and even negative for the subgroup of affective disorders. Hence, the Mantel test also yields no evidence for space-time interaction.
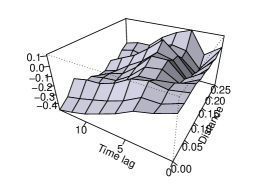
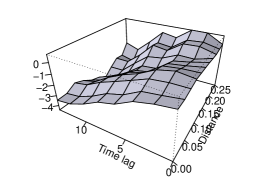
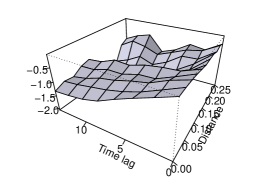
Figure 2 shows perspective plots of from Equation (5), evaluated on an equidistant grid covering the distance range 0 to 250 metres and the time lags 0 to 14 days, respectively. For an infectious process one would expect an excess number of “close” cases compared to an interaction-free process. However, this excess as measured by is negative for most interaction ranges and generally decreases with the time lag . The omnibus test (6) based on 999 random permutations of the event times yields -values of 0.94 (all cases), 0.98 (F2 cases), and 0.99 (F3 cases), respectively, all indicating absence of evidence for space-time interaction.
4.3 Endemic-epidemic point process model
To simultaneously estimate effects of local socio-economic characteristics on the admission rate and investigate additional space-time interaction of the cases, we formulate the following endemic-epidemic point process model:
| (9) |
The endemic model component accounts for the spatially varying population density and socio-economic characteristics . Additionally, we account for the quarter’s distance to the PUK’s quarter (1 for directly adjacent quarters, 2 for second-order neighbours, and so forth), and include an indicator function for weekends and holidays on which fewer admissions are registered (no scheduled admissions). By the epidemic component, each case is assumed to cause a local increase of in the event rate during days in the neighbourhood of metres around its residence.
Fitting this model to the point pattern of all 7 202 admissions takes only 1.3 seconds on an ordinary laptop running at 2.80GHz. The goodness of fit can be evaluated using residual analysis methods for space-time point processes (Clements et al., 2011). Spatial pixel residuals (integrated over time) can help to identify regions with considerably more or less cases than explained by the model (Figure LABEL:fig:pukfit_residuals_quadrats). The distribution of the transformed residual process in Figure LABEL:fig:pukfit_residuals_time suggests that the estimated intensity (integrated over space) provides a good description of the temporal point pattern.
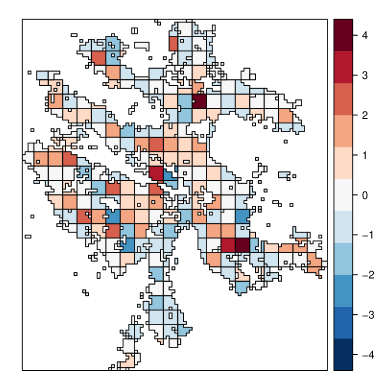
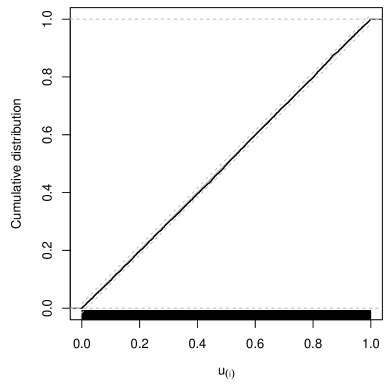
Table 3 presents the rate ratio estimates for the endemic effects of model (9). The event rate increases with the proportion of foreigners, inhabitants aged 40 to 64 years, one-person households, adults employed, and people with minimum education level. It tends to be lower in quarters with a higher mean income and is reduced by 62% during weekends and holidays. There is no evidence for further geographic effects as reflected by the urban indicator, the distance to the PUK and the density of psychiatric practices.
| RR | 95% CI | p-value | |
|---|---|---|---|
| Urban quarter | 0.991 | 0.91 to 1.08 | 0.84 |
| Distance to PUK | 0.983 | 0.96 to 1.01 | 0.16 |
| % Foreigners | 1.018 | 1.01 to 1.02 | 0.0001 |
| % 40–64 years | 1.084 | 1.07 to 1.10 | 0.0001 |
| % One-person households | 1.032 | 1.02 to 1.04 | 0.0001 |
| Employment rate | 1.014 | 1.01 to 1.02 | 0.0011 |
| % Low-level education | 1.025 | 1.02 to 1.03 | 0.0001 |
| Mean income (in 1000 CHF) | 0.991 | 0.98 to 1.00 | 0.021 |
| Psychiatric practices / ha | 1.071 | 0.67 to 1.71 | 0.78 |
| Weekend/Holiday | 0.379 | 0.35 to 0.41 | 0.0001 |
The triggering rate is estimated to be , which corresponds to secondary cases within 14 days and 250 metres. The likelihood ratio statistic for , i.e., comparing the endemic-only to the full model, is . Although the goodness of fit improves considerably with the epidemic component, the permutation test reveals that this improvement does not reflect true space-time interaction. Figure 4 shows the null distribution of from 199 data sets with permuted event times and thus no space-time interaction by construction. A large proportion of the permuted data sets has a value of higher than estimated for the real data. This is in agreement with the results from the classical significance tests in that there is no evidence for epidemicity of psychiatric hospital admissions.
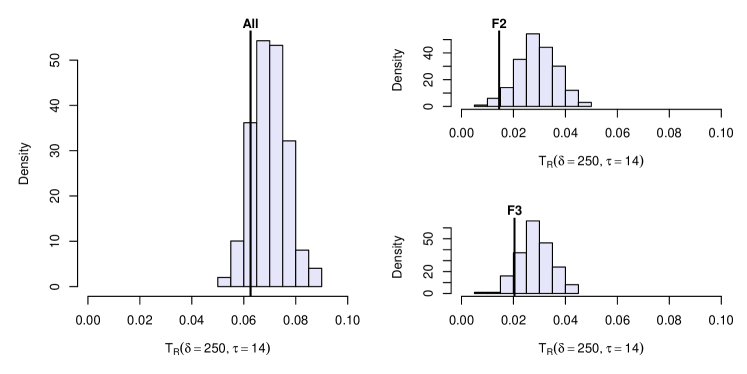
Running the permutation test on the F2 and F3 subsets yields -values of 0.97 and 0.90, respectively. The estimated rate ratios of the endemic effects are displayed in Table 4 and are generally similar in direction and order of magnitude as in the overall model (Table 3). There is a stronger negative association of the event rate with the distance to the PUK, i.e., quarters further apart tend to have a lower rate of admissions (given identical socio-economic characteristics). For the subset of patients with affective disorders, there is no evidence of effects of mean income, proportion of foreigners, and employment rate on the quarter’s admission rate, which is, however, estimated to be 19% higher in inner urban quarters than in outer quarters with otherwise similar characteristics.
| F2 cases | F3 cases | |||||
|---|---|---|---|---|---|---|
| RR | 95% CI | p-value | RR | 95% CI | p-value | |
| Urban quarter | 0.852 | 0.71 to 1.03 | 0.094 | 1.188 | 1.02 to 1.38 | 0.023 |
| Distance to PUK | 0.947 | 0.90 to 1.00 | 0.035 | 0.927 | 0.89 to 0.97 | 0.0003 |
| % Foreigners | 1.010 | 1.00 to 1.03 | 0.17 | 1.003 | 0.99 to 1.01 | 0.61 |
| % 40–64 years | 1.140 | 1.10 to 1.18 | 0.0001 | 1.050 | 1.02 to 1.08 | 0.0012 |
| % One-person households | 1.049 | 1.03 to 1.07 | 0.0001 | 1.026 | 1.01 to 1.04 | 0.0003 |
| Employment rate | 1.021 | 1.00 to 1.04 | 0.029 | 1.006 | 0.99 to 1.02 | 0.40 |
| % Low-level education | 1.035 | 1.02 to 1.05 | 0.0001 | 1.024 | 1.01 to 1.04 | 0.001 |
| Mean income (in 1000 CHF) | 0.970 | 0.95 to 0.99 | 0.0002 | 0.996 | 0.98 to 1.01 | 0.59 |
| Psychiatric practices / ha | 1.045 | 0.38 to 2.88 | 0.93 | 1.052 | 0.48 to 2.32 | 0.90 |
| Weekend/Holiday | 0.505 | 0.44 to 0.58 | 0.0001 | 0.354 | 0.31 to 0.40 | 0.0001 |
4.4 Discussion of the results
This observational study shows several quarter-level socio-economic characteristics to be associated with the hospital admission rate. Similar to previous studies suggesting that psychiatric disorders are more frequent in socially deprived areas (Reijneveld and Schene, 1998; Chaix et al., 2006; Sundquist and Ahlen, 2006), lower education and lower income were associated with an increased hospital admission rate. However, the finding that a higher employment rate is (weakly) associated with an increased admission rate is contradictory to previous results (Kammerling and O’Connor, 1993; Simone et al., 2013) and difficult to interpret. Note that we have used the proportion of employed persons among the population aged 15 years and over, whereas other studies used the unemployment rate, which is usually defined among the labour force. For the subset of patients with affective disorders there was no evidence for an effect of the local employment rate. A higher proportion of foreign residents was found to increase the rate of psychiatric admissions, which is in agreement with the recent study by Simone et al. (2013). A higher proportion of one-person households was also found to increase the admission rate, which probably relates to a lack of social support and/or partnership known as a protective factors. However, previous findings on the effect of household size are contradictory (Torrey and Yolken, 1998; Simone et al., 2013).
To test for space-time interaction of psychiatric admissions, we assumed the “spread” to be confined to 250 metres with homogeneous infectivity in this neighbourhood. This corresponds to the closest and most influential distance class in a previous study on the spatial clustering of autism (Liu et al., 2010). Regardless of whether a classical test or the model-based test was applied, we found no indication of spatio-temporal interaction of psychiatric hospital admissions in Zurich. We have additionally assessed the sensitivity of the Knox and model-based tests with respect to the assumed upper bounds of spatial and temporal interaction. Restricting interaction to cases in the same building only ( metres) or to or 500 metres and/or assuming shorter infectious periods of or 3 instead of 14 days led to similar test results with no evidence for space-time interaction. For instance, the smallest -values obtained for the F2 subset are 0.28 (Knox) and 0.22 (model-based), respectively, for the thresholds metres and days corresponding to the highest value of in Figure LABEL:fig:stKplot_PUK2.
The spatial interaction function can be seen as a rough proxy for the population’s social contact network, which is the natural driver of person-to-person transmission. However, the potential interaction between subsequent admissions through social contacts might not map well into spatially confined clusters as suggested by the point process model. One potentially missing link is through the place of work, where colleagues might get informed about the hospital stay. Although we find no evidence of clustering of psychiatric admissions on the spatio-temporal scale, interaction between cases might become apparent if the social contact structure could be taken into account (Christakis and Fowler, 2013; Coviello et al., 2014).
Another limitation of this analysis of inpatient episodes from a single hospital is underreporting, since “infected” neighbours might not be admitted to the PUK in the first place. They might turn to a general practitioner, a registered psychiatrist, or another psychiatric institution, and may or may not be eventually admitted to the PUK. Similar to missing links via long-range social contacts, such unobserved cases lead to missing clusters and underestimation of spatio-temporal interaction via the epidemic component.
To quantify the strength of interaction, the point process model enables the estimation of an effective reproduction number, which is also used as test statistic . However, the value of has to be interpreted with caution since it is affected by the endemic formulation. Specifically, the permutation test revealed that a positive force of infection is estimated even under absence of space-time interaction. This happens because the data do not support the piecewise constant endemic intensity on the chosen grid. Although we have restricted the observation region to the populated area of Zurich, the population density actually varies within each quarter. Given the large amount of 7 202 cases, there is evidence that subsequent cases tend to be closer to a previous case than implied by a spatially homogeneous intensity simply due to spatial clustering of the population. The permutation test accounts for this endemic misspecification in the null distribution of the test statistic by keeping the marginal spatial and temporal locations fixed. If significant space-time interaction is found (as for the occurrence of invasive meningococcal disease, see Supplementary material), the difference between the observed and its average value under permutation could be used as an effect size quantifying true space-time interaction. Note that for data conforming to the piecewise constant endemic intensity, for example, for simulations from the fitted endemic-epidemic point process model, the null distribution of is centred around zero (see Supplementary material).
5 Conclusions
Classical significance tests of space-time clustering solely operate on the events’ spatial and temporal distance matrices to evaluate the association of spatial and temporal closeness. In this paper we have demonstrated how spatio-temporal interaction can be investigated more thoroughly using a two-component point process regression model. While its endemic component explains the background risk of new events through regional and/or time-varying covariates, the superposed epidemic component reflects that events tend to appear in spatio-temporal clusters. Hence, the model-based global clustering test is adjusted for, e.g., socio-economic heterogeneity and seasonal effects.
For the psychiatric hospital admissions in Zurich, we found several quarter-level socio-economic characteristics to be associated with the endemic occurrence of cases. However, there was no evidence for spatio-temporal interaction of the cases. The hypothesized social influence on help-seeking behaviour is thus not apparent in local clusters of sequential hospital admissions. Therefore, standard methods for non-contagious spatial processes could be used to analyse these data, e.g., spatial point pattern analysis, or disease mapping and ecological regression approaches (Waller and Gotway, 2004; Baddeley et al., 2015). A simple example is a Poisson regression model for the number of patients by quarter using the population as a multiplicative offset and the socio-economic characteristics as explanatory variables (see, e.g., Lawson, 2013, Section 7.7, Marshall, 1991, or Wakefield, 2007). In mathematical terms, the expected number of patients (the Poisson rate) of quarter could be modelled as , where is the quarter’s population and the vector of socio-economic characteristics. Doing so, the estimated risk ratios and confidence intervals are in fact very similar to those from the endemic-epidemic point process model presented in Table 3. Alternatively, a separable endemic-only point process model could also serve as input for further exploratory analysis of second-order properties based on the inhomogeneous -function of Gabriel and Diggle (2009), which requires an estimate of the intensity at all events.
If no individual cases but only area-level counts over several time periods are available, the tests for spatial, temporal and spatio-temporal clustering proposed by Raubertas (1988) could be used. The areal time-series model of Meyer and Held (2014, Section 3) also offers means of quantifying the importance of transmission from neighbouring regions and estimating the spatial distance decay of interaction.
The methods discussed in this paper are "general tests of clustering" not to be confused with "tests for the detection of clusters" (Besag and Newell, 1991). Kulldorff (2006) reviews both of these for purely spatial processes. Methods to detect emergent space-time clusters have been proposed by, e.g., Piroutek et al. (2014) monitoring the cumulative sum of a local Knox statistic, or Kulldorff et al. (2005) using a space-time scan statistic.
Although the presented endemic-epidemic point process regression framework is not intended to replace the convenient classical tests, its added value is manifold: First, it offers insight into endemic characteristics of the process via modelling the background rate using covariates for which the test is adjusted. Second, a distance decay of interaction can be estimated and incorporated into the test. An example is the power-law kernel that we have used to reflect large-scale human travel in modelling the occurrence of invasive meningococcal disease in Germany (Meyer and Held, 2014). For comparison, we have also applied the various test procedures to these data and find clear evidence of spatio-temporal interaction as expected for an infectious disease (see Supplementary material). Last but not least, if there is evidence for space-time interaction, the model allows for a more detailed estimation of event-specific infectiousness through the epidemic predictor . The local population density or event characteristics, such as the patient’s age group or disease severity, could be associated with the triggering rate, such that events are expected to produce a varying number of secondary cases. Whether the model-based test also has more power to detect space-time interaction than the classical tests – especially if “mechanistic” knowledge about the process and suitable covariates enable a well-fitting model – is an open question to be possibly answered by future simulation studies.
Acknowledgements
We thank Michael Höhle (Stockholm University) and two anonymous referees for illuminating comments on a previous version of this manuscript, as well as Dominik Ullmann (Swiss Federal Statistical Office) and Michael Böniger (City of Zurich Statistics Office) for providing the socio-economic data of Zurich’s quarters. The work of the first author was financially supported by the Swiss National Science Foundation (Project #137919).
Appendix A Software
All analyses were performed using the statistical software environment R (R Core Team, 2015). We have implemented the model-based test (epitest) as well as the Knox test (knox) in the framework of the R package surveillance (Höhle et al., 2016). The package contains methods for visualization, inference and simulation of the endemic-epidemic point process model (as described in Meyer et al., 2016, Section 3), as well as a wrapper (stKtest) to perform -function analysis using the splancs package (Rowlingson and Diggle, 2015). For all these tests, our implementations allow the permutations to be distributed across multiple cores. To perform the standardized Mantel test, we used a C implementation (mantel.randtest) from the package ade4 (Chessel et al., 2004) as at version 1.7-4.
Embedding the test for interaction in a point process regression model for the conditional intensity function comes at the cost of a considerably increased runtime compared to the classical tests (Table 5). Fitting a single model (with constant spatial interaction function) only takes about a second for a given data set, but the permutation approach requires the two competing models (with and without the epidemic component) to be re-estimated on each of the permutations. Furthermore, the extra long runtime for the whole data set (also for the Knox test) is due to memory-intensive distance matrix calculations, which do not scale well on a laptop. This will, however, very much improve by a more efficient implementation of the permutation handling planned for future versions of the R package surveillance.
| Knox | Mantel | -function | Model-based | |
|---|---|---|---|---|
| All cases () | 20.6 | 1.7 | 8.8 | 44.0 |
| F2 cases () | 0.6 | 0.1 | 0.3 | 1.6 |
| F3 cases () | 1.6 | 0.2 | 0.7 | 3.0 |
Shapefiles have been edited using QGIS 2.2 (Quantum GIS Development Team, 2014) with the fTools plugin 0.6.2. The original administrative boundaries have been simplified using MapShaper.org v. 0.1.18 (Harrower and Bloch, 2006) to speed up computations. Within R, the packages sp (Pebesma and Bivand, 2005), rgdal (Bivand et al., 2015), rgeos (Bivand and Rundel, 2016), and spatstat (Baddeley et al., 2015) were used to deal with geographic shapes. The list of holidays in Zurich was obtained from package timeDate (Wuertz, 2015). Tables have been created with the xtable package (Dahl, 2016). This manuscript has been generated dynamically in R version 3.2.3 (2015-12-10) using knitr (Xie, 2015).
Supplementary material
A supplementary application of the various tests for space-time interaction to cases of invasive meningococcal disease, can be found in the publisher’s version of record at doi:10.1016/j.sste.2016.03.002.
References
- Baddeley et al. (2015) Baddeley A, Rubak E, Turner R. Spatial Point Patterns: Methodology and Applications with R. Chapman & Hall/CRC Interdisciplinary Statistics. Chapman and Hall/CRC, 2015.
- Balderama et al. (2012) Balderama E, Schoenberg FP, Murray E, Rundel PW. Application of branching models in the study of invasive species. J Am Stat Assoc 2012;107(498):467–76. doi:10.1080/01621459.2011.641402.
- Besag and Diggle (1977) Besag J, Diggle PJ. Simple Monte Carlo tests for spatial pattern. J R Stat Soc Ser C Appl Stat 1977;26(3):327–33. doi:10.2307/2346974.
- Besag and Newell (1991) Besag J, Newell J. The detection of clusters in rare diseases. J R Stat Soc Ser A Stat Soc 1991;154:143–55. doi:10.2307/2982708.
- Birch et al. (2000) Birch JM, Alexander FE, Blair V, Eden OB, Taylor GM, McNally RJQ. Space-time clustering patterns in childhood leukaemia support a role for infection. Br J Cancer 2000;82(9):1571–6. doi:10.1054/bjoc.1999.1072.
- Bivand et al. (2015) Bivand R, Keitt T, Rowlingson B. rgdal: Bindings for the Geospatial Data Abstraction Library; 2015. URL: https://CRAN.R-project.org/package=rgdal; R package version 1.1-3.
- Bivand and Rundel (2016) Bivand R, Rundel C. rgeos: Interface to Geometry Engine - Open Source (GEOS); 2016. URL: https://CRAN.R-project.org/package=rgeos; R package version 0.3-17.
- Chaix et al. (2006) Chaix B, Leyland AH, Sabel CE, Chauvin P, Råstam L, Kristersson H, Merlo J. Spatial clustering of mental disorders and associated characteristics of the neighbourhood context in Malmö, Sweden, in 2001. J Epidemiol Community Health 2006;60(5):427–35. doi:10.1136/jech.2005.040360.
- Chessel et al. (2004) Chessel D, Dufour AB, Thioulouse J. The ade4 package — I: One-table methods. R News 2004;4(1):5–10.
- Christakis and Fowler (2013) Christakis NA, Fowler JH. Social contagion theory: examining dynamic social networks and human behavior. Stat Med 2013;32(4):556–77. doi:10.1002/sim.5408.
- Clements et al. (2011) Clements RA, Schoenberg FP, Schorlemmer D. Residual analysis methods for space-time point processes with applications to earthquake forecast models in California. Ann Appl Stat 2011;5(4):2549–71. doi:10.1214/11-AOAS487.
- Coviello et al. (2014) Coviello L, Sohn Y, Kramer ADI, Marlow C, Franceschetti M, Christakis NA, Fowler JH. Detecting emotional contagion in massive social networks. PLoS ONE 2014;9(3):e90315. doi:10.1371/journal.pone.0090315.
- Dahl (2016) Dahl DB. xtable: Export Tables to LaTeX or HTML; 2016. URL: https://CRAN.R-project.org/package=xtable; R package version 1.8-2.
- Daley and Gani (1999) Daley DJ, Gani J. Epidemic Modelling: An Introduction. Cambridge University Press, 1999.
- Diggle (2013) Diggle PJ. Statistical Analysis of Spatial and Spatio-Temporal Point Patterns. 3rd ed. Monographs on Statistics & Applied Probability. Boca Raton: Chapman & Hall/CRC, 2013.
- Diggle et al. (1995) Diggle PJ, Chetwynd AG, Häggkvist R, Morris SE. Second-order analysis of space-time clustering. Stat Methods Med Res 1995;4(2):124–36. doi:10.1177/096228029500400203.
- Diggle et al. (2005) Diggle PJ, Rowlingson B, Su Tl. Point process methodology for on-line spatio-temporal disease surveillance. Environmetrics 2005;16(5):423–34. doi:10.1002/env.712.
- Eckley and Curtin (2013) Eckley DC, Curtin KM. Evaluating the spatiotemporal clustering of traffic incidents. Comput Environ Urban Syst 2013;37:70–81. doi:10.1016/j.compenvurbsys.2012.06.004.
- Fowler and Christakis (2008) Fowler JH, Christakis NA. Dynamic spread of happiness in a large social network: longitudinal analysis over 20 years in the Framingham Heart Study. BMJ 2008;337:a2338. doi:10.1136/bmj.a2338.
- Gabriel and Diggle (2009) Gabriel E, Diggle PJ. Second-order analysis of inhomogeneous spatio-temporal point process data. Stat Neerl 2009;63(1):43–51. doi:10.1111/j.1467-9574.2008.00407.x.
- Grubesic and Mack (2008) Grubesic TH, Mack EA. Spatio-temporal interaction of urban crime. J Quant Criminol 2008;24(3):285–306. doi:10.1007/s10940-008-9047-5.
- Gustafsson and Carstensen (2000) Gustafsson B, Carstensen J. Space-time clustering of childhood lymphatic leukaemias and non-Hodgkin’s lymphomas in Sweden. Eur J Epidemiol 2000;16(12):1111–6. doi:10.1023/A:1010953713048.
- Harrower and Bloch (2006) Harrower M, Bloch M. Mapshaper.org: a map generalization web service. IEEE Comput Graph Appl 2006;26(4):22–7. doi:10.1109/MCG.2006.85.
- Haw et al. (2013) Haw C, Hawton K, Niedzwiedz C, Platt S. Suicide clusters: A review of risk factors and mechanisms. Suicide Life Threat Behav 2013;43(1):97–108. doi:10.1111/j.1943-278X.2012.00130.x.
- Held et al. (2005) Held L, Höhle M, Hofmann M. A statistical framework for the analysis of multivariate infectious disease surveillance counts. Stat Modelling 2005;5(3):187–99. doi:10.1191/1471082X05st098oa.
- Höhle et al. (2016) Höhle M, Meyer S, Paul M. surveillance: Temporal and Spatio-Temporal Modeling and Monitoring of Epidemic Phenomena; 2016. URL: http://surveillance.r-forge.r-project.org/; R package version 1.11.0.
- Jacquez (1996) Jacquez GM. A nearest neighbour test for space-time interaction. Stat Med 1996;15(18):1935–49. doi:10.1002/(SICI)1097-0258(19960930)15:18<1935::AID-SIM406>3.0.CO;2-I.
- Johnson (2010) Johnson SD. A brief history of the analysis of crime concentration. Eur J Appl Math 2010;21(4–5):349–70. doi:10.1017/S0956792510000082.
- Kammerling and O’Connor (1993) Kammerling RM, O’Connor S. Unemployment rate as predictor of rate of psychiatric admission. BMJ 1993;307:1536–9. doi:10.1136/bmj.307.6918.1536.
- Knox (1964) Knox EG. The detection of space-time interactions. J R Stat Soc Ser C Appl Stat 1964;13(1):25–30. doi:10.2307/2985220.
- Knox (1963) Knox G. Detection of low intensity epidemicity: application to cleft lip and palate. Br J Prev Soc Med 1963;17(3):121–7.
- Kulldorff (2006) Kulldorff M. Tests of spatial randomness adjusted for an inhomogeneity. J Am Stat Assoc 2006;101(475):1289–305. doi:10.1198/016214506000000618.
- Kulldorff et al. (2005) Kulldorff M, Heffernan R, Hartman J, Assunção R, Mostashari F. A space-time permutation scan statistic for disease outbreak detection. PLoS Med 2005;2(3):e59. doi:10.1371/journal.pmed.0020059.
- Kulldorff and Hjalmars (1999) Kulldorff M, Hjalmars U. The Knox method and other tests for space-time interaction. Biometrics 1999;55(2):544–52. doi:10.1111/j.0006-341X.1999.00544.x.
- Lawson (2013) Lawson AB. Bayesian Disease Mapping: Hierarchical Modeling in Spatial Epidemiology. 2nd ed. Chapman & Hall/CRC Interdisciplinary Statistics Series. Chapman & Hall/CRC, 2013.
- Lawson and Leimich (2000) Lawson AB, Leimich P. Approaches to the space-time modelling of infectious disease behaviour. IMA J Math Appl Med Biol 2000;17(1):1–13. doi:10.1093/imammb/17.1.1.
- Liu et al. (2010) Liu KY, King M, Bearman PS. Social influence and the autism epidemic. AJS 2010;115(5):1387–434. doi:10.1086/651448.
- Mack et al. (2012) Mack EA, Malizia N, Rey SJ. Population shift bias in tests of space-time interaction. Comput Environ Urban Syst 2012;36(6):500–12. doi:10.1016/j.compenvurbsys.2012.05.001.
- Mantel (1967) Mantel N. The detection of disease clustering and a generalized regression approach. Cancer Res 1967;27(2):209–20.
- Marshall (1991) Marshall RJ. A review of methods for the statistical analysis of spatial patterns of disease. J R Stat Soc Ser A Stat Soc 1991;154(3):421–41. doi:10.2307/2983152.
- McNally et al. (2006) McNally RJ, Alexander FE, Bithell JF. Space-time clustering of childhood cancer in great Britain: A national study, 1969–1993. Int J Cancer 2006;118(11):2840–6. doi:10.1002/ijc.21726.
- Meyer et al. (2012) Meyer S, Elias J, Höhle M. A space-time conditional intensity model for invasive meningococcal disease occurrence. Biometrics 2012;68(2):607–16. doi:10.1111/j.1541-0420.2011.01684.x.
- Meyer and Held (2014) Meyer S, Held L. Power-law models for infectious disease spread. Ann Appl Stat 2014;8(3):1612–39. doi:10.1214/14-AOAS743.
- Meyer et al. (2016) Meyer S, Held L, Höhle M. Spatio-temporal analysis of epidemic phenomena using the R package surveillance. J Stat Softw 2016;in press. arXiv:1411.0416.
- Mohler et al. (2011) Mohler GO, Short MB, Brantingham PJ, Schoenberg FP, Tita GE. Self-exciting point process modeling of crime. J Am Stat Assoc 2011;106(493):100--8. doi:10.1198/jasa.2011.ap09546.
- Morris et al. (2015) Morris SE, Zelner JL, Fauquier DA, Rowles TK, Rosel PE, Gulland F, Grenfell BT. Partially observed epidemics in wildlife hosts: modelling an outbreak of dolphin morbillivirus in the northwestern Atlantic, June 2013--2014. J R Soc Interface 2015;12(112):20150676. doi:10.1098/rsif.2015.0676.
- Møller and Ghorbani (2012) Møller J, Ghorbani M. Aspects of second-order analysis of structured inhomogeneous spatio-temporal point processes. Stat Neerl 2012;66(4):472--91. doi:10.1111/j.1467-9574.2012.00526.x.
- Ogata (1988) Ogata Y. Statistical models for earthquake occurrences and residual analysis for point processes. J Am Stat Assoc 1988;83(401):9--27.
- Ogata (1998) Ogata Y. Space-time point-process models for earthquake occurrences. Ann Inst Stat Math 1998;50(2):379--402. doi:10.1023/A:1003403601725.
- Pebesma and Bivand (2005) Pebesma EJ, Bivand RS. Classes and methods for spatial data in R. R News 2005;5(2):9--13.
- Piroutek et al. (2014) Piroutek A, Assunção R, Paiva T. Space-time prospective surveillance based on Knox local statistics. Stat Med 2014;33(16):2758--73. doi:10.1002/sim.6118.
- Quantum GIS Development Team (2014) Quantum GIS Development Team . Quantum GIS Geographic Information System. Open Source Geospatial Foundation; 2014. URL: http://qgis.osgeo.org/; QGIS version 2.2.0.
- R Core Team (2015) R Core Team . R: A Language and Environment for Statistical Computing. R Foundation for Statistical Computing; Vienna, Austria; 2015. URL: https://www.R-project.org/.
- Raubertas (1988) Raubertas RF. Spatial and temporal analysis of disease occurrence for detection of clustering. Biometrics 1988;44(4):1121--9. doi:10.2307/2531740.
- Reijneveld and Schene (1998) Reijneveld SA, Schene AH. Higher prevalence of mental disorders in socioeconomically deprived urban areas in The Netherlands: community or personal disadvantage? J Epidemiol Community Health 1998;52(1):2--7. doi:10.1136/jech.52.1.2.
- Rosenquist et al. (2011) Rosenquist JN, Fowler JH, Christakis NA. Social network determinants of depression. Mol Psychiatry 2011;16(3):273--81. doi:10.1038/mp.2010.13.
- Rowlingson and Diggle (2015) Rowlingson B, Diggle P. splancs: Spatial and Space-Time Point Pattern Analysis; 2015. URL: https://CRAN.R-project.org/package=splancs; R package version 2.01-38.
- Self and Liang (1987) Self SG, Liang KY. Asymptotic properties of maximum likelihood estimators and likelihood ratio tests under nonstandard conditions. J Am Stat Assoc 1987;82(398):605--10. doi:10.1080/01621459.1987.10478472.
- Simone et al. (2013) Simone C, Carolin L, Max S, Reinhold K. Associations between community characteristics and psychiatric admissions in an urban area. Soc Psychiatry Psychiatr Epidemiol 2013;48(11):1797--808. doi:10.1007/s00127-013-0667-1.
- Sundquist and Ahlen (2006) Sundquist K, Ahlen H. Neighbourhood income and mental health: A multilevel follow-up study of psychiatric hospital admissions among 4.5 million women and men. Health Place 2006;12(4):594--602. doi:10.1016/j.healthplace.2005.08.011.
- Tango (2010) Tango T. Statistical Methods for Disease Clustering. Statistics for Biology and Health. Springer, 2010. doi:10.1007/978-1-4419-1572-6.
- Torrey and Yolken (1998) Torrey EF, Yolken RH. Is household crowding a risk factor for schizophrenia and bipolar disorder? Schizophr Bull 1998;24(3):321--4.
- Wakefield (2007) Wakefield J. Disease mapping and spatial regression with count data. Biostatistics 2007;8(2):158--83. doi:10.1093/biostatistics/kxl008.
- Waller and Gotway (2004) Waller LA, Gotway CA. Applied Spatial Statistics for Public Health Data. Wiley Series in Probability and Statistics. John Wiley & Sons, 2004. doi:10.1002/0471662682.
- Ward and Carpenter (2000) Ward MP, Carpenter TE. Analysis of time-space clustering in veterinary epidemiology. Prev Vet Med 2000;43(4):225--37. doi:10.1016/S0167-5877(99)00111-7.
- Wuertz (2015) Wuertz D. timeDate: Rmetrics - Chronological and Calendar Objects; 2015. URL: https://CRAN.R-project.org/package=timeDate; R package version 3012.100.
- Xie (2015) Xie Y. Dynamic Documents with R and knitr. 2nd ed. The R Series. Boca Raton, Florida: Chapman and Hall/CRC, 2015.