Fast atom diffraction inside a molecular beam epitaxy chamber, a rich combination.
Abstract
Two aspects of the contribution of grazing incidence fast atom diffraction (GIFAD) to molecular beam epitaxy (MBE) are reviewed here: the ability of GIFAD to provide in-situ a precise description of the atomic-scale surface topology, and its ability to follow larger-scale changes in surface roughness during layer-by-layer growth. Recent experimental and theoretical results obtained for the He atom beam incident along the highly corrugated direction of the (24) reconstructed GaAs(001) surface are summarized and complemented by the measurements and calculations for the beam incidence along the weakly corrugated [010] direction where a periodicity twice smaller as expected is observed. The combination of the experiment, quantum scattering matrix calculations, and semiclassical analysis allows in this case to reveal structural characteristics of the surface. For the in situ measurements of GIFAD during molecular beam epitaxy of GaAs on GaAs surface we analyse the change in elastic and inelastic contributions in the scattered beam, and the variation of the diffraction pattern in polar angle scattering. This analysis outlines the robustness, the simplicity and the richness of the GIFAD as a technique to monitor the layer-by-layer epitaxial growth.
I Introduction
Molecular beam epitaxy (MBE) has played a major role in the development of modern electronic devices. Its ability to deposit successive layers of high purity crystalline materials with monolayer accuracy is well established. Since its development, MBE growth has been monitored in-situ by reflection high energy electron diffraction Ohtake2008 (RHEED). More recently, a new diffraction technique using the same geometry as RHEED but with keV atoms instead of electrons has emerged as a tool to measure the surface crystalline order on metals Bundaleski2008 ; Schuller2009 , semi-conductor Debiossac2014 ; Khemliche2009 and insulators Schuller2007 ; Rousseau2007 . To test this technique under conventional semiconductor growth conditions, we have attached a GIFAD setup to a conventional III-V MBE chamber Atkinson2014 ; Debiossac2014 , and studied the surface reconstructions and dynamics of layer by layer growth for the homoepitaxy of GaAs.
The paper is organized as follows, firstly a discussion of the GIFAD technique and underlying theory is given, followed by details of its experimental implantation on a commercial MBE system. The measurement of the surface corrugation of a complex surface reconstruction: the reconstruction of the GaAs (001) surface is then discussed. Finally an analysis of the change in elastic and inelastic scattering, and the variation in polar angle intensity distribution of the scattered He atoms during layer-by-layer growth is presented.
II Grazing incidence fast atom diffraction
Being unable to penetrate the topmost layer, thermal energy helium atoms are, by nature, perfectly surface sensitive. Grazing incidence fast atom diffraction (GIFAD) uses helium atoms at energies in the range from some hundreds of eV to some keV impinging at the surface under grazing incidence angles . The full diffraction pattern can be then recorded with high efficiency on a position sensitive detector. The grazing incidence conditions correspond to the very different regimes of the projectile motion parallel and perpendicular to the surface which typically can be treated separately. The motion parallel to the surface is fast leading merely to the averaging of the projectile-surface interaction potential along trajectory. The diffraction is associated with slow motion perpendicular to the surface which corresponds to the projectile energy in the sub-eV range. Indeed, the corresponding wavelength is in the Å range of the interatomic distances at the surface ( is the projectile mass). For further insights on the physics behind GIFAD we address the reader to refs. Rousseau2007 ; Manson2008 ; Aigner2008 ; WinterReview .
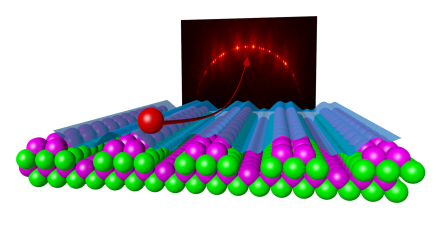
One of the advantages of GIFAD over HAS Estermann1930 ; Hulpke1992 ; Toennies97 ; Farias2004CPL ; Jardine2004 in that diffraction is preserved even at high substrate temperatures. In HAS the fraction of coherent scattering is described by the Debye Waller factor DW, with often forcing experiments to be performed on surface cooled at liquid nitrogen temperature. In GIFAD, the momentum transfer needed for specular reflection is spread over N successive atoms of the surface so that the effective thermal amplitude is and the effective Debye Waller factor is now N times smaller giving rise to a much larger coherence ratio Rousseau2008 ; Manson2008 !!. This explains that both larger perpendicular energies and higher surface temperatures can be studied in GIFAD. Another specificity of GIFAD is that only one Laue circle is typically observedBusch2012 just as if the surface consists of translation-invariant furrows Rousseau2007 ; Zugarramurdi_NIMB_2013 ; Zugarramurdi2012 (see Fig.1). Finally, since the interaction reflecting the helium atom from the surface is comparable to that repelling the tip of an AFM, GIFAD can be interpreted in simple topological terms. In this respect it can be metaphorically seen as an AFM operating in the k-space.
III experimental setup MBE and GIFAD
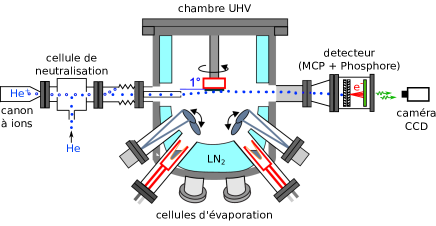
The MBE chamber is a standard RIBER Compact21 but a splitting flange has been attached to both the source and detector RHEED ports allowing operation of RHEED or GIFAD independently Atkinson2014 ; Debiossac2014 . The GIFAD setup is based on a conventional VG EX05 hot filament ion source. The ion beam extracted from the source enters a charge exchange cell filled with helium where % of the ions are neutralised by resonant electron capture. The ions that survived the neutralisation are deflected, and the resulting atom beam is collimated by two sets of diaphragms half a meter apart which also allow an efficient differential pumping. These diaphragms might limit the angular divergence of the beam down to the range, however in price of loss of beam intensity. The detector is made of one or two microchannel plate electron multipliers facing a phosphor screen which is imaged by a CCD camera. The GIFAD source was attached to the MBE chamber by flexible bellows, and could be ”rocked” mechanically using automated motors to vary the incidence angle of the beam on the surface.
Overall the use of GIFAD is comparable to that of RHEED, with a highly ordered 2D surface giving rise to bright spots centered on the Laue circle. In GIFAD these spots inherit the profile as the incident beam. In addition, the inelastic background produced by the thermal movement of the surface atomsManson2008 ; Rousseau2008 , and by the surface defects Pfandzelter gives rise to a low intensity vertical extensions of the spots as can be seen on Fig. 1.
IV Static conditions, high resolution mode
IV.1 The surface electronic density
When acquisition time is not an issue, the beam divergence can be reduced down to resulting in a transverse momentum divergence , and a lateral coherence above 20 Å. The drawback is that the beam intensity is also reduced however extremely rich and complex diffraction patterns with up to almost one hundred diffraction spots can be recorded with good resolution in a still reasonable time of few minutes. The unit cell lattice spacing divided by the number of diffraction orders gives a rough measure of the lateral resolution of the surface potential corrugation while a vertical resolution of better than is easily achieved due to the intrinsic interferometric accuracy. Under the collimation conditions discussed here, using 400 eV Helium atoms with incidence angle yields a lateral resolution of 0.1 Å and a vertical resolution of 0.01 Å. Such an accuracy challenges the best theoretical descriptions of the surface, as was demonstrated in a combined theoretical and experimental GIFAD study of the (24) reconstructed GaAs(001) surfaceDebiossac2014 . In this work, the surface structure and projectile-surface interaction potential were obtained from ab-initio density functional theory (DFT) calculations. With the DFT inputs, the diffracted intensities were calculated using a close coupling technique and compared with experimental data. In the following we shortly review these results.
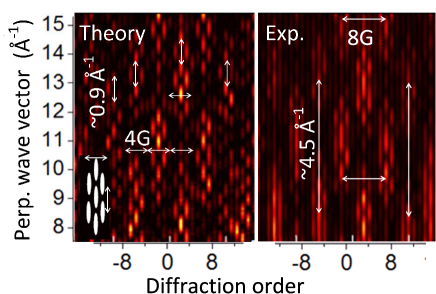
In Fig. 4 we show a small area of the experimental and theoretical diffraction charts corresponding to the (24) reconstructed GaAs(001) surface. The data shown was collected by varying the angle of incidence in the 30–100 meV perpendicular energy range along the incidence beam direction. Whereas the repulsive part of the calculated potential appeared to bring a good account of the diffraction, the GGA-type approximation used for the exchange-correlation potential in the DFT calculations cannot correctly describe the long-range Van der Waals interaction. An overall good agreement between theory and experiment, as evidenced in Fig. 4, could be reached by a simple rescaling of the attractive part of the DFT-derived potential. The rescaling resulted in a depth of the physisorption potential well of 8.7 meV, which is in line with earlier reports for the same systemVidali1991 . This highlights the ability of GIFAD measurements to provide an strong experimental test of DFT-derived potentials.
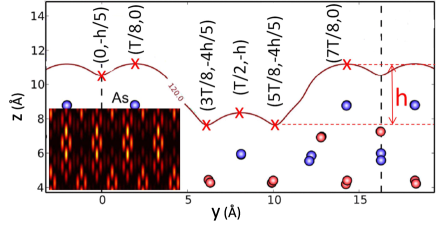
More interesting is the study of the origin of the chain-like pattern revealed by the diffraction charts of Fig.4. As shown in Ref. (Debiossac2014 ), this pattern can be interpreted in terms of a simple quasi-classical ray tracing model and thus reveals the robust information on the structure of the surface. Let us introduce a reference frame which will be used all through the paper in discussion of the diffraction. We set -axis perpendicular to the surface and pointing towards the vacuum, -axis along the axial channel closest to the direction of the incident beam, and -axis perpendicular to this axial channel and lying within the surface plane. In GIFAD the effective potential “seen” by the moving projectile results from the 3D projectile surface interaction averaged along the fast motion direction . The diffraction results from the periodicity of the surface potential along -direction as shown in Fig. 5 and it is associated with the slow motion (with energy ) in the -plane Rousseau2007 ; Manson2008 ; WinterReview
Now, the quasi specular reflection is governed by the location of the flat portions of the potential surface, i.e. the top of the hills and the bottom of the valleys. The diffraction order corresponds to the change of the projectile momentum projection on -axis, , where is the reciprocal lattice vector associated with the period of the structure in the -direction (see Fig. 5). The period of eight diffraction orders between two chain patterns in the diffraction chart, indicates a minimum distance of between diffracting points while the vertical period of 4.5 Å-1 indicates a separation of Å along (). The same pattern also appears every four diffraction orders but in opposition indicating a contribution of points separated by . The fact that every fourth diffraction order is almost dark suggests that these points separated by have the same value so that their contributions add up every and cancel exactly every diffraction orders ( is an integer) whatever is: . The same analysis can be performed on the smaller scale details. The rapid oscillation with every 0.9 Å-1 points to a maximum difference of Å along between the lowest and highest points whereas the quadrature between adjacent orders indicates that the top and bottom structures are sitting at of each other. A complete interpretation would have to be more cautious but the careful analysis of the diffraction chart can be quite instructive.
Overall, a semi quantitative presentation can be generated by a simple six point ray tracing model using the topology depicted in Fig. 5. This interference pattern is extremely sensitive to the corrugation amplitudes and, to a lesser extend, to the lateral position estimated here around the 0.2 Å range. This is made possible via the high redundancy of the diffraction chart were the observation of dark lines, nodal structures and distinct patterns are robust fingerprints of the symmetry of the corrugation function. Note that, in the present case, the topology was first derived from calculation before it was realized that the observed fingerprint can be interpreted in relatively simple terms. In addition, a full quantum diffraction calculation which models the entire diffraction pattern is needed to confirm both the surface reconstruction model and the helium-surface interaction potential.
The reconstruction consists of well aligned pairs of As dimers separated by a deep valley (see Figs. 5 and 6) giving rise to a highly corrugated surface potential along the direction. This is not the case along the [010] direction oriented at from the valleys which are therefore hidden by the dimers of the top layer (see Fig. 6) producing a much flatter averaged potential in this direction.
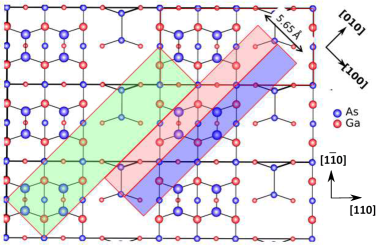
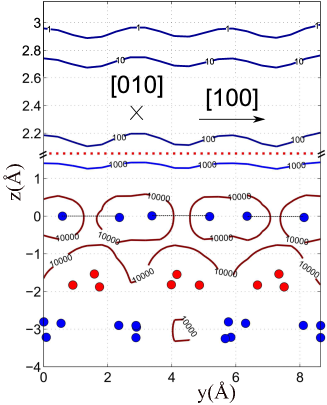
The apparent reduction of the surface corrugation when observed along the direction is visible in Fig. 7 where more than % of the intensity is in the specular spot. The radius of the Laue circle indicates an angle of incidence of corresponding to a perpendicular energy of 38 meV. More surprising, given the reciprocal lattice vector of (Fig6), only even diffraction orders are observed indicating a half cell pseudo symmetry Å. The genuine lattice cell is colored in green on Fig. 6 while the half cells observed as equivalent by GIFAD are colored in pink and purple. The pseudo periodicity with half-period is also visible in Fig. 8 which displays the interaction potential obtained from the total projectile-surface interaction potential averaged along the fast motion direction . Here we use the potentials determined in Ref. Debiossac2014 . This pseudo periodicity can be understood by considering that the deep valleys have a negligible contribution so that the dominant contribution comes from the top As dimers which display an exact half cell period. The bottom of the valley corresponds to the center of the As dimer which is associated with a projected distance of Å while the top of the corrugation function corresponds to two As atoms from different dimers which, after projection, are separated by only Å.
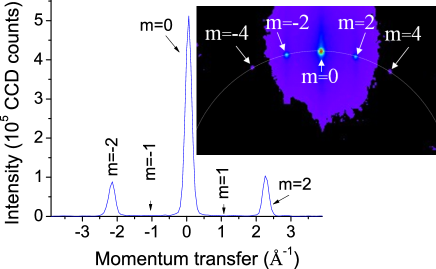
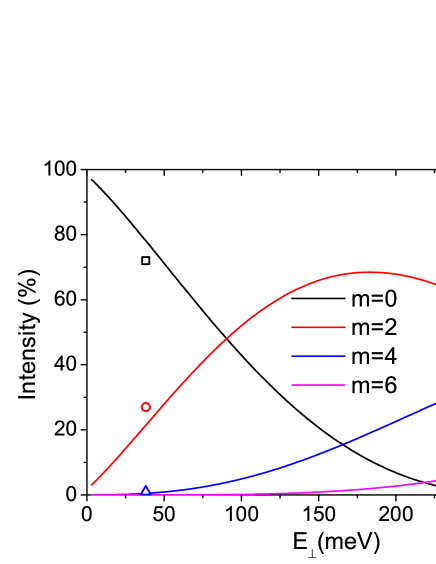
Figure. 9 displays the calculated intensities of the (specular reflection), diffraction orders for the 400 eV helium atom beam aligned along the direction of (24) reconstructed GaAs(001) surface. For the scattering calculations we used the atomic positions and projectile-surface interaction potential as obtained for the (24) reconstruction of GaAs(001) in Ref. Debiossac2014 . Results are shown as function of the energy component. The diffraction order is defined as the in-plane momentum exchange along -axis (in the direction perpendicular to the incidence direction) given by the reciprocal lattice vector of the native lattice cell . Because of the pseudo periodicity with half-period, and in full agreement with experimental data, we obtain that the odd diffraction orders are nearly extinct. In addition, for symmetry reasons, . Therefore, without loss of information, for we trace the sum of the intensities of the diffraction orders. Available experimental data is shown with symbols. Comparison between theory and experiment indicates that the surface corrugation is slightly overestimated in the ab-initio calculations, however the overall agreement is quite satisfying.
Along with ab initio calculations we have also used the simple hard corrugated wall model (HCW) of Garibaldi et al Garibaldi well suited for small corrugation. In this model, diffracted intensities are simply derived as a Fourier-like transform of the 1D equipotential line such that , where is the projectile-surface interaction averaged along the beam direction, here the direction. On one hand we have used the HVW to extract a corrugation amplitude from the diffracted intensities via a simple fit, i.e. independently from any a priori surface potential.Taking the simplest sinusoidal approximation , the diffracted intensities are given by the Bessel functions . The corrugation amplitude derived from the measured intensity ratio of the diffraction peaks is Å which is in good agreement with the calculated 1D equipotential shown in Fig. 8. On the other hand, we have also use the HCW to calculate the diffracted intensities from the same potential used in the quantum calculation. The fair agreement allows us to confirm the origin of the observed pseudo symmetry. We have suppressed, one by one, the contributions of the atoms below the As dimers in the construction of the interaction potential to calculate the equipotential lines . The exact locations of these equipotential lines are affected by the underlayers but the diffracted intensities are not. This outline that sensitivity to the top layer has a double origin, not only the contribution from under-layers located below is weaker by a factor ( is the typical range of the binary potential) but this contribution tends to be uniform because the spherical contributions converge to a more planar one. This can be also understood from the surviving Fourier components after averaging the potential: the higher the Miller indices of the direction associated to the 2D surface lattice, the higher the order of the Fourier components composing the averaged potential. These, overall, decay exponentially with increasing order. Zugarramurdi_NIMB_2013 ; Celli_1985
V GIFAD during growth
This section is devoted to the behaviour of GIFAD during growth and is based on the recent paper by Atkinson et al. Atkinson2014 . One of the most important uses of RHEED for MBE is the calibration of growth rates during layer-by-layer growth using RHEED intensity oscillations. With GIFAD, these oscillations have been investigated in detail for different projectile energies and angles of incidence as well as azimuthal angle and temperature for GaAs homoepitaxy Atkinson2014 .
Highly resolved GIFAD images such as the one displayed in Fig.3 require over a minute exposure time to achieve a good signal-to-noise ratio mainly due to limitations in the primary beam intensity. The growth oscillations discussed here were however recorded with the beam along the direction, where the apparent corrugation is weaker and the diffraction pattern can be resolved with an integration time of around 2s. A comparatively slow growth rate of 0.03 layers per second was used, and the growth temperature was C.
Oscillations in the GIFAD scattered intensity during layer-by-layer growth are shown in Fig. 10. These have the same period and overall shape as RHEED oscillations carried out under the same conditions. However, unlike RHEED, due to the absence of penetration the phase of these oscillations is exactly the same whatever the diffraction order, whatever the angle of incidence or the crystal direction of the incident beamAtkinson2014 . This lead us to associate the GIFAD oscillations to the variations of the surface reflectivity. When the helium beam impinges on a large flat terrace the reflectivity is close to but when obstacles are present along the helium trajectory, these atoms tends to be deflected to over specular scattering angles Pfandzelter . There is no penetration of the relatively low energy Helium atoms below the topmost layer therefore there are no interference effects which could alter the simple oscillations of the reflectivity. A maximum in the specular GIFAD scattered signal therefore will always correspond to the completion of a layer for true layer-by-layer growth.
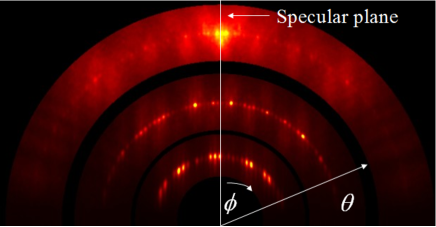
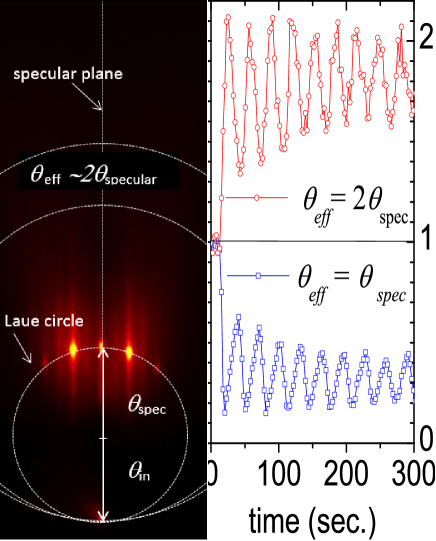
The detector records polar scattering angles up to , which is a significant fraction of the scattering pattern. To some extend, it is therefore possible to track how the missing intensity on the Laue circle is distributed. This was already illustrated in specific 2D color plots in ref. Atkinson2014 . We present here a point of view in terms of an integrated scattering angle distribution and the time evolution of its first three statistical moments; the integrated intensity , the mean value and the width . As illustrated on the left of Fig.10, the effective scattering angle associated with any point on the image is defined as the radius of the circle centered on the specular plane and intercepting the direct beam the points of interest. At the beginning of a new layer, the sudden drop in diffracted intensity is associated with a sudden apparition of scattering to super-specular angles. The figure 10 shows that a factor two in effective scattering angle is enough to observe a complete reversal of the GIFAD oscillation. However, the intensity at half specular angle also tends to increase at the beginning of a layer, but overall the trend to larger angle dominates. This as illustrated in figure 11 by the increase of the mean scattering angle . If both over and under specular intensities increase, then the width should be a reliable indicator of the growth. Indeed, the figure 11 shows that also oscillates with a nice triangular profile. Since, the evaluation of is not expected to depend significantly on whether or not diffraction is observed, it is probably a robust way for counting the layers when the identification of the Laue circle become problematic.
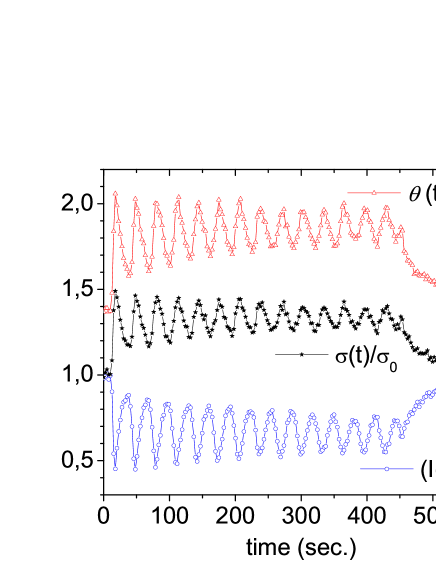
The curve in figure 11 corresponds to the intensity integrated on the whole detector. Oscillations are still present but the triangular shape has disappeared. In fact, if all scattered particle would reach the detector, no oscillation should be present anymore in ! This indicates that, at the minimum of the intensity oscillation, around one half of the helium projectiles do not reach the detector, probably deflected to scattering angle beyond the restricted zone that was selected to reduce the size of the data storage. In summary, both the intensity restricted around the Laue circle as analyzed in Atkinson2014 and the width of the polar distribution are probably worth displaying to monitor of the growth.
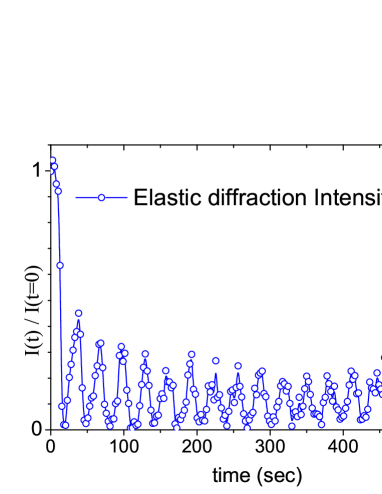
We now focus on the evolution of the elastic diffraction. Its contribution, located on the Laue circle,is comparatively easy to extract Debiossac2014 ; Debiossac_V by interpolating the background located below and above the Laue circle. The figure 12, shows that the intensity of this component drops to zero at the beginning of a new layer before slowly recovering. This suggests that elastic diffraction is more demanding in terms of surface coherence length, it is more sensitive to defect than inelastic diffraction which is observed to decrease but with a little contribution surviving all along the growth. A simple interpretation could be that an atom can be elastically diffracted only if it probes a locally periodic surface, i.e. it does not encounter a defect. At variance, as long as the cumulated momentum spread induced by defect is smaller than a reciprocal lattice vector, the inelastic diffraction remains present. This could be the case if the projectile encounters defects located at few lattice units from its “trajectory”. If the defect is closer producing a significant momentum transfer, the diffusion is likely to become completely incoherent and could possibly be modeled by classical scattering calculations. Detailed analysis of these three rich scattering contributions elastic, inelastic and diffuse may provide an insight into the different length-scales involved in island nucleation and coalescence during layer-by-layer growth.
VI conclusion perspective
We have demonstrated here that GIFAD is a technique which can be used to quantitatively test DFT models of surface reconstructions and the He-surface interaction potential for highly corrugated and complex surface reconstructions. Rocking curves together with a simple ray tracing analysis are also effective at rapidly confirming basic aspects of a surface reconstruction model. We have also shown that even for complex reconstructions, there exist surface channeling directions with very weak corrugation which can therefore be modeled with a simple Fourier-like analysis - providing another means to check the surface reconstruction model. Finally we have shown that GIFAD is effective at monitoring layer-by-layer growth and that deconvolution of the intensity oscillations into components corresponding to elastic, inelastic and diffuse scattering may lead to time resolved measurements of the mean distance between ad-atoms and provide new insights into island nucleation and coalescence.
VII Acknowledment
This work has been supported by Agence Nationale de la Recherche ANR-07-BLAN-0160 and ANR-2011-EMMA-003-01 and by the Triangle de la Physique (Contract No. 2012-040 T-GIFAD).
References
- (1) A. Ohtake, Surface reconstructions on GaAs(001) Surf. Sci. Reports 63, 295 (2008).
- (2) N. Bundaleski, H. Khemliche, P. Soulisse, and P. Roncin, Grazing Incidence Diffraction of keV Helium Atoms on a Ag(110) Surface. Phys. Rev. Lett. 101, 177601 (2008).
- (3) A. Schüller, M. Busch, S. Wethekam, and H. Winter, Fast Atom Diffraction from Superstructures on a Fe(110) Surface Phys. Rev. Lett. 102, 017602 (2009).
- (4) M. Debiossac, A. Zugarramurdi, P. Lunca-Popa, A. Momeni, H. Khemliche, A. G. Borisov, and P. Roncin, Transient Quantum Trapping of Fast Atoms at Surfaces. Phys. Rev. Lett. 112, 023203 (2014).
- (5) H. Khemliche, P. Rousseau, P. Roncin, V. H. Etgens, and F. Finocchi, Grazing incidence fast atom diffraction: An innovative approach to surface structure analysis. Appl. Phys. Lett. 95, 151901 (2009).
- (6) A. Schüller, S. Wethekam, and H. Winter, Diffraction of fast atomic projectiles during grazing scattering from a LiF (001) surface. Phys. Rev. Lett. 98, 016103 (2007).
- (7) P. Rousseau, H. Khemliche, A. G. Borisov, and P. Roncin, Quantum scattering of fast atoms and molecules on surfaces. Phys. Rev. Lett. 98, 016104 (2007).
- (8) P. Atkinson, M. Eddrief, V.H. Etgens, H. Khemliche, M. Debiossac, A. Momeni, M. Mulier, B. Lalmi, and P. Roncin, Dynamic grazing incidence fast atom diffraction during molecular beam epitaxial growth of GaAs. Appl. Phys. Lett. 105, 021602 (2014).
- (9) J. R. Manson, H. Khemliche, and P. Roncin, Theory of grazing incidence diffraction of fast atoms and molecules from surfaces. Phys. Rev. B 78, 155408 (2008).
- (10) F. Aigner, N. Simonović, B. Solleder, L. Wirtz, and J. Burgdörfer, Suppression of Decoherence in Fast-Atom Diffraction at Surfaces. Phys. Rev. Lett. 101, 253201 (2008).
- (11) H. Winter, and A. Schüller, F.ast atom diffraction at metal surface Prog. Surf. Sci. 86, 169 (2011).
- (12) I. Estermann and O. Stern, Beugung von molekularstrahlen. Z. Phys.61, 95 (1930).
- (13) E. Hulpke (Ed.), Helium Atom Scattering from Surfaces, Springer Series in Surface Sciences, Vol. 27, (Springer-Verlag, Berlin, 1992)
- (14) A. Glebov, A. P. Graham, A. Menzel and J. P. Toennies, Orientational ordering of two-dimensional ice on Pt(111). J. Chem. Phys. 106, 9382 (1997)
- (15) D. Farías, C. Díaz, P. Nieto, A. Salin, and F. Martín, In-Plane and Out-of-Plane Diffraction of H2 from Metal Surfaces. Chem. Phys. Lett. 390, 250 (2004).
- (16) A.P. Jardine,S. Dworski,P. Fouquet, G. Alexandrowicz, D.J. Riley, G.Y.H. Lee, J. Ellis, W. Allison, Ultrahigh-Resolution Spin-Echo Measurement of Surface Potential Energy Landscapes. Science 304 1790-1793 (2004)
- (17) P. Rousseau, H. Khemliche, N. Bundaleski, P. Soulisse, A. Momeni, and P. Roncin, Surface analysis with grazing incidence fast atom diffraction (GIFAD). J. Phys.: Conf. Ser. 133, 012013 (2008)
- (18) M. Busch, J. Seifert, E. Meyer, and H. Winter, Evidence for longitudinal coherence in fast atom diffraction. Phys. Rev. B 86, 241402(R)(2012)
- (19) A. Zugarramurdi, A. G. Borisov, When fast atom diffraction turns 3D Nucl. Instr. Meth. Phys. Res.: B 317, 83 (2013).
- (20) V. Celli, D. Eichenauer, A. Kaufhold, and J. Peter Toennies, Pairwise additive semi ab initio potential for the elastic scattering of He atoms from the LiF(001) crystal surface. J. Chem. Phys. 83, 2504 (1985).
- (21) A. Zugarramurdi, and A. G. Borisov, Theoretical study of the effect of beam misalignment in fast-atom diffraction at surfaces. Phys. Rev. A 86, 062903 (2012).
- (22) R. Pfandzelter, Origin of intensity oscillations in grazing ion scattering during epitaxial growth: a computational approach. Surface Science 421, Pages 263–272 (1999).
- (23) G. Vidali, G. Ihm, H.-Y. Kim, M. W. Cole, Potentials of physical adsorption, Surf. Sci. Rep. 12, 133 (1991).
- (24) M. Debiossac and P. Roncin, Image processing for Grazing incidence fast atom diffraction. submitted (2016).
- (25) U. Garibaldi, A. C. Levi, R. Spadacini, and G. E. Tommei, Quantum theory of atom-surface scattering: diffraction and rainbow. Surf.Sci. 48, 649 (1975).
- (26) C. Henkel, J.-Y. Courtois, and A. Aspect, Atomic diffraction by a thin phase grating. Journal de Physique II, vol. 4, no. 11, pp. 1955-1974, (1994)
- (27) Maxime Debiossac and Philippe Roncin, Atomic diffraction under oblique incidence: An analytical expression. Phys. Rev. A 90, 054701 (2014)