Selection maintaining protein stability at equilibrium
Abstract
The common understanding of protein evolution has been that neutral mutations are fixed by random drift, and a proportion of neutral mutations depending on the strength of structural and functional constraints primarily determines evolutionary rate. Recently it was indicated that fitness costs due to misfolded proteins are a determinant of evolutionary rate and selection originating in protein stability is a driving force of protein evolution. Here we examine protein evolution under the selection maintaining protein stability.
Protein fitness is a generic form of fitness costs due to misfolded proteins; , where and are selective advantage and stability change of a mutant protein, is the folding free energy of the wild-type protein, and is a parameter representing protein abundance and indispensability. The distribution of is approximated to be a bi-Gaussian distribution, which represents structurally slightly- or highly-constrained sites. Also, the mean of the distribution is negatively proportional to .
The evolution of this gene has an equilibrium point () of protein stability, the range of which is consistent with observed values in the ProTherm database. The probability distribution of , the ratio of nonsynonymous to synonymous substitution rate per site, over fixed mutants in the vicinity of the equilibrium shows that nearly neutral selection is predominant only in low-abundant, non-essential proteins of kcal/mol. In the other proteins, positive selection on stabilizing mutations is significant to maintain protein stability at equilibrium as well as random drift on slightly negative mutations, although the average is less than 1. Slow evolutionary rates can be caused by both high protein abundance/indispensability and large effective population size, which produces positive shifts of through decreasing , and strong structural constraints, which directly make more positive. Protein abundance/indispensability more affect evolutionary rate for less constrained proteins, and structural constraint for less abundant, less essential proteins. The effect of protein indispensability on evolutionary rate may be hidden by the variation of protein abundance and detected only in low-abundant proteins. Also, protein stability () and are predicted to decrease as growth temperature increases.
Highlights
-
1.
Protein stability is kept at equilibrium by random drift and positive selection.
-
2.
Neutral selection is predominant only for low-abundant, non-essential proteins.
-
3.
Protein abundance more decreases evolutionary rate for less-constrained proteins.
-
4.
Structural constraint more decreases evolutionary rate for less-abundant, less-essential proteins.
-
5.
Protein stability () and are predicted to decrease as growth temperature increases.
keywords:
neutral theory , positive selection , evolutionary rate , structural constraints , protein abundance1 Introduction
The common understanding of protein evolution has been that amino acid substitutions observed in homologous proteins are neutral (Kimura, 1968, 1969; Kimura and Ohta, 1971, 1974) or slightly deleterious (Ohta, 1973, 1992), and random drift is a primary force to fix amino acid substitutions in population. The rate of protein evolution has been understood to be determined primarily by the proportion of neutral mutations, which may be measured by the ratio of nonsynonymous to synonymous substitution rate per site () (Miyata and Yasunaga, 1980) and determined by functional density (Zuckerkandl, 1976) weighted by the relative variability at specific-function sites of a protein (Go and Miyazawa, 1980). Since then, these theories have been widely accepted, however, recently a question has been raised on whether the diversity of protein evolutionary rate among genes can be explained only by the proportion and the variability of specific-function sites, and molecular and population-genetic constraints on protein evolutionary rate have been explored.
Recent works have revealed that protein evolutionary rate is correlated with gene expression level; highly expressed genes evolve slowly, accounting for as much as 34% of rate variation in yeast (Pál et al., 2001). Of course, there are many reports that support a principle of lower evolution rate for stronger functional density. Broadly expressed proteins in many tissues tend to evolve slower than tissue-specific ones (Kuma et al., 1995; Duret and Mouchiro, 2000). The connectivity of well-conserved proteins in a network is shown (Fraser et al., 2002) to be negatively correlated with their rate of evolution, because a greater proportion of the protein sequence is directly involved in its function. A fitness cost due to protein–protein misinteraction affects the evolutionary rate of surface residues (Yang et al., 2012). Protein dispensability in yeast is correlated with the rate of evolution (Hirsh and Fraser, 2001, 2003), although there is a report insisting on no correlation between them (Pál et al., 2003). Other reports indicate that the correlation between gene dispensability and evolutionary rate, although low, is significant (Zhang and He, 2005; Wall et al., 2005; Jordan et al., 2002).
It was proposed (Drummond et al., 2005; Drummond and Wilke, 2008; Geiler-Samerotte et al., 2011) that low substitution rates of highly expressed genes could be explained by fitness costs due to functional loss and toxicity (Stoebel et al., 2008; Geiler-Samerotte et al., 2011) of misfolded proteins. Misfolding reduces the concentration of functional proteins, and wastes cellular time and energy on production of useless proteins. Also misfolded proteins form insoluble aggregates (Geiler-Samerotte et al., 2011). Fitness cost due to misfolded proteins is larger for highly expressed genes than for less expressed ones.
Fitness cost due to misfolded proteins was formulated (Drummond and Wilke, 2008; Geiler-Samerotte et al., 2011) to be related to the proportion of misfolded proteins. Knowledge of protein folding indicates that protein folding primarily occurs in two-state transition (Miyazawa and Jernigan, 1982a, b), which means that the ensemble of protein conformations are a mixture of completely folded and unfolded conformations. Free energy () of protein stability, which is equal to the free energy of the denatured state subtracted from that of the native state, and stability change () due to amino acid substitutions are collected in the ProTherm database (Kumar et al., 2006), although the data are not sufficient. Prediction methods, however, for are improved enough to reproduce real distributions of (Schymkowitz et al., 2005; Yin et al., 2007). Therefore, on the biophysical basis, the distribution of fitness can be estimated and protein evolution can be studied. Shakhnovich group studied protein evolution on the basis of knowledge of protein folding (Serohijos and Shakhnovich, 2014; Dasmeh et al., 2014) and showed (Serohijos et al., 2012) that the negative correlation between protein abundance and was caused by the distribution of that negatively correlates with the of a wild type. Also, it was shown (Serohijos et al., 2013) that highly abundant proteins had to be more stable than low abundant ones. Relationship between evolutionary rate and protein stability is studied from various points of view (Echave et al., 2015; Faure and Koonin, 2015).
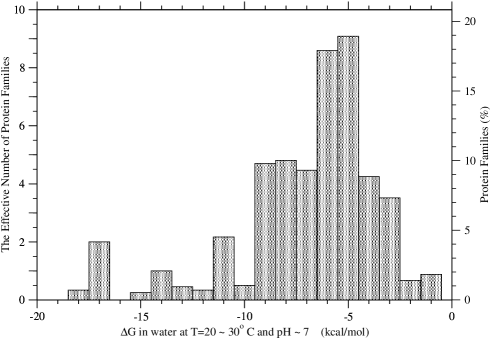
Here we study relationship between evolutionary rate and selection on protein stability in a monoclonal approximation. A fitness assumed here for a protein is a generic form to which all formulations (Drummond and Wilke, 2008; Geiler-Samerotte et al., 2011; Serohijos et al., 2012, 2013; Serohijos and Shakhnovich, 2014; Dasmeh et al., 2014) previously employed for protein fitness are reduced in the condition of , which is satisfied in the typical range of folding free energies shown in Fig. 1; , is the Boltzmann constant and is absolute temperature. The generic form of Malthusian fitness of a protein-coding gene is , where is a parameter, which may be a function of protein abundance and dispensability; see Methods for details. The distribution of stability change due to single amino acid substitutions is approximated as a weighted sum of two Gaussian functions that was shown (Tokuriki et al., 2007) to well reproduce actual distributions of . One of the two Gaussian functions describes substitutions at structurally less-constrained surface sites, and the other at more-constrained core sites of proteins. The proportion of less-constrained surface sites is a parameter ().
The fixation probability of a mutant with can be calculated for a duploid population with effective population size (Crow and Kimura, 1970). In the population of genes with such a fitness protein stability is evolutionarily maintained at equilibrium, and equilibrium stability () negatively correlates with protein abundance/dispensability (). The range of is consistent with the observed range of folding free energies shown in Fig. 1.
The probability density functions (PDF) of , the ratio of nonsynonymous to synonymous substitution rate per site (Miyata and Yasunaga, 1980), at equilibrium and also in the vicinity of equilibrium are numerically examined over a whole domain of the parameters, and . The dependences of evolutionary rate on protein abundance/dispensability and on structural constraint are quantitatively described, and it is shown that both factors cannot be ignored on protein evolutionary rate, although protein abundance/indispensability more affect evolutionary rate for less constrained proteins, and structural constraint for less abundant, less essential proteins. Like protein abundance, protein indispensability must correlate with evolutionary rate, but a correlation between them may be hidden by the variation of protein abundance as well as effective population size, and detected only in low-abundant proteins. It has also become clear that nearly neutral selection is predominant only in low-abundant, non-essential proteins with or kcal/mol, and in the other proteins positive selection is significant to more stabilize a less-stable wild type. Also, a significant amount of slightly negative mutants are fixed in population by random drift. This view of protein evolution is contrary to the previous understanding. The present model based on a biophysical knowledge of protein stability also indicates that protein stability () and the average of decrease as growth temperature increases.
2 Methods
2.1 Fitness costs due to misfolded proteins
Misfolding can impose costs in three distinct ways (Geiler-Samerotte et al., 2011); loss of function, diversion of protein synthesis resources away from essential proteins, and toxicity of the misfolded molecules. Fitness cost due to functional loss was formulated (Drummond and Wilke, 2008) by taking account of protein dispensability. Assuming that fitness cost of each gene is additive in the Malthusian fitness scale, the total Malthusian fitness of a genome was estimated as
| (1) |
where is defined as deletion-strain growth rate / max growth rate, and is the fraction of the native conformation for gene .
Protein folding primarily occurs in the two-state transition, which means that protein conformations are a mixture of completely folded and unfolded conformations (Miyazawa and Jernigan, 1982a, b). Therefore, if the completely folded (native) state is more stable by a free energy difference than the unfolded (denatured) state, then the native fraction in the conformational ensemble will be equal to
| (2) |
where ; is the Boltzmann constant and is absolute temperature.
Thus, Eq. (1) for the Malthusian fitness of a genome can be transformed as follows in terms of the folding free energy of the native conformation:
| (3) |
Because of in the typical range of folding free energies shown in Fig. 1, the above definition of fitness is approximated by
| (4) |
Drummond and Wilke (Drummond and Wilke, 2008) took notice of toxicity of misfolded proteins as well as diversion of protein synthesis resources, and formulated the Malthusian fitness () of a genome to be negatively proportional to the total amount of misfolded proteins, which must be produced to obtain the necessary amount of folded proteins (Serohijos et al., 2012).
| (5) | |||||
| (6) |
where is a positive constant and assumed to be , and is the abundance of protein .
2.2 Fitness of a linear metabolic pathway
Serohijos and Shakhnovich (Serohijos and Shakhnovich, 2014) examined the evolution of a linear metabolic pathway whose Wrightian fitness was defined as
| (7) | |||||
| (8) | |||||
| (9) |
where was defined as enzyme efficiency and assumed to be . The is a fitness originating from the enzymatic flux of a linear metabolic pathway, and represents the effect of toxicity of misfolded proteins, and is the same functional form as Eq. (1), although Eq. (1) is a definition for Malthusian fitness. Then, the Malthusian fitness corresponding to the Wrightian fitness above can be represented as
| (11) | |||||
Because (Serohijos and Shakhnovich, 2014), and , the higher order terms can be neglected in this case. However, the fitness costs due to the flux and misfolded proteins may be formulated to be additive in the Malthusian scale rather than in the Wrightian scale, employing Eq. (6) for the fitness cost due to misfolded proteins;
| (12) |
2.3 Other formulations of protein fitness
Also, the following simple definition for fitness to maintain protein stability was used (Dasmeh et al., 2014):
| (13) | |||||
| (14) |
2.4 A generic form of protein fitness
Thus, all expressions above for Malthusian fitness of protein can be well approximated by the following expression, because of in the typical range of folding free energies shown in Fig. 1.
| (15) |
where is a parameter. If the fitness costs of functional loss and toxicity due to misfolded proteins are taken into account, will be defined as
| (16) |
assuming their additivity in the Malthusian fitness scale.
The selective advantage of a mutant, in which each protein is destabilized by , to the wild type can be represented by
| (17) | |||||
| (18) |
3 Results
3.1 Protein stability and fitness
Here, we consider the evolution of a single protein-coding gene in which the selective advantage of mutant proteins in Malthusian parameters is assumed to be
| (19) |
and therefore is upper-bounded by
| (20) |
where is the stability of a wild-type protein, is a stability change of a mutant protein, ; unless specified, kcal-1mol corresponding to K. is a parameter whose meaning may depend on the situation; refer to Method for details. If the fitness costs of functional loss and toxicity due to misfolded proteins are both taken into account and assumed to be additive in the Malthusian fitness scale, will be defined as
| (21) |
where is fitness cost per misfolded protein (Drummond and Wilke, 2008; Geiler-Samerotte et al., 2011), is the cellular abundance of the protein (Drummond and Wilke, 2008; Geiler-Samerotte et al., 2011), and is indispensability (Drummond and Wilke, 2008) and defined to be deletion-strain growth rate / max growth rate. Equation (19) indicates that the selective advantage is upper-bounded by . The parameter is assumed in the present analysis to take values in the range of with effective population size , taking account of the values of the parameters, (Drummond and Wilke, 2008), (Ghaemmaghami et al., 2003), for essential genes (Drummond and Wilke, 2008), and to for vertebrates, to for invertebrates, to for unicellular eukaryotes, and for prokaryotes (Lynch and Conery, 2003). The above ranges of the parameters indicate that the effect of protein indispensability () may be hidden by the variation of protein abundance () as well as effective population size (), and may be detected only in low-abundant proteins.
Based on measurements of stability changes due to single amino acid substitutions in proteins, which are collected in the ProTherm database (Kumar et al., 2006), Serohijos et al. (Serohijos et al., 2012) reported that the distribution of is approximately a Gaussian distribution with mean = 1 kcal/mol and standard deviation = 1.7 kcal/mol. In addition, it was shown (Serohijos et al., 2012) that the mean of is negatively proportional to , and that this dependence of the mean of on is not large but still important to cause the observed negative correlation between protein abundance and evolutionary rate. On the other hand, Tokuriki et al. (Tokuriki et al., 2007) computationally predicted for all possible single amino acid substitutions in 21 different globular, single domain proteins, and showed that the predicted distributions of were strikingly similar despite a range of protein sizes and folds and largely follow a bi-Gaussian distribution: one of the two Gaussian distributions results from substitutions on protein surfaces and is a narrow distribution with a mildly destabilizing mean , whereas the other due to substitutions in protein cores is a wider distribution with a stronger destabilizing mean (Tokuriki et al., 2007).
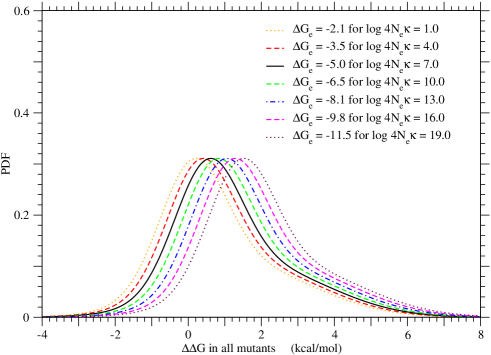
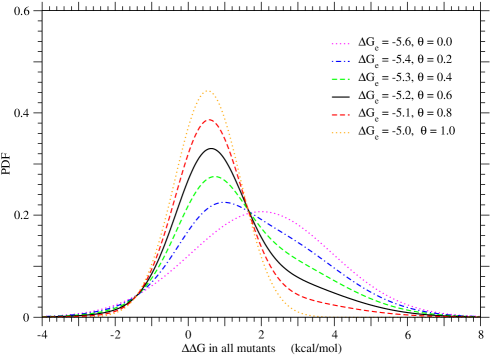
Here, according to (Tokuriki et al., 2007), the distribution of due to single amino acid substitutions is approximated as a bi-Gaussian function with the dependence of mean on , in order to examine the effects of structural constraint on evolutionary rate. The probability density function (PDF) of , , for nonsynonymous substitutions is assumed to be
| (22) |
where , and is a normal distribution with mean and standard deviation . Since the majority of substitutions appear to be single nucleotide substitutions, the values of the standard deviations ( and ) estimated in (Tokuriki et al., 2007) for single nucleotide substitutions are employed here; in kcal/mol units,
| (23) | |||||
| (24) |
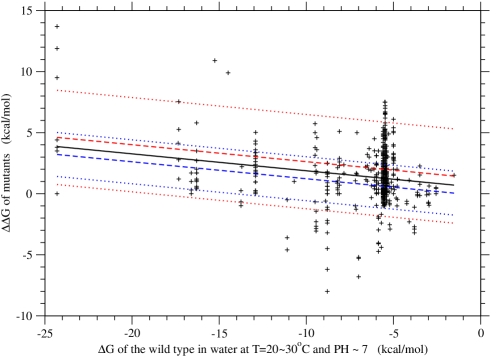
To analyze the dependences of the means, and , on , we plotted the observed values of of single amino acid mutants against of the wild type, which are collected in the ProTherm database (Kumar et al., 2006); the same analysis was done by (Serohijos et al., 2012). Fig. 2 shows a significant dependence of on ; the regression line is . The linear slopes of and are taken to be equal to the slope () of the regression line. The intercepts have been estimated to satisfy the following two conditions.
- 1.
-
2.
The total mean of the two Gaussian functions agrees with the regression line, . The value of is taken to be , which is equal to the average of over proteins used in (Tokuriki et al., 2007).
A representative value, , of is determined in such way that the equilibrium value of is equal to introduced above; is explicitly defined later. It is interesting that this value kcal/mol agrees with the most probable value of in the observed distribution of protein stabilities shown in Fig. 1. The fraction of less-constrained residues such as most residues on protein surface is correlated with protein length for globular, monomeric proteins; (Tokuriki et al., 2007). However, residues taking part in protein–protein interactions may be regarded as core residues rather than surface residues.
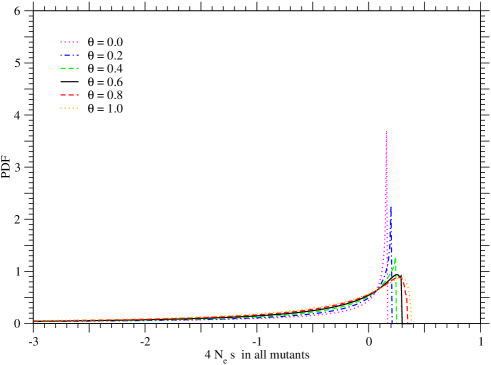
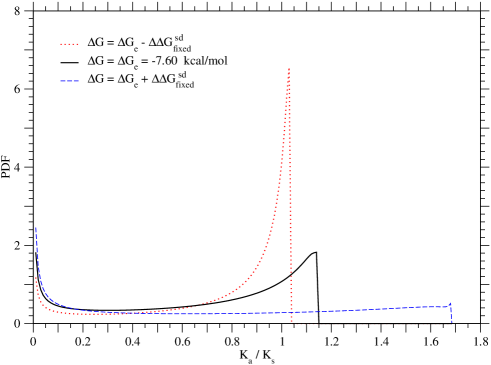
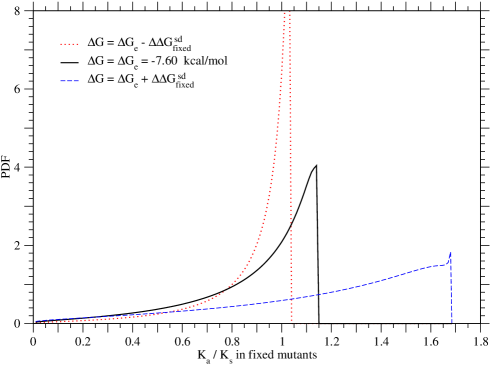
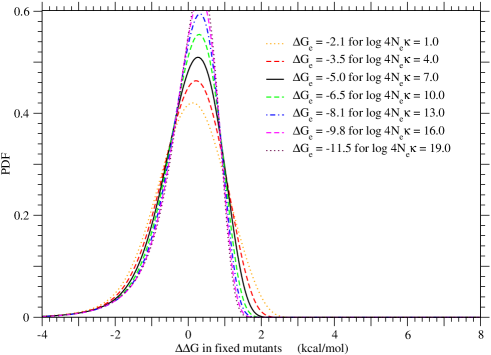
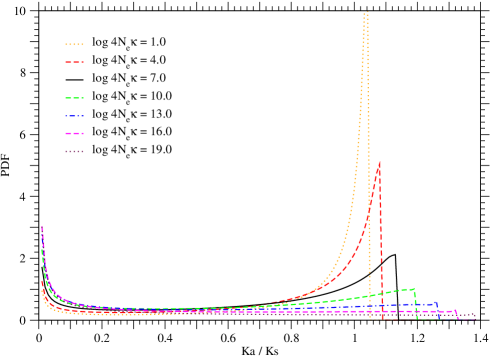
The dependence of the PDF, , of on is shown in Fig. 3. Also, the PDF of selective advantage, , is shown in Fig. S.4 to have a peak at a small, positive value of selective advantage, which moves toward more positive values as and/or increase.


3.2 Equilibrium state of protein stability in protein evolution
The fixation probability for a mutant gene with selective advantage and gene frequency in a duploid system of effective population size was given as a function of and by (Crow and Kimura, 1970)
| (25) |
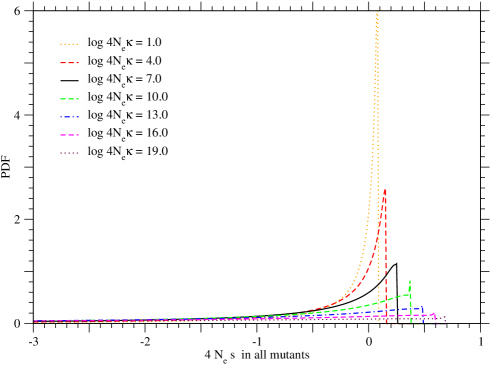
where for a single mutant gene in a population of size . Population size is taken to be . The ratio of the substitution rate per nonsynonymous site () for nonsynonymous substitutions with selective advantage to the substitution rate per synonymous site () for nonsynonymous substitutions with is
| (26) | |||||
| (27) |
assuming that synonymous substitutions are completely neutral and mutation rates at both types of sites are the same. Eqs. 19 and 25 indicate that can be regarded as a single parameter for . Furthermore, if the dependence of the mean on could be neglected, could be regarded as a single parameter. In the range of , both and the PDF of do not depend on ; see Eqs. 27 and S.15.
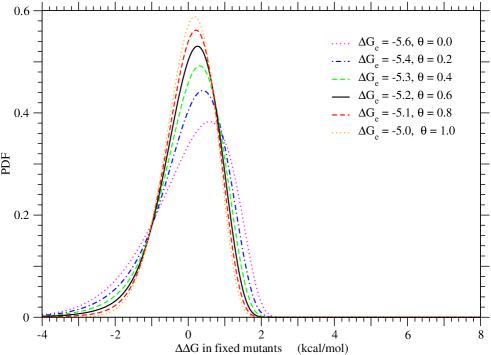
The PDF of of fixed mutant genes, , is
| (28) | |||||
| (29) |
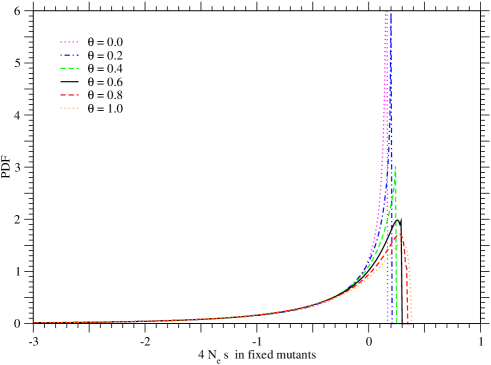
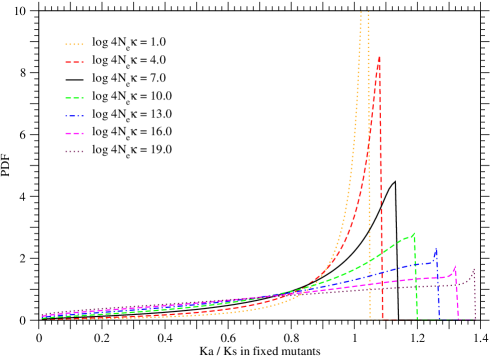
where is the average fixation rate. Fig. 3 shows the PDF of of fixed mutant genes. The PDF of in fixed mutants is also shown in Fig. S.4; . Then, the average of in fixed mutant genes can be calculated; .

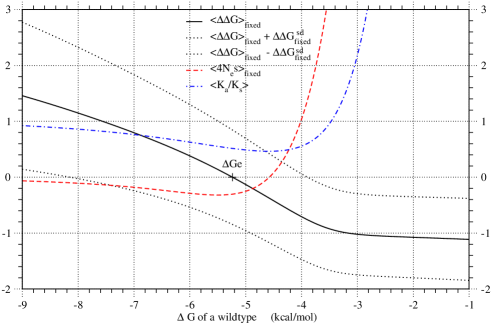
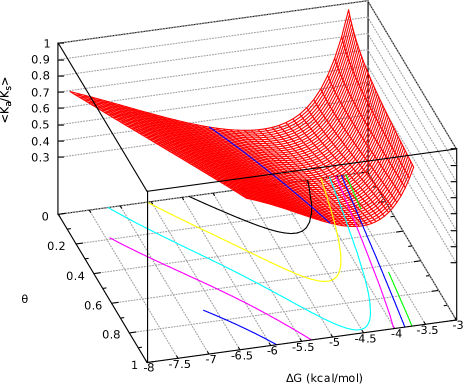
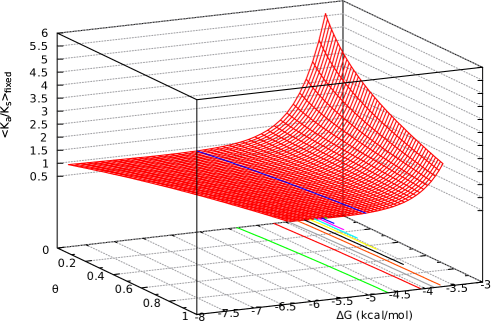
Fig. 4 shows the average of the over fixed mutant genes, , to monotonically decrease with , indicating that the temporal process of is stable at due to the balance between random drift on destabilizing mutations and positive selection on stabilizing mutations; is the folding free energy at the equilibrium state. If a wild-type protein becomes less stable than the equilibrium, , more stabilizing mutants will fix due to primarily positive selection and secondarily random drift, because stabilizing mutants will increase due to negative shifts of and also the effect of stability change on selective advantage will be more amplified; see Eqs. 23 and 24 for the dependence of on , and Eq. (19) for the fitness of stability change. As shown in Fig. S.6, the probability of , that is, positive selection, significantly increases as becomes more positive than the equilibrium stability . On the other hand, if a wild-type protein becomes more stable than the equilibrium, , more destabilizing mutants will fix due to random drift, because destabilizing mutants will increase due to positive shifts of and also more destabilizing mutants become nearly neutral due to the less-amplified effect of stability change on selective advantage. As shown later, the PDF of in the vicinity of equilibrium confirms this mechanism for maintaining protein stability at equilibrium.
It was claimed (Serohijos et al., 2012, 2013) that the equilibrium point would correspond to the minimum of the average fixation probability. However, in Fig. 4 for and , the average of selective advantage in fixed mutants has a minimum at kcal/mol and changes its sign at kcal/mol, where the average has a minimum and which is more positive than the equilibrium stability kcal/mol. In other words, Figs. 4 and S.16 show that the values of at and at the minimum of may be close but differ from each other, and indicate that the value of corresponding to the minimum of is not a good approximation for the equilibrium stability, because gently changes in the vicinity of the equilibrium stability as shown in Fig. S.16.

3.3 Equilibrium stability,
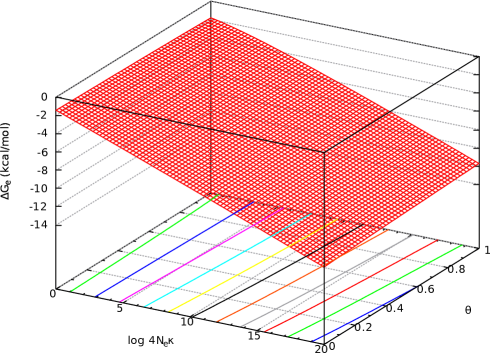
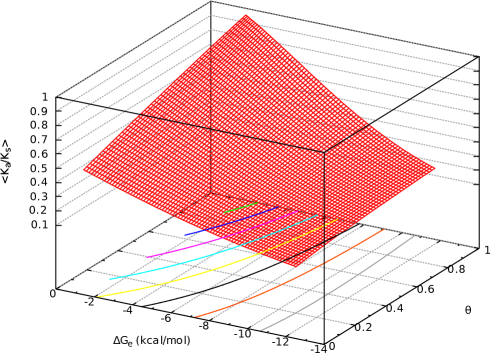
The equilibrium value, , of that satisfies = 0 in fixed mutants depends directly on and indirectly on through fixation probability; see Eqs. 19 and 25. As shown in Fig. 5, depends weakly on . On the other hand, depends more strongly on and is almost negatively proportional to , as also shown in real proteins (Serohijos et al., 2013). If the dependence of the means, and in Eqs. 23 and 24, of in all mutants on could be neglected, could be regarded as a single parameter, and so would be constant, irrespective of . Thus, the dependence of on shown in Fig. 5 is caused solely by the linear dependence of the means and of on (Serohijos et al., 2012). It is interesting to know that as varies from to , changes from to kcal/mol, the range of which is consistent with experimental values of protein folding free energies shown in Fig. 1.
3.4 at equilibrium,
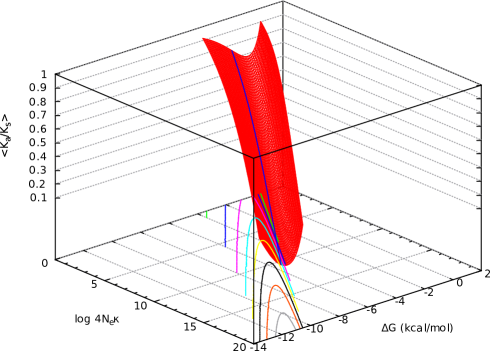
Equations 23 and 24 indicate that the distribution of shifts toward the positive direction as becomes more negative. Hence, increasing that makes more negative results in positive shifts of the distribution of , which increase destabilizing mutations. In addition, as indicated by Eq. (19), the upper bound of , , scales the effect of on protein fitness. The larger is, the larger the effect of on selective advantage becomes. Thus, the increase of caused by the increase of and/or increases both destabilizing mutations and their fitness costs, and results in slow evolutionary rates for proteins with large and/or . In other words, highly expressed and indispensable genes, and genes with a large effective population size must evolve slowly. On the other hand, the decrease of , that is, the increase of highly constrained residues directly shifts the average of in all arising mutants toward the positive direction, and causes slow evolutionary rates.
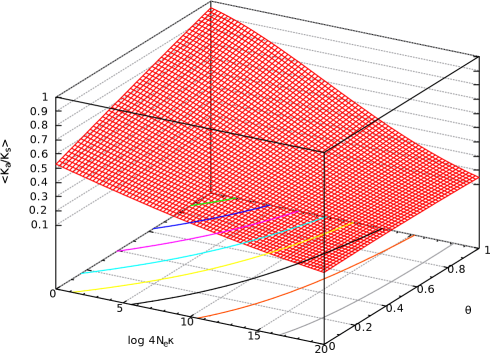
The average of over all mutants, which can be observed as the ratio of average nonsynonymous substitution rate per nonsynonymous site to average synonymous substitution rate per synonymous site, and also that over fixed mutants only are shown in Fig. 6. At any value of , decreases as increases, explaining the observed relationship that highly expressed and indispensable genes evolve slowly (Drummond et al., 2005; Drummond and Wilke, 2008; Serohijos et al., 2012). Likewise, at any value of , increases as increases. In other words, the more structurally constrained a protein is, the more slowly it evolves. The effect of protein abundance/indispensability on evolutionary rate is more remarkable for less constrained proteins and the effect of structural constraint is more remarkable for less abundant, less essential proteins.
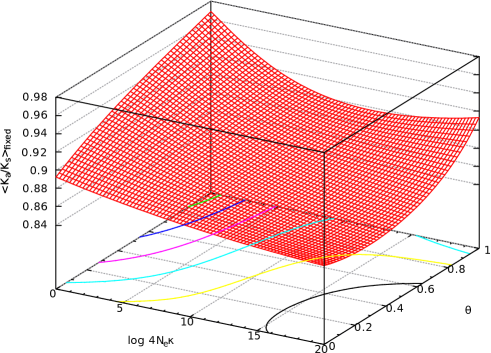
The average of over all mutants, , is less than 1.0 on the whole domain shown in the figure, indicating that the average of over a long time interval and over many sites should not show any positive selection. Even the average of over fixed mutants is less than 1.0, and falls into a narrow range of 0.97–0.85, which is much narrower than a range of 0.96–0.15 for that over all mutants; the average of over fixed mutants is equal to , and as a matter of course must be equal to or larger than the averages of over all mutants. However, the average of over a short time interval and over a small number of sites may exhibit values larger than one. In Fig. 7, the PDFs of for all mutants and also for fixed mutants only are shown; . A significant fraction of fixed mutants fix with .

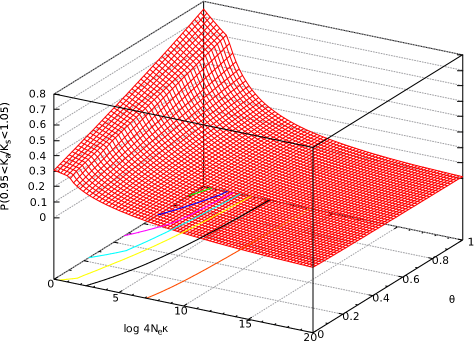
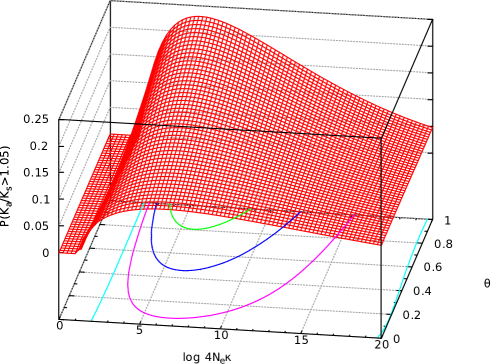
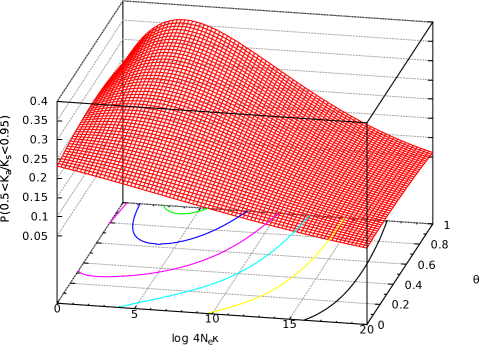
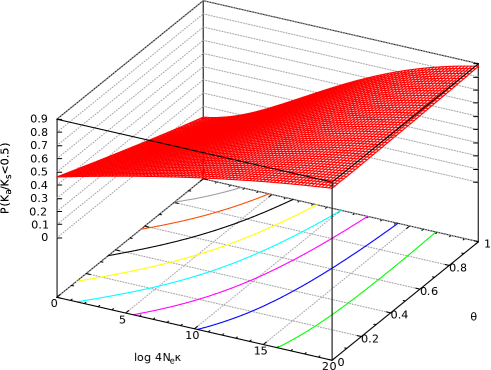
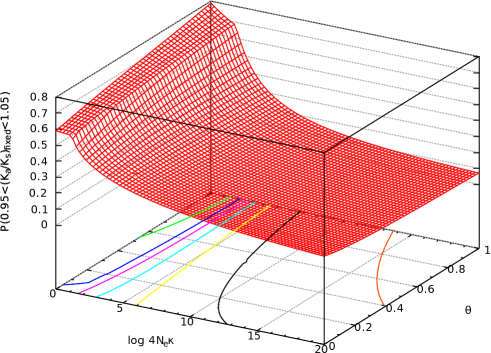
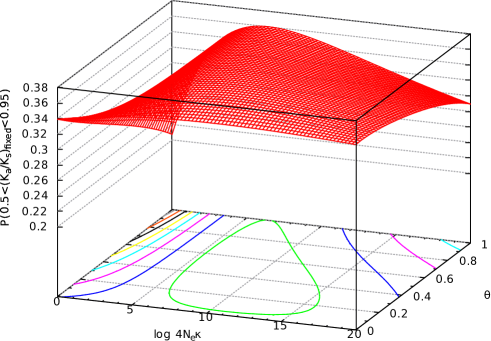
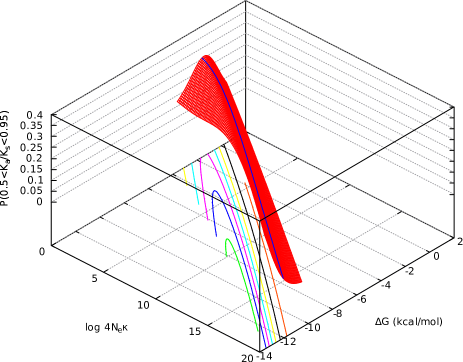
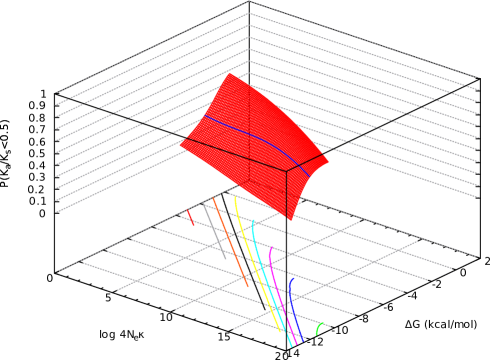
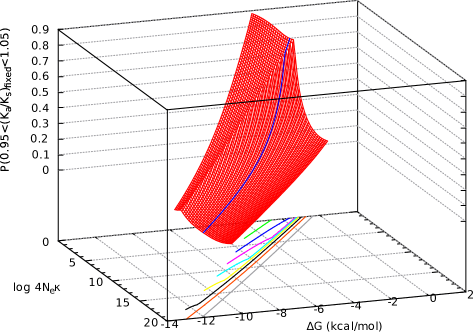
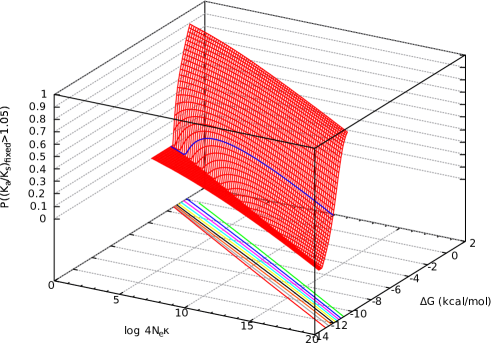
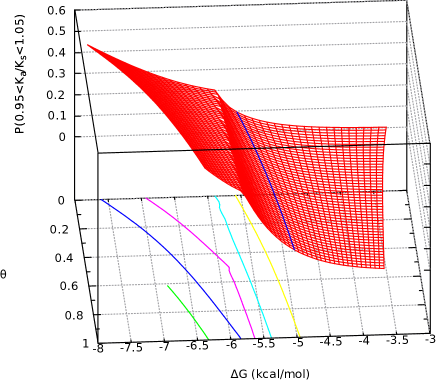
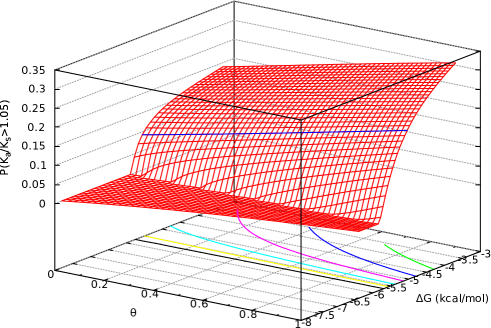
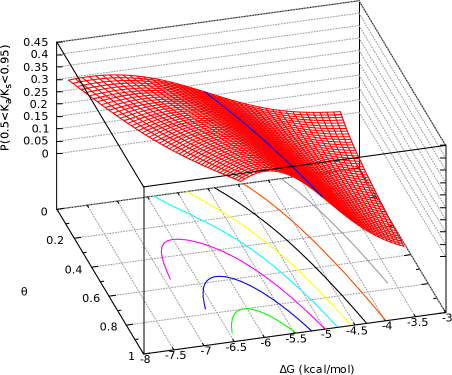
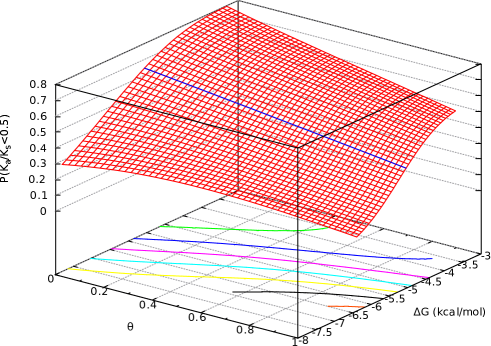
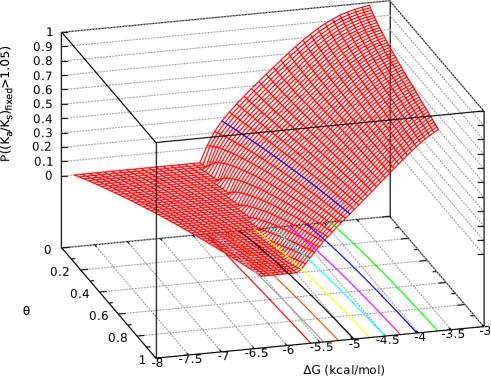
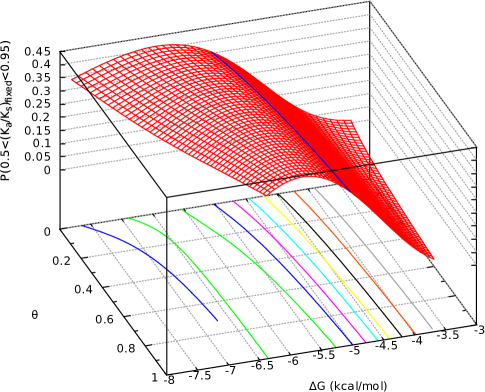
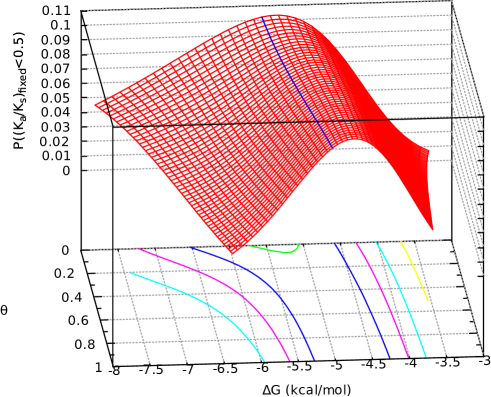
Arbitrarily, the value of is categorized into four classes; negative, slightly negative, nearly neutral, and positive selection categories whose are within the range of , , , and , respectively. Then, the probabilities of each selection category in all mutants and in fixed mutants are calculated and shown in Figs. S.10 and 8, respectively. At the largest abundance () most arising mutations are negative mutations whose are less than 0.5. This is reasonable, because at this condition the wild-type protein is very stable with low equilibrium values as shown in Fig. 5, and therefore most mutations destabilize the wild type and tend to be removed from population. Most fixed mutants are positive mutants or slightly negative mutants fixed by random drift. Nearly neutral mutants are less than 3% of all mutants, and less than 15% of fixed mutants.


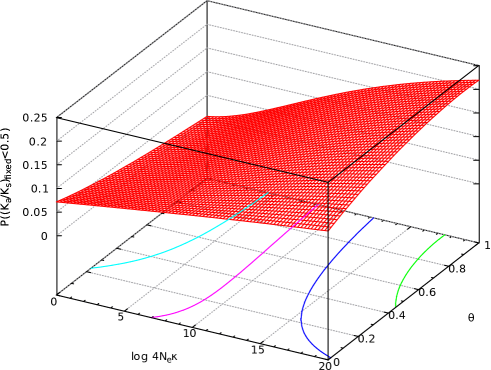
On the other hand, at the other extreme of , there are no mutations of the positive selection category, this is because the upper bound of , which corresponds to the upper bound () of , at the equilibrium stability becomes less than 1.05 that is the lower bound for the positive selection category; see Eq. (19). The significant amount of mutations become nearly neutral. As changes from 1 to 0, that is, structural constraints increase, the proportion of nearly neutral mutations changes from 0.75(0.56) to 0.31(0.22), and instead negative mutations increase and most of them are removed from population. Thus, the selection mechanism for fixing stabilizing mutants in little expressed, non-essential genes () is not positive selection but nearly neutral selection, that is, random drift.
The probability of each selection category in fixed mutants depends strongly on , but much less on . Current common understanding is that amino acid substitutions in protein evolution are either neutral (Kimura, 1968) or lethal, at most slightly deleterious (Ohta, 1973) or lethal, unless functional selection operates and functional changes occur. On the contrary, nearly neutral fixations are predominant only in proteins with or kcal/mol, and positive selection is significant in the other proteins. On the other hand, slightly negative selection is always significant. An interesting result is that the effects of structural constraint on are the most remarkable in proteins with or instead kcal/mol in which nearly neutral fixations are predominant.
3.5 in the vicinity of equilibrium
In Fig. 4, the standard deviation of of fixed mutants are also drawn. The standard deviation of of fixed mutants is equal to 0.84 kcal/mol at the equilibrium, , indicating that protein stability fluctuates more or less within kcal/mol instantaneously. Such a deviation from the equilibrium must be canceled by compensatory substitutions that consecutively occur, otherwise the protein stability would far depart from its equilibrium point.
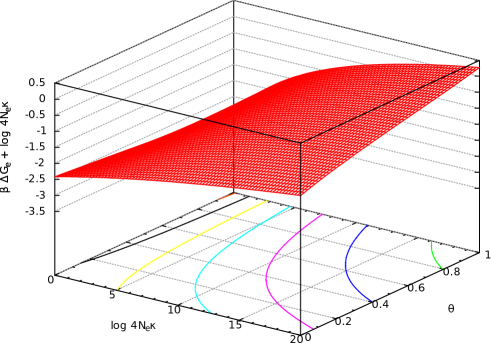
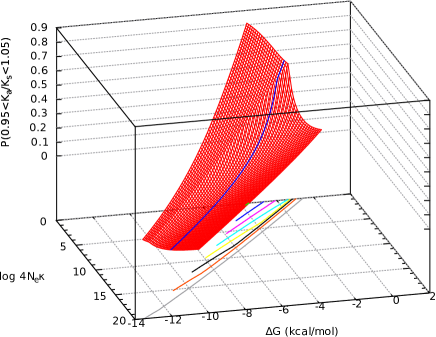
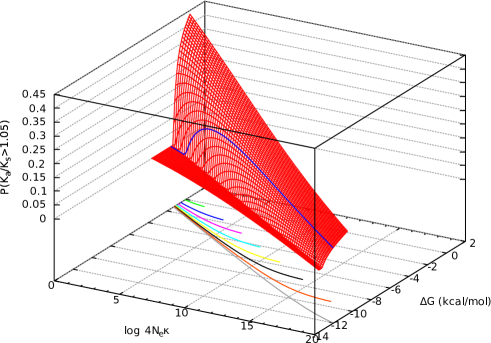
In Figs. 9 and 10 and Figs. S.12 and S.14, the probabilities of each selection category in fixed mutants and in all arising mutants are shown as a function of and or , respectively. The range of around shown by a blue line on the surface grid is within two times of the standard deviation of over fixed mutants at .


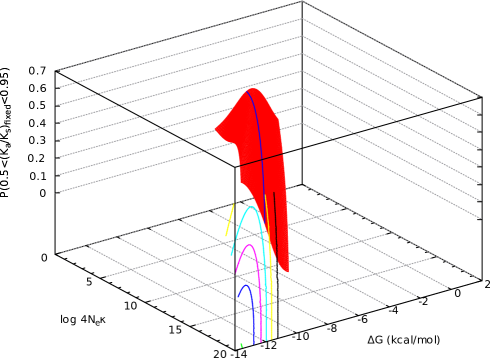
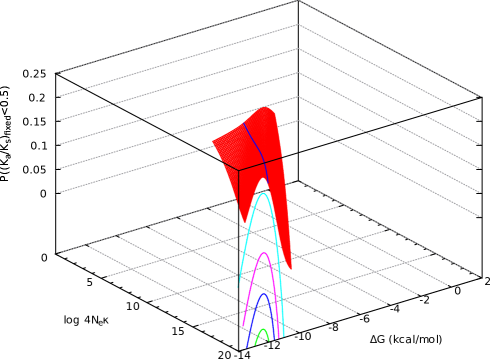
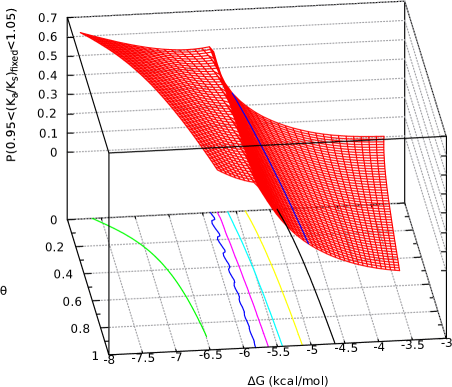
As indicated by Eqs. 23 and 24, it is shown in Figs. S.12 and S.14 that stabilizing mutations increase due to negative shifts of as the wild type becomes less stable than the equilibrium, , and that destabilizing mutations increase due to positive shifts of as . In addition, as indicated by Eq. (19), it is shown in Figs. 9 and 10 that positive selection on stabilizing mutants is more amplified as , and that more destabilizing mutations become nearly neutral due to the less-amplified effect of stability change on selective advantage as . This is a mechanism of maintaining protein stability at equilibrium.


3.6 Lower bound of for adaptive substitutions on protein function
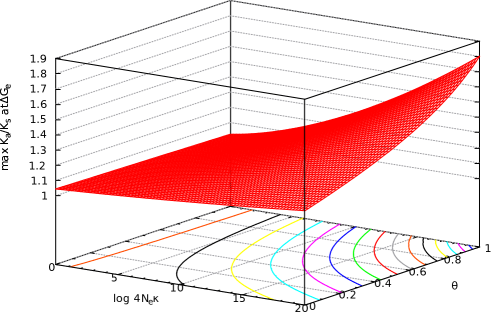
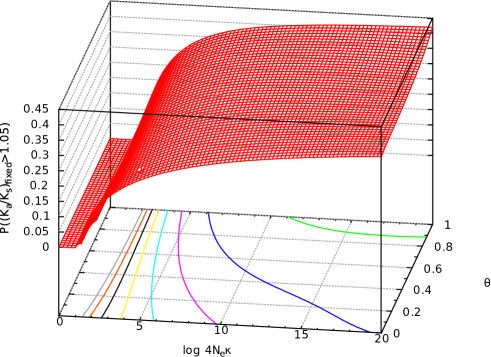
The observed value of is often used to indicate functional selection. The averages of over all mutants and even over fixed mutants are less than 1 as shown in Fig. 6. Therefore, the average of over long time or many sites does not indicate positive selection. However, the probability of is not negligible as shown in Figs. 7 and 8. Then, a question is how large due to selection on protein stability can be.
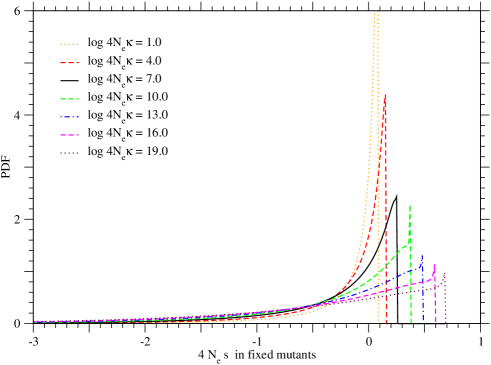
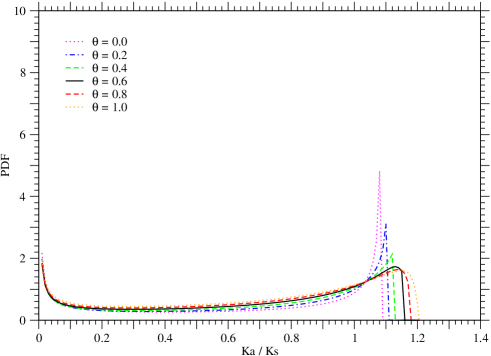
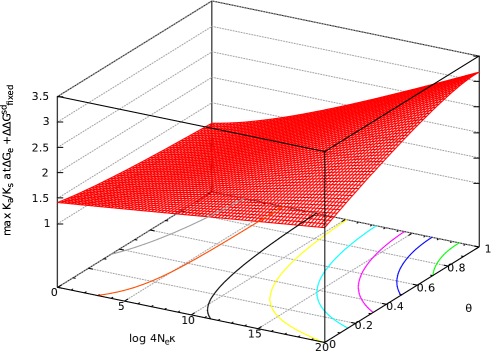
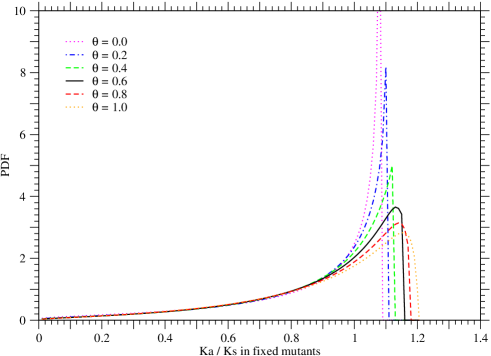
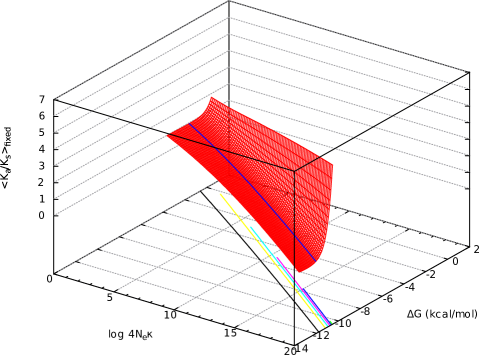
The distribution of significantly changes with , as shown in Figs. S.6 and 11. It may be appropriate to see the average of , , in mutants fixed at , because the upper bound of becomes larger for than at the equilibrium, and also positive mutants must fix to improve the protein stability of the wild type. Fig. 11 shows that can be very large for proteins with low equilibrium stabilities (large and small ), although in in which nearly neutral and slightly negative selections are predominant; 1.7(1.2) at and 6.1(5.6) at for (), where means the standard deviation of in fixed mutants at . The 85 % of fixed mutants have within the standard deviation. Therefore, a lower bound for adaptive substitutions may be taken to be about 1.7, which is almost equal to the upper bound of at the equilibrium for and ; see Fig. S.17. However, as shown in Fig. S.17, the more genes are expressed and/or the stronger structural constraints are, the larger the upper bound of at the equilibrium is. Judging of adaptive changes may need not only but also other supporting evidences; such that substitutions are localized at specific sites.

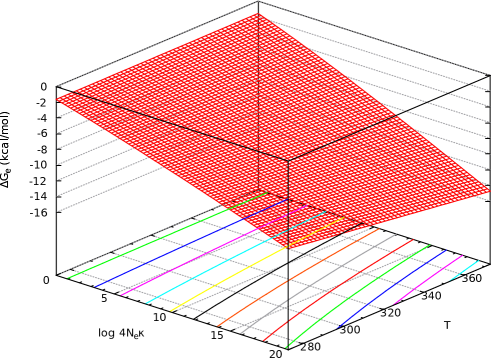
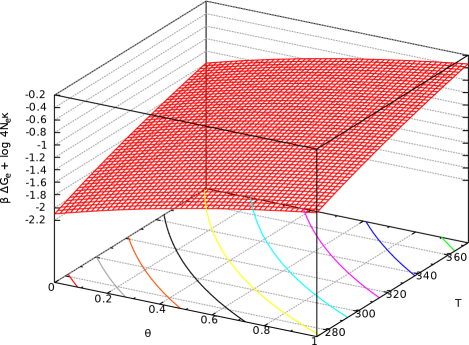
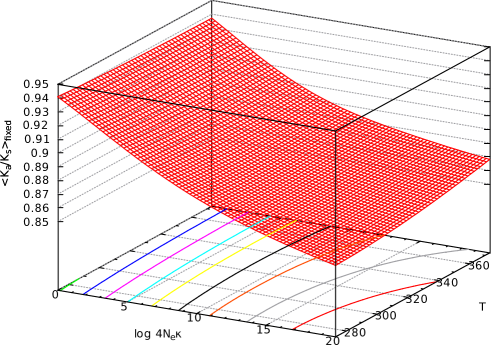
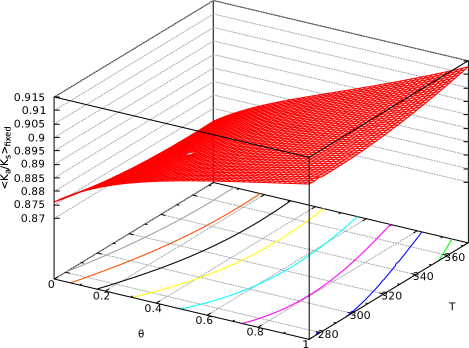
3.7 Dependences of protein stability () and evolutionary rate () on growth temperature
It is natural that the folding free energies, , of proteins in organisms growing at higher temperatures must be lower than those at the normal temperature, in order to attain the same stabilities and fitnesses as in the normal temperature. Equations 2 and 15 indicate that the same stability and fitness will be attained if is constant. It means that it is sufficient for at the to decrease times of that at the normal temperature (). Is this a figure expected for folding free energies of thermophilic proteins at high growth temperature? It is not enough data of at high temperature in the ProTherm (Kumar et al., 2006) to answer this question; kcal/mol for oxidized and for reduced CuA domain of cytochrome oxidase from Thermus thermophilus (Wittung-Stafshede et al., 1998) and kcal/mol for pyrrolidone carboxyl peptidase from Pyrococcus (Ogasahara et al., 1998). The present model indicates that slightly increases as growth temperature increases.
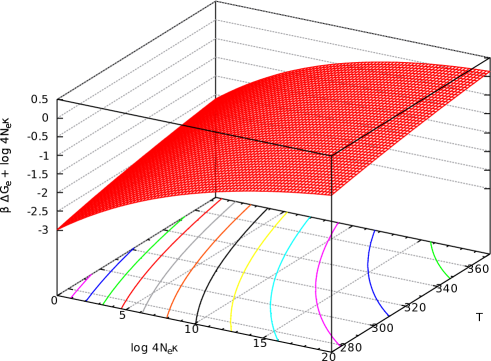
In Figs. 12 and S.18, is shown as a function of absolute temperature and or , assuming that the distribution of and its dependency on do not depend on , that is, Eqs. 22, 23 and 24. At fixed values of and , increases as increases, meaning that protein stability, , decreases as growth temperature increases. This tendency is slightly larger at smaller values of , that is, for less abundant proteins.
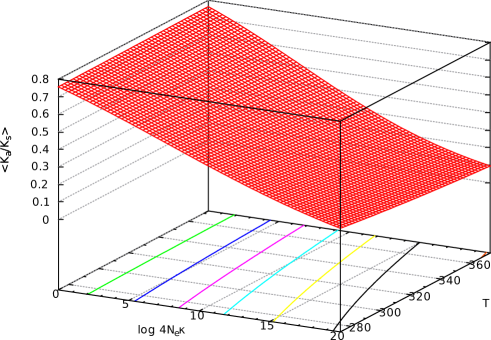
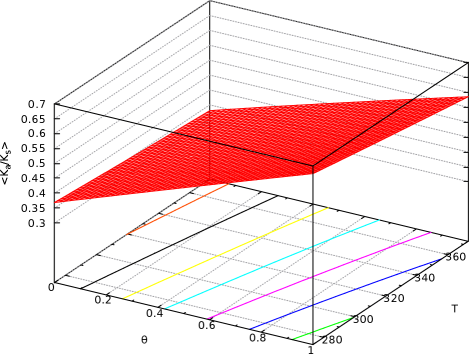
The effects of growth temperature on are shown in Fig. S.19. The present model predicts that decreases as growth temperature increases unless any other parameter does not change.
4 Discussion
Recently, fitness costs due to misfolded proteins have been widely noticed, particularly neurological disorder linked to misfolded protein toxicity (Bucciantini et al., 2002). Fitness costs that originate in functional loss (Geiler-Samerotte et al., 2011) and in diversion of protein synthesis and aggregation of proteins have been evaluated (Drummond and Wilke, 2008) to be related to the proportion of misfolded proteins. Also, previous studies indicate that factors that relate protein stability to protein fitness are protein abundance, protein indispensability, and structural constraints of protein. Current knowledge of protein folding can provide an exact formulation for the proportion of misfolded proteins as a function of folding free energy, and reasonable predictions (Schymkowitz et al., 2005; Yin et al., 2007; Tokuriki et al., 2007) of stability changes due to single amino acid substitutions in protein native structures. Thus, on the basis of knowledge of protein biophysics it became possible to study the effects of amino acid substitutions on protein stability and then the evolution of protein (Drummond and Wilke, 2008; Serohijos et al., 2012; Serohijos and Shakhnovich, 2014; Echave et al., 2015; Faure and Koonin, 2015).
Here, the effects of protein abundance and indispensability () and of structural constraint () on protein evolutionary rate () have been examined in detail. Both the effects are represented with different functional forms. Structural constraints affect the distribution of stability change due to mutations. On the other hand, protein abundance/indispensability affects the effectiveness of stability change on protein fitness as well as the distribution of .
The common understanding of protein evolution has been that amino acid substitutions found in homologous proteins are selectively neutral (Kimura, 1968, 1969; Kimura and Ohta, 1971, 1974) or slightly deleterious (Ohta, 1973, 1992), and random drift is a primary force to fix amino acid substitutions in population. However, there is a selection maintaining protein stability at equilibrium (Drummond and Wilke, 2008; Serohijos et al., 2012; Serohijos and Shakhnovich, 2014). From the present analysis of the PDF of , it has become clear how the equilibrium of stability is maintained; see Figs. 9 and 10. In less-stable proteins of , more stabilizing mutations fix due to positive selection, because negative shifts of increase stabilizing mutants and also more amplify the effect of stability change on selective advantage; see Eqs. 23, 24 and 19. In more-stable proteins of , more destabilizing mutants are fixed by random drift, because positive shifts of increase destabilizing mutants and also make more destabilizing mutants nearly neutral with the less-amplified effect of stability change on selective advantage. It has been revealed that contrary to the neutral theory nearly neutral selection is predominant only in low-abundant, non-essential proteins with or with low equilibrium stability ( kcal/mol); see Fig. 8.
The average and even at equilibrium stability are less than one over the whole parameter range; see Fig. 6. Hence, as far as selection is on protein stability, the average of over a long time interval and over many sites will be expected to be less than one, if all synonymous mutations are neutral (Spielman and Wilke, 2015). However, because the probability of is significant, branches with in phylogenetic trees may be observed, as observed in a population dynamics simulation (Serohijos and Shakhnovich, 2014), even though synonymous mutations are neutral and no adaptive selection operates on protein function. According to the present estimate, a lower bound of to indicate adaptive substitutions must be at least as large as 1.7.
Protein equilibrium stability () has been clearly described here as a function of and . The more expressed a gene is (the larger is), the stabler the wild-type protein at equilibrium is (the more negative becomes); see Fig. 5. The decrease of shifts the distribution of toward the positive direction, generating more highly destabilizing mutants; see Eqs. 23 and 24. In addition, as increases, the net effect, , increases and more amplifies the effects of stability changes () on selective advantage (); see Fig. 5 and Eq. (19). As a result, highly expressed and indispensable genes, and genes with a large effective population size evolve slowly; see Fig. 6. However, if the distribution of did not depend on , would be constant, and would not depend on , that is, protein abundance/indispensability and effective population size.
On the other hand, structural constraints on protein affect protein evolutionary rate by changing the distribution of due to amino acid substitutions. As shown in Fig. 6, at any value of , decreases as decreases. In other word, the more a protein is structurally constrained, the more slowly it evolves, as claimed by Zuckerkandl (Zuckerkandl, 1976). Fig. 6 shows that the effect of protein abundance/indispensability on evolutionary rate is more remarkable for less constrained proteins, and the effect of structural constraint is more remarkable for less abundant, less essential proteins.
In the result, the average of over all arising mutants decreases roughly by as increases from 0 to 20; see Fig. 6. On the other hand, it decreases by as the proportion of the residues of the surface type, , decreases from 1 to 0. For monomeric, globular proteins, the proportion of protein surface may range from 0.7 to 0.45. Thus, in typical globular proteins, protein abundance/indispensability may cause larger differences of evolutionary rate between proteins than structural constraint. However, proteins that interact with other molecules on protein surface effectively reduce residues of the protein-surface type (Franzosa and Xia, 2009). Both protein abundance/indispensability and structural constraint must be taken into account for protein evolutionary rate.
Protein abundance and indispensability both affect evolutionary rate similarly through protein fitness. It was shown in real proteins that protein abundance correlates with evolutionary rate (Pál et al., 2001). The present model of protein fitness (Eq. (19)) also indicates that protein indispensability must correlate with evolutionary rate (Hirsh and Fraser, 2001, 2003), but a correlation between them may be hidden by the variation of protein abundance and detected only in low-abundant proteins (Pál et al., 2003); see Eq. (21). In addition, effective population size must affect and together with as .
In the present model, protein equilibrium stability () and evolutionary rate () are predictable from and . The proportion of the surface type of residues may be estimated as those whose surface accessibility values (ASA) are less than 0.25 (Tokuriki et al., 2007), but experimental measurements of protein abundance, indispensability, and effective population size to determine may be relatively hard. Instead the experimental value of protein stability may be employed as equilibrium stability to predict evolutionary rate and others, although it is not an independent variable. Fig. 13 shows evolutionary rate as a function of and . Needless to say, mutational effects on , such as and the distribution of , must be well estimated for various categories of proteins (Faure and Koonin, 2015) to obtain successful predictions. Also, accurate estimations of for various proteins are needed to examine the present predictions. It is interesting to examine if protein stability () and decrease as growth temperature increases.
5 Conclusions
-
1.
The range, to kcal/mol, of equilibrium values, , of protein stability calculated with the present fitness model is consistent with the distribution of experimental values shown in Fig. 1.
-
2.
Contrary to the neutral theory, nearly neutral selection is predominant only in low-abundant, non-essential proteins of or kcal/mol. In the other proteins, positive selection on stabilizing mutations is significant to maintain protein stability at equilibrium as well as random drift on slightly negative mutations. However, and even at are less than 1.
-
3.
Protein abundance/indispensability () and effective population size () more affect evolutionary rate for less constrained proteins, and structural constraint () for less abundant, less essential proteins.
-
4.
Protein indispensability must negatively correlate with evolutionary rate like protein abundance, but the correlation between them may be hidden by the variation of protein abundance and detected only in low-abundant proteins.
-
5.
Evolutionary rates of proteins may be predicted from equilibrium stability () and structural constraints (PDF of ) of the protein.
-
6.
The present model indicates that protein stability () and decrease as growth temperature increases.
References
- Bucciantini et al. (2002) Bucciantini, M., Giannoni, E., Chiti, F., Baroni, F., Formigli, L., Zurdo, J., Taddei, N., Ramponi, G., Dobson, C. M., Stefani, M., 2002. Inherent toxicity of aggregates implies a common mechanism for protein misfolding diseases. Nature 416, 507–511.
- Crow and Kimura (1970) Crow, J. F., Kimura, M., 1970. An Introduction to population genetics theory. Harper & Row publishers, New York.
- Dasmeh et al. (2014) Dasmeh, P., Serohijos, A. W., Kepp, K. P., Shakhnovich, E. I., 2014. The influence of selection for protein stability on dN/dS estimations. Genome Biol. Evol. 6, 2956–2967.
- Drummond et al. (2005) Drummond, D. A., Bloom, J. D., Adami, C., Wilke, C. O., Arnold, F. H., 2005. Why highly expressed proteins evolve slowly. Proc. Natl. Acad. Sci. USA 102 (40), 14338–14343.
-
Drummond and Wilke (2008)
Drummond, D. A., Wilke, C. O., 2008. Mistranslation-induced protein misfolding
as a dominant constraint on coding-sequence evolution. Cell 134 (2), 341 –
352.
URL http://dx.doi.org/10.1016/j.cell.2008.05.042 - Duret and Mouchiro (2000) Duret, L., Mouchiro, D., 2000. Determinants of substitution rates in mammalian genes: expression pattern affects selection intensity but not mutation rate. Mol. Biol. Evol. 17, 68–85.
-
Echave et al. (2015)
Echave, J., Jackson, E. L., Wilke, C. O., 2015. Relationship between protein
thermodynamic constraints and variation of evolutionary rates among sites.
Phys. Biol. 12 (2), 025002.
URL http://stacks.iop.org/1478-3975/12/i=2/a=025002 -
Faure and Koonin (2015)
Faure, G., Koonin, E. V., 2015. Universal distribution of mutational effects on
protein stability, uncoupling of protein robustness from sequence evolution
and distinct evolutionary modes of prokaryotic and eukaryotic proteins. Phys.
Biol. 12 (3), 035001.
URL http://stacks.iop.org/1478-3975/12/i=3/a=035001 - Franzosa and Xia (2009) Franzosa, E. A., Xia, Y., 2009. Structural determinants of protein evolution are context-sensitive at the residue level. Mol. Biol. Evol. 26, 2387–2395.
- Fraser et al. (2002) Fraser, H. B., Hirsh, A. E., Steinmetz, L. M., Scharfe, C., Feldman, M. W., 2002. Evolutionary rate in the protein interaction network. Science 296, 750–752.
- Geiler-Samerotte et al. (2011) Geiler-Samerotte, K. A., Dion, M. F., Budnik, B. A., Wang, S. M., Hartl, D. L., Drummond, D. A., 2011. Misfolded proteins impose a dosage-dependent fitness cost and trigger a cytosolic unfolded protein response in yeast. Proc. Natl. Acad. Sci. USA 108, 680–685.
- Ghaemmaghami et al. (2003) Ghaemmaghami, S., Huh, W.-K., Bower, K., Howson, R. W., Belle, A., Dephoure, N., ÓShea, E. K., Weissman, J. S., 2003. Global analysis of protein expression in yeast. Nature 425, 737–741.
- Go and Miyazawa (1980) Go, M., Miyazawa, S., 1980. Relationship between mutability, polarity and exteriority of amino acid residues in protein evolution. Int. J. Peptide Protein Res. 15, 211–224.
- Hirsh and Fraser (2001) Hirsh, A. E., Fraser, H. B., 2001. Protein dispensability and rate of evolution. Nature 411, 1047–1049.
- Hirsh and Fraser (2003) Hirsh, A. E., Fraser, H. B., 2003. Genomic function (communication arising): Rate of evolution and gene dispensability. Nature 421, 497–498.
- Jordan et al. (2002) Jordan, I. K., Rogozin, I. B., Wolf, Y. I., Koonin, E. V., 2002. Essential genes are more evolutionarily conserved than are nonessential genes in bacteria. Genome Res. 12, 962–968.
- Kimura (1968) Kimura, M., 1968. Evolutionary rate at the molecular level. Nature 217, 624–626.
- Kimura (1969) Kimura, M., 1969. The rate of molecular evolution considered from the standpoint of population genetics. Proc. Natl. Acad. Sci. USA 63, 1181–1188.
- Kimura and Ohta (1971) Kimura, M., Ohta, T., 1971. Protein polymorphism as a phase of molecular evolution. Nature 229, 467–469.
- Kimura and Ohta (1974) Kimura, M., Ohta, T., 1974. On some principles governing molecular evolution. Proc. Natl. Acad. Sci. USA 71, 2848–2852.
- Kuma et al. (1995) Kuma, K., Iwabe, N., Miyata, T., 1995. Functional constraints against variations on molecules from the tissue level: slowly evolving brain-specific genes demonstrated by protein kinase and immunoglobulin supergene families. Mol. Biol. Evol. 12, 123–130.
- Kumar et al. (2006) Kumar, M., Bava, K., Gromiha, M., Prabakaran, P., Kitajima, K., Uedaira, H., Sarai, A., 2006. ProTherm and ProNIT: thermodynamic databases for proteins and protein-nucleic acid interactions. Nucl. Acid Res. 34, D204–D206.
- Lynch and Conery (2003) Lynch, M., Conery, J. S., 2003. The origins of genome complexity. Science 302, 1401–1404.
- Miyata and Yasunaga (1980) Miyata, T., Yasunaga, T., 1980. Molecular evolution of mRNA: a method for estimating evolutionary rates of synonymous and amino acid substitutions from homologous nucleotide sequences and its applications. J. Mol. Evol. 16, 23–36.
- Miyazawa and Jernigan (1982a) Miyazawa, S., Jernigan, R. L., 1982a. Equilibrium folding and unfolding pathways for a model protein. Biopolymers 21, 1333–1363.
- Miyazawa and Jernigan (1982b) Miyazawa, S., Jernigan, R. L., 1982b. Most probable intermediates in protein folding-unfolding with a non-interacting globule-coil model. Biochemistry 21, 5203–5213.
- Ogasahara et al. (1998) Ogasahara, K., Nakamura, M., Nakura, S., Tsunasawa, S., Kato, I., Yoshimoto, T., Yutani, K., 1998. The unusually slow unfolding rate causes the high stability of pyrrolidone carboxyl peptidase from a hyperthermophile, Pyrococcus furiosus: equilibrium and kinetic studies of guanidine hydrochloride-induced unfolding and refolding. Biochemistry 37, 17537–17544.
- Ohta (1973) Ohta, T., 1973. Slightly deleterious mutant substitutions in evolution. Nature 246, 96–98.
- Ohta (1992) Ohta, T., 1992. The nearly neutral theory of molecular evolution. Annu. Rev. Ecol. Syst. 23, 263–286.
- Pál et al. (2001) Pál, C., Papp, B., Hurst, L. D., 2001. Highly expressed genes in yeast evolve slowly. Genetics 158, 927–931.
- Pál et al. (2003) Pál, C., Papp, B., Hurst, L. D., 2003. Genomic function (communication arising): Rate of evolution and gene dispensability. Nature 421, 496–497.
- Schymkowitz et al. (2005) Schymkowitz, J., Borg, J., Stricher, F., Nys, R., Rousseau, F., Serrano, L., 2005. The FoldX web server: an online force field. Nucl. Acid Res. 33, W382–W388.
-
Serohijos et al. (2012)
Serohijos, A., Rimas, Z., Shakhnovich, E., 2012. Protein biophysics explains
why highly abundant proteins evolve slowly. Cell Reports 2 (2), 249 – 256.
URL http://dx.doi.org/10.1016/j.celrep.2012.06.022 -
Serohijos et al. (2013)
Serohijos, A., S. Y. Ryan Lee, Shakhnovich, E., 2013. Highly abundant
proteins favor more stable 3D structures in yeast. Biophys. J.
104 (3), L1 – L3.
URL http://dx.doi.org/10.1016/j.bpj.2012.11.3838 - Serohijos and Shakhnovich (2014) Serohijos, A. W., Shakhnovich, E. I., 2014. Contribution of selection for protein folding stability in shaping the patterns of polymorphisms in coding regions. Mol. Biol. Evol. 31, 165–176.
- Spielman and Wilke (2015) Spielman, S. J., Wilke, C. O., 2015. The relationship between dN/dS and scaled selection coefficients. Mol. Biol. Evol. 32, 1097–1108.
- Stoebel et al. (2008) Stoebel, D. M., Dean, A. M., Dykhuizen, D. E., 2008. The cost of expression of Escherichia coli lac operon proteins ss in the process, not in the product. Genetics 178, 1653–1660.
- Tokuriki et al. (2007) Tokuriki, N., Stricher, F., Schymkowitz, J., Serrano, L., Tawfik, D. S., 2007. The stability effects of protein mutations appear to be universally distributed. J. Mol. Biol. 369, 1318–1332.
- Wall et al. (2005) Wall, D. P., Hirsh, A. E., Fraser, H. B., Kumm, J., Giaever, G., Eisen, M. B., Feldman, M. W., 2005. Functional genomic analysis of the rates of protein evolution. Proc. Natl. Acad. Sci. USA 102, 5483–5488.
- Wittung-Stafshede et al. (1998) Wittung-Stafshede, P., Malmstrom, B. G., Sanders, D., Fee, J. A., Winkler, J. R., Gray, H. B., 1998. Effect of redox state on the folding free energy of a thermostable electron-transfer metalloprotein: the CuA domain of cytochrome oxidase from thermus thermophilus. Biochemistry 37, 3172–3177.
- Yang et al. (2012) Yang, J.-R., Liao, B.-Y., Zhuang, S.-M., Zhang, J., 2012. Protein misinteraction avoidance causes highly expressed proteins to evolve slowly. Proc. Natl. Acad. Sci. USA 109, E831–E840.
- Yin et al. (2007) Yin, S., Ding, F., Dokholyan, N. V., 2007. Eris: an automated estimator of protein stability. Nature Methods 4, 466–467.
- Zeldovich et al. (2007) Zeldovich, K. B., Chen, P., Shakhnovich, E. I., 2007. Protein stability imposes limits on organism complexity and speed of molecular evolution. Proc. Natl. Acad. Sci. USA 104, 16152–16157.
- Zhang and He (2005) Zhang, J., He, X., 2005. Significant impact of protein dispensability on the instantaneous rate of protein evolution. Mol. Biol. Evol. 22, 1147–1155.
- Zuckerkandl (1976) Zuckerkandl, E., 1976. Evolutionary processes and evolutionary noise at the molecular level. J. Mol. Evol. 7, 167–183.
Supplementary material
for ”Selection maintaining protein stability at equilibrium”,
Journal Theoretical Biology
(doi:10.1016/j.jtbi.2015.12.001)
Sanzo Miyazawa
sanzo.miyazawa@gmail.com
Malthusian fitness originating in protein stability in the present model
For typical proteins whose folding free energy satisfies , without loss of generality we can assume the Malthusian fitness of the single protein-coding genes to be equal to
| (S.1) |
where , is the Boltzmann constant, is absolute temperature, and is a parameter whose meaning may depend on the situation; refer to Method for details. If the fitness costs of functional loss and toxicity due to misfolded proteins are both taken into account and assumed to be additive in the Malthusian fitness scale, will be defined as
| (S.2) |
where is fitness cost per misfolded protein (Geiler-Samerotte et al., 2011), is the cellular abundance of a protein (Geiler-Samerotte et al., 2011), and is indispensability (Drummond and Wilke, 2008) and defined as deletion-strain growth rate / max growth rate. The parameter is assumed in the present analysis to take values in the range of with effective population size , taking account of the values of the parameters, (Drummond and Wilke, 2008), (Ghaemmaghami et al., 2003), for essential genes (Drummond and Wilke, 2008), and to for vertebrates, to for invertebrates, to for unicellular eukaryotes, and for prokaryotes (Lynch and Conery, 2003).
Then, the selective advantage of a mutant protein is given as follows in Malthusian parameters as a function of the folding free energy () of the wild-type protein, the stability change () of a mutant protein, and the parameter ;
| (S.3) |
Equation (S.3) indicates that is upper-bounded.
| (S.4) |
Distribution of stability changes () due to single amino acid substitutions
Here, according to (Tokuriki et al., 2007), the distribution of folding free energy changes, , of mutant proteins is assumed to be a bi-Gaussian function with mean depending on , in order to take into account the effects of structural constraint on evolutionary rate. The probability density function (PDF), , of for nonsynonymous substitutions is defined as
| (S.5) |
where , and is a normal distribution with mean and standard deviation . One of the two Gaussian distributions above, , results from substitutions on protein surfaces and is a narrow distribution with a mildly destabilizing mean , whereas the other, , due to substitutions in protein cores is a wider distribution with a stronger destabilizing mean (Tokuriki et al., 2007). Since the majority of substitutions appear to be single nucleotide substitutions, the values of standard deviations ( and ) estimated in (Tokuriki et al., 2007) for single nucleotide substitutions are employed here; in kcal/mol units,
| (S.6) | |||||
| (S.7) |
To analyze the dependences of the means, and , on , we plotted the observed values of of single amino acid mutants against of the wild type, which are collected in the ProTherm database (Kumar et al., 2006); the same analysis was done in (Serohijos et al., 2012). Fig. S.2 shows a significant dependence of on ; the regression line is . The linear slopes of and are taken to be equal to the slope () of the regression line. The intercepts have been estimated to satisfy the following two conditions.
- 1.
-
2.
The total mean of the two Gaussian functions agrees with the regression line, . The value of is taken to be , which is equal to the average of over proteins used in (Tokuriki et al., 2007).
A representative value, , of is determined in such way that the equilibrium value of is equal to introduced above. It is interesting that this value kcal/mol agrees with the most probable value of in the observed distribution of protein stabilities shown in Fig. 1. The fraction of less-constrained residues such as most residues on protein surface is correlated with protein length for globular, monomeric proteins (Tokuriki et al., 2007); . (Tokuriki et al., 2007). However, residues taking part in protein–protein interactions may be regarded as core residues rather than surface residues.
Probability distributions of selective advantage, fixation rate and
Now, we can consider the probability distributions of characteristic quantities that describe the evolution of genes. First of all, the PDF of selective advantage , , of mutant genes can be represented by
| (S.8) | |||||
where must be regarded as a function of , that is, . The PDF of , , may be more useful than .
| (S.9) |
The fixation probability of a mutant gene with selective advantage and gene frequency in a duploid system is equal to (Crow and Kimura, 1970)
| (S.10) |
where for a single mutant gene in a population of size . Population size is taken to be . Thus, the PDF of fixation probability can be represented by
| (S.11) | |||||
where must be regarded as a function of .
The ratio of the substitution rate per nonsynonymous site () for nonsynonymous substitutions with selective advantage s to the substitution rate per synonymous site () for nonsynonymous substitutions with s = 0 is
| (S.12) | |||||
| (S.13) |
assuming that synonymous substitutions are completely neutral and mutation rates at both types of sites are the same. The PDF of is
| (S.14) | |||||
| (S.15) |
In the range of , both and do not depend on .
Probability distributions of , , , and in fixed mutant genes
Now, let us think about fixed mutant genes. The PDF of the of fixed mutant genes is
| (S.16) | |||||
| (S.17) | |||||
| (S.18) |
Likewise, the PDF of the selective advantage of fixed mutant genes is
| (S.19) |
and those of the and of fixed mutant genes are
| (S.20) | |||||
| (S.21) |
Then, the probabilities of and the averages of over all mutants and also in fixed mutants can be calculated. The average of in fixed mutants is equal to the ratio of the second moment to the first moment of in all arising mutants.
| (S.22) |