Title111
The and of muons from heavy-quark decays in \cePb+\cePb collisions at =2.76 TeV with the ATLAS detector
Abstract
The ATLAS experiment measures the production of muons coming from the decays of heavy flavour particles in the kinematic interval GeV and . The measurement is performed in TeV collisions and over the centrality range of (0–60)% in TeV \cePb+\cePb collisions. The heavy flavour muon differential cross-sections and per-event yields are measured in and \cePb+\cePb collisions, respectively. The nuclear modification factor measured in 0–10% most central collisions is observed to be approximately equal to 0.4 and independent of within uncertainties, which indicates suppressed production of heavy flavour muons in \cePb+\cePb collisions. The muon yields are also measured as a function of the azimuthal angle with respect to the event plane. Fourier coefficients associated with the second harmonic modulation vary slowly with and show a systematic variation with centrality that is characteristic of other elliptic anisotropy measurements.
keywords:
Nuclear modification factor , Azimuthal anisotropy , Heavy flavour , Centrality1 Introduction
Heavy quarks provide an important probe of the properties of the quark-gluon plasma created in high-energy nuclear-nuclear collisions [1, 2, 3, 4, 5, 6, 7]. Heavy quarks , with the mass exceeding the temperature of the surrounding plasma MeV [8] are mostly produced early in the collision. Their production rates that can be calculated using pQCD, and their subsequent interactions reflect themselves in experimentally observable signatures. At high transverse momenta, greater than the quark mass, heavy quarks are thought to lose energy similar to light quarks but with mass-dependent modifications to the pattern of collisional and radiative energy loss [9, 10, 11]. At lower transverse momenta the quarks are thought to diffuse in the plasma losing energy and partially thermalizing [12]. Interacting with the medium heavy quarks may acquire an azimuthal anisotropy due to the collective expansion of the medium. Past measurements of heavy flavour quarks at RHIC and the LHC using semi-leptonic decays [13, 14, 15, 16] and direct reconstruction of heavy flavour mesons [17, 18, 19] have shown both substantial suppression in the yield of heavy quarks due to energy loss and significant azimuthal anisotropy.
This proceeding presents ATLAS measurements of heavy flavour muon production measured over 222ATLAS uses a right-handed coordinate system with its origin at the nominal interaction point (IP) in the center of the detector and the -axis along the beam pipe. The -axis points from the IP to the center of the LHC ring, and the -axis points upward. Cylindrical coordinates are used in the transverse plane, being the azimuthal angle around the beam pipe. The pseudorapidity is defined in terms of the polar angle pipe. The pseudorapidity is defined in terms of the polar angle as . using 0.14 nb-1 of \cePb+\cePb data at TeV and 4.0 pb-1 of data at TeV, collected during LHC operation in 2011 and 2013, respectively. The measurements are performed for several intervals of collision centrality, characterized using the total transverse energy measured in the forward calorimeters, and for different intervals spanning the range GeV.
The heavy flavour muon differential per-event yields in \cePb+\cePb collisions and differential cross-sections in collisions are used to calculate the heavy flavour muon as a function of in different \cePb+\cePb centrality intervals. In addition, the heavy flavour muon is measured as a function of and collision centrality using the event-plane method with the second-order event plane angle, , measured in the forward calorimeters.
Heavy flavour muons are statistically separated from background muons resulting from pion and kaon decays and hadronic interactions using a variable that compares the momenta of the muons measured in the inner detector and muon spectrometer. Over the range of the measurement, the residual irreducible contamination of non-heavy flavour muons to the measurement, is including contributions from decays [20].
2 Data analysis
The measurements presented in this proceeding are obtained using the ATLAS muon spectrometer (MS), inner detector (ID), calorimeter, trigger and data acquisition systems. A detailed description of these detectors and their performance in collisions can be found in Ref. [21]. The \cePb+\cePb events selected for this analysis are required to have a reconstructed vertex and a time difference between the signals in two Minimum Bias Trigger Scintillator detectors of less than 5 ns. At least one reconstructed collision vertex is required in collisions. The centrality of \cePb+\cePb collisions is characterised by transverse energy measured in the ATLAS forward calorimeter (FCal). Results presented in this proceeding, are worked out for several intervals ordered from the most central to the most peripheral collisions: 0–10%, 10–20%, 20–30%, 30–40%, and 40–60%.
Muons used in this analysis are obtained by combining tracks reconstructed in the MS with the tracks measured in the ID. The tracks are required to have momentum (1.2) GeV in the ID and the MS respectively and to satisfy criteria on the number of hits in ID that are the same for the and \cePb+\cePb data. Transverse and longitudinal impact parameters of the track with respect to a reconstructed event vertex are required to be less than 5 mm. Muons selected for this analysis are constrained at low to be above 4 GeV by the dependence of the muon trigger and reconstruction efficiencies while at high by the available statistics of the \cePb+\cePb data. The muon interval is chosen for optimal muon performance. A total of 9.2 million (1.8 million) muons are reconstructed within these kinematic ranges from 8.7 million (1.8 million) events recorded using the \cePb+\cePb () muon triggers.
The performance of the ATLAS detector and offline analysis in measuring muons is evaluated using Monte Carlo samples obtained from Geant4-simulated [22] TeV dijet events produced with the Pythia event generator [23] (version 6.423 with parameters chosen according to the AUET2B tune [24]). To account for the large occupancy in the detector readout channels in central \cePb+\cePb collisions Pythia events were overlayed onto \cePb+\cePb collision events selected with the minimum-bias trigger. For both the and \cePb+\cePb measurements, the muon reconstruction efficiency increases by about 15% between and 6 GeV above which it is approximately constant at 0.87 and 0.84 for the and \cePb+\cePb data, respectively. The \cePb+\cePb reconstruction efficiency is independent of centrality within uncertainties. The \cePb+\cePb muon trigger efficiency increases from 0.60 at GeV to 0.75 at 6 GeV, above which it is approximately constant. The muon trigger efficiency increases from 0.52 for GeV to 0.82 for GeV, above which it remains constant.
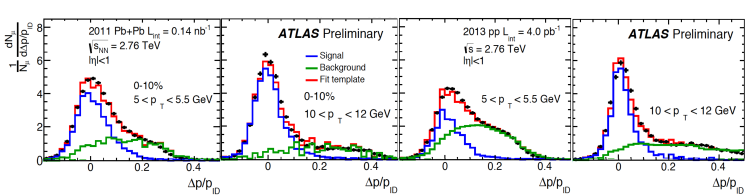
The muons measured in the and \cePb+\cePb data sets contain background from in-flight decays of pions and kaons, muons produced from the decays of particles produced in hadronic showers, and mis-associations of ID and MS tracks. Previous studies have shown that the signal and background contributions to the reconstructed muon sample can be discriminated statistically [20]. This analysis relies on the fractional momentum imbalance, , shown in Fig. 1 which quantifies the difference between the ID and MS measurements of the muon momentum after accounting for the energy loss of the muon in the calorimeters.
3 Results
The heavy flavour muon differential cross-section in and differential yields in \cePb+\cePb collisions are determined from the template fit procedure shown in Fig. 1.

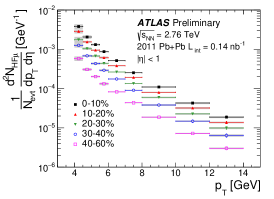
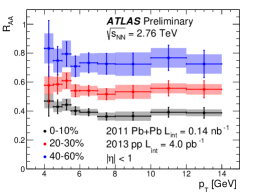
The measurement of the heavy flavour muon differential cross-sections and per-event yields are subject to systematic uncertainties arising from the muon trigger selection, muon reconstruction efficiencies, the template fitting procedure, muon resolution, and the luminosity explained in Ref. [25]. The results for and \cePb+\cePb are shown in Fig. 2 in the left and middle panels respectively. The right panel of the figure shows heavy-flavour muon , which decreases between peripheral (40–60%) and more central collisions reaching a value of 0.4 in the 0–10% centrality interval. The measured appear to be -independent within the uncertainties of the measurement. These results are consistent with previous results from the ALICE experiment [15], but have much smaller uncertainties.
The heavy flavour muon values are measured by evaluating the yields differentially with respect to the event plane. The extracted values, are then corrected to account for the event plane resolution. The sources of the systematic uncertainties in the measurements are mostly the same as those in the measurements, however, the trigger and tracking efficiencies do not have a significant effect on the . The resolution-corrected values are plotted in the left panel of Fig. 3 as a function of for several centrality intervals used in this analysis.
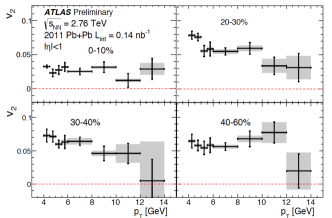
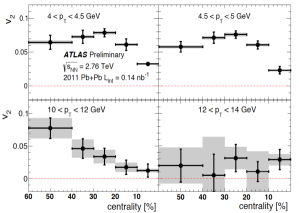
Over the 20–40% centrality range, the is largest at the lowest measured of 4 GeV and decreases for higher . However, in the 0–10% and 40–60% centrality intervals, no clear dependence is visible. For all centralities, significant non-zero is observed even at of 10 GeV. Right panels of the figure show the same set of results plotted as a function of centrality for different intervals. For low range the centrality dependence of the heavy flavour muon is qualitatively similar in shape, but considerably smaller in magnitude, to that for charged hadrons of similar [26, 27]. In this range, the first increases from central to mid-central events, reaches a maximum between 20–40% centrality, and then decreases. Over the range of 8–12 GeV the increases monotonically from central to peripheral events, However, the associated statistical and systematic uncertainties are considerably larger. This monotonically increasing centrality dependence of the at high is also seen in the inclusive charged hadron [26, 27]. For the highest interval of GeV, the statistical and systematic errors are too large to clearly understand the centrality dependence of the .
References
- [1] H. van Hees, R. Rapp, Phys. Rev. C71 (2005) 034907. arXiv:nucl-th/0412015.
- [2] C. P. Herzog, A. Karch, P. Kovtun, C. Kozcaz, L. G. Yaffe, JHEP 07 (2006) 013. arXiv:hep-th/0605158.
- [3] H. van Hees, M. Mannarelli, V. Greco, R. Rapp, Phys. Rev. Lett. 100 (2008) 192301. arXiv:0709.2884.
- [4] W. A. Horowitz, M. Gyulassy, Phys. Lett. B666 (2008) 320–323. arXiv:0706.2336.
- [5] J. Uphoff, O. Fochler, Z. Xu, C. Greiner, Phys. Rev. C84 (2011) 024908. arXiv:1104.2295.
- [6] M. He, R. J. Fries, R. Rapp, Phys. Rev. C86 (2012) 014903. arXiv:1106.6006.
- [7] S. Cao, G.-Y. Qin, S. A. Bass, Phys. Rev. C88 (4) (2013) 044907. arXiv:1308.0617.
- [8] N. Armesto, et al., J. Phys. G35 (2008) 054001. arXiv:0711.0974.
- [9] M. Djordjevic, M. Gyulassy, Nucl. Phys. A733 (2004) 265–298. arXiv:nucl-th/0310076.
- [10] P. B. Gossiaux, J. Aichelin, T. Gousset, V. Guiho, J. Phys. G37 (2010) 094019. arXiv:1001.4166.
- [11] P. B. Gossiaux, J. Aichelin, J. Phys. G36 (2009) 064028. arXiv:0901.2462.
- [12] G. D. Moore, D. Teaney, Phys. Rev. C71 (2005) 064904. arXiv:hep-ph/0412346.
- [13] PHENIX Collaboration, A. Adare et al., Phys. Rev. Lett. 98 (2007) 172301. arXiv:nucl-ex/0611018.
- [14] PHENIX Collaboration, A. Adare et al., Phys. Rev. C84 (2011) 044905. arXiv:1005.1627.
- [15] ALICE Collaboration, B. Abelev et al., Phys. Rev. Lett. 109 (2012) 112301. arXiv:1205.6443.
- [16] ALICE Collaboration, J. Adam et al.arXiv:1507.03134.
- [17] ALICE Collaboration, B. Abelev et al., JHEP 09 (2012) 112. arXiv:1203.2160.
- [18] ALICE Collaboration, B. Abelev et al., Phys. Rev. Lett. 111 (2013) 102301. arXiv:1305.2707.
- [19] ALICE Collaboration, B. Abelev et al., Phys. Rev. C90 (3) (2014) 034904. arXiv:1405.2001.
- [20] ATLAS Collaboration, Phys. Lett. B707 (2012) 438–458. arXiv:1109.0525.
- [21] ATLAS Collaboration, JINST 3 (2008) S08003.
- [22] S. Agostinelli, et al., Nucl. Instrum. Meth. A506 (2003) 250–303.
- [23] T. Sjostrand, S. Mrenna, P. Z. Skands, JHEP 0605 (2006) 026. arXiv:hep-ph/0603175.
- [24] ATLAS Collaboration, ATL-PHYS-PUB-2011-009, http://cdsweb.cern.ch/record/1363300.
- [25] ATLAS Collaboration, ATLAS-CONF-2015-053, https://cds.cern.ch/record/2055674.
- [26] ATLAS Collaboration, Phys. Lett. B707 (2012) 330–348. arXiv:1108.6018.
- [27] ATLAS Collaboration, Phys. Rev. C86 (2012) 014907. arXiv:1203.3087.