Measurements of minimum bias events, underlying event and particle production properties in ATLAS111Proceedings of the 23rd Low-x Meeting, Sandomierz, Poland, September 1-5, 2015
Abstract
The measurements of the minimum bias events provide valuable information on the basic properties of the interactions. The results at the new highest energy of collisions, TeV, obtained using the ATLAS detector, are shown. They include distributions of charged particle pseudorapidity density, transverse momentum and multiplicity. The properties of the underlying event, determined with respect to a leading high- particle, are also presented. In both cases the new results are compared with those from earlier studies of the collisions at TeV.
1 Introduction
The first measurements of collisions at TeV by the ATLAS detector [PERF-2007-01] at the Large Hadron Collider (LHC) [Evans:2008zzb] were performed at low instantaneous luminosity which ensured that the mean number of interactions in the registered events, , was only about 0.005. Such sample of events is suitable to study the strong interactions in the soft, non-perturbative QCD region. General properties of the minimum bias events [ATLAS-CONF-2015-028] and the activity accompanying a hard scattering (the underlying event - UE) [ATL-PHYS-PUB-2015-019] can be compared to predictions of Monte Carlo event generators (MC), which are later used for simulations of the effects of multiple proton–proton interactions. Results of such comparisons can be used to tune free parameters of the models leading to a better description of the data. These MC generators are then extensively used also in the analysis of processes, which require data collected at high instantaneous luminosity. In the studies mentioned above several models are compared with the data: pythia 8 [Sjostrand:2007gs], herwig++ [Bahr:2008pv], epos [Porteboeuf:2010um, Werner:2011um] and qgsjet-ii [Qgsjet]. As it is described in more detail in [ATLAS-CONF-2015-028, ATL-PHYS-PUB-2015-019] for each model its parameters were optimized using the existing 7 TeV data and the following tunes were used: [ATL-PHYS-PUB-2011-014, Skands:2014pea, Gieseke:2012ft, Pierog:2013ria, Sherstnev:2008dm, Ball:2012cx, ATL-PHYS-PUB-2014-021, Pumplin:2002vw].
2 ATLAS detector and data selection
The ATLAS detector [PERF-2007-01] at the Large Hadron Collider (LHC) [Evans:2008zzb] is a general purpose apparatus enabling measurements in an almost full solid angle, detecting charged particles and the neutral particles interacting strongly or electromagnetically. The inner detector (ID) placed in a 2 Tesla magnetic field covers the full azimuthal angle and the pseudorapidity range . The barrel part of ID, surrounding the beam pipe closest to the nominal collision point, consists of 4 layers of silicon pixel sensors followed by eight layers of microstrip silicon sensors (SCT). It is worth to mention that since 2015 an additional innermost layer of silicon sensors (Insertable B-Layer - IBL), installed at the radius of only 33 mm from the beam line, is used. The size of the pixels in this new layer is smaller than in the next three layers of the pixel detector. The barrel part of pixel and SCT detectors is complemented at both ends by disks containing at each side 3 pixel and 9 microstrip sensor layers. At a larger radial distance from the beam line, behind SCT, the tracks of particles are measured in the Transition Radiation Tracker (TRT), the last element of the inner detector. Outside the inner detector are placed calorimeters and muon detectors, supplying additional information on particles produced in the collisions.
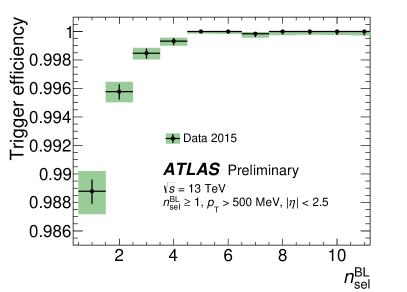
The trigger used to collect the minimum bias data is based on the signals from the Minimum Bias Trigger Scintillators (MBTS). This detector consists of two disks of plastic scintillators divided into 12 modules each and registers charged particles emitted in the range . The trigger requires at least one module with the signal above the threshold in any of the disks. The efficiency of this trigger, shown in Fig. 1 (left), is studied using a fully unbiased control trigger requiring only one reconstructed track with MeV. The efficiency is almost 99% already for and very fast increases to 100%.
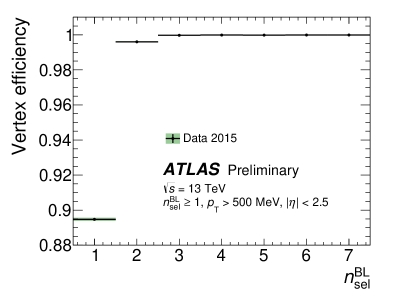
In order to remove background contamination and reject events with more than one interaction in the same beam crossing a single primary vertex with at least two tracks is required. However, in the events with more than one reconstructed vertex only those in which the second vertex contains at least four tracks are rejected. The second vertex with less than four tracks is allowed as it is usually due to secondary interactions or results from splitting of the primary vertex. The vertex reconstruction efficiency defined as a fraction of triggered events containing the vertex is shown in Fig. 1 (right). Only in the events with this efficiency is slightly below 90%, for it reaches 99.7% and is 100% for higher multiplicities.
The same data sample is used in both minimum bias and UE studies and it corresponds to an integrated luminosity of 170 . For the charged particle multiplicity analysis at least one track with GeV and is also required and finally 8,870,790 events are selected. This number is reduced in the underlying event study, as the presence of a leading track with GeV or GeV is in addition requested.
3 Charged-particle distributions
In the first presented analysis the properties of the charged particles produced in the minimum bias collisions at TeV were studied [ATLAS-CONF-2015-028]. The reconstructed tracks are required to satisfy the following criteria:
-
•
GeV and ,
-
•
at least 1 pixel hit with the additional requirement of an innermost pixel detector hit if expected (if not expected then next to innermost hit is required, if expected),
-
•
at least 6 hits in the SCT detector,
-
•
mm (the transverse impact parameter, , is calculated with respect to the average beam position),
-
•
mm ( is the difference between the longitudinal position of the track along the beam line at the point where is measured and the longitudinal position of the primary vertex),
-
•
probability for tracks with GeV.
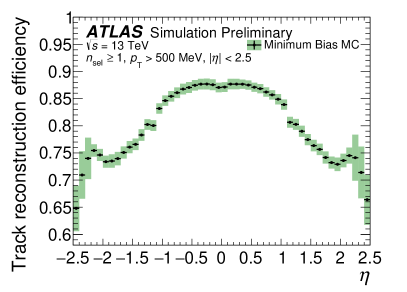
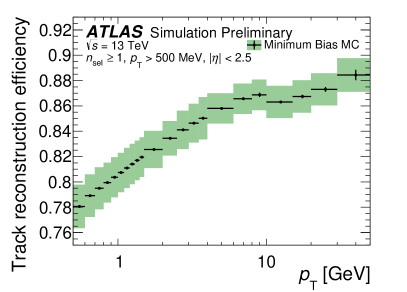
The efficiency of the track reconstruction is obtained from MC simulations. It is defined as the number of reconstructed tracks matched to charged primary particles divided by the number of charged primary particles. It is a function of both and as one can see in Fig. 2.
In the calculations of the final results several corrections are applied. The trigger efficiency and the vertex reconstruction efficiency are used to account for the loss of events. For distributions of and it is necessary to apply track reconstruction efficiency correction and subtract contributions from secondary particles, strange baryons and particles from outside of the kinematic range. Finally, the multiplicity distribution is calculated using the Bayesian unfolding.
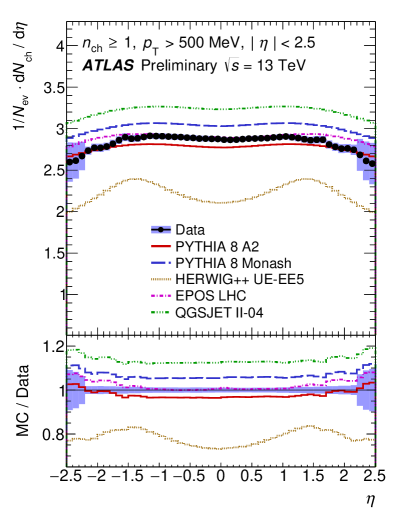
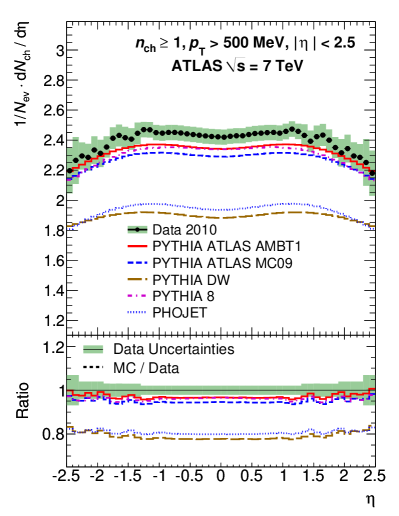
In Fig. 3 the pseudorapidity distribution, , is shown and compared with the MC model predictions. Most models correctly describe the dependence even if the mean multiplicity is not exactly reproduced. The one exception is the prediction from herwig++, which differs both in the height and in the shape of this distribution. The comparison with the similar results of the analysis at TeV (Fig. 3 (right)) [STDM-2010-06] does not indicate any qualitative differences, only the increase of the charged particle multiplicity with energy by about 15%. The model predictions at the time when the 7 TeV data were measured generally underpredicted the total charged particle multiplicity.
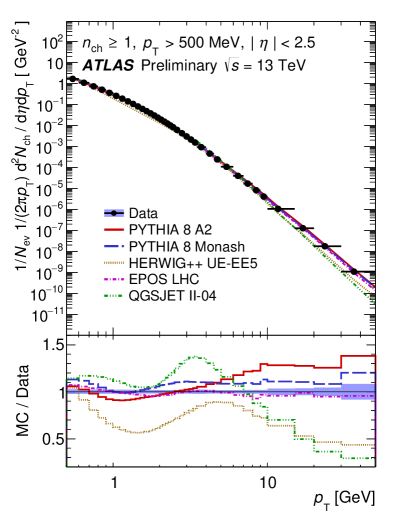
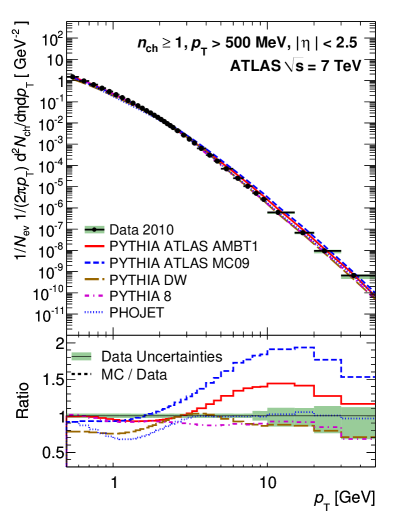
The transverse momentum distribution, , shown in Fig. 4, is measured for GeV and spans over 9 orders of magnitude. MC models appear similar to the data when this distribution is presented in the log scale, but the relative differences are large, especially for herwig++ and, at high , for qgsjet-ii. The distribution obtained for 7 TeV data has a similar shape. The comparison with the predictions of MC models revealed in some cases even larger differences than at 13 TeV.
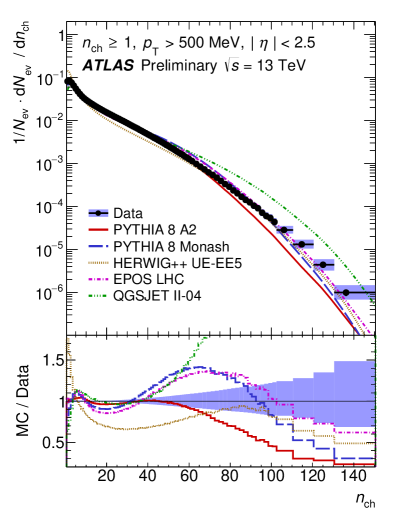
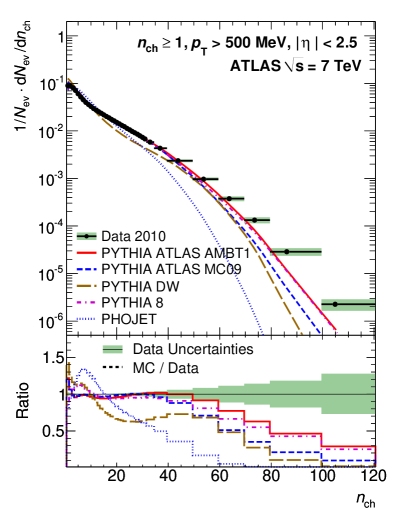
The largest discrepancies between data and MC predictions are observed in the case of multiplicity distribution, , shown in Fig. 5. The herwig++ is farthest from the data at very low () and at moderate multiplicities (10-50), while for qgsjet-ii deviates most significantly. None of the models predicts correctly this distribution for the highest multiplicities. Similar conclusions are valid also in the case of 7 TeV data, only the models compared are different.
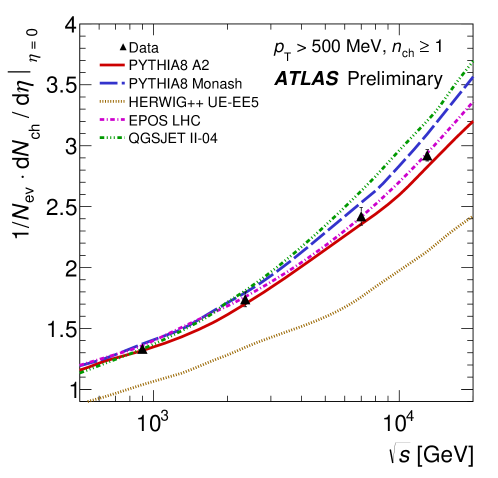
The collision energy dependence of the mean number of charged particles in the central region (calculated for ) is shown in Fig. 6. The multiplicity increases faster than linearly, and model predictions are qualitatively similar. The closest to the data is epos, while herwig++ underpredicts multiplicity for all energies.
4 Underlying event analysis
Many studies of interactions are devoted to the processes requiring a hard scattering of constituents of the colliding protons. Particles produced in such processes are however always accompanied by other particles originating from remaining partons, multi-parton interactions and initial or final state gluon radiation. Such activity not connected with the hard scattering is called the underlying event (UE). Even if unambiguous separation of the hard scattering and UE in each event is not possible, we can study averaged properties of UE. Usually, event properties in 3 separated regions are analysed, according to the value of , which is calculated for all tracks with respect to the azimuthal angle of a leading object, . The three regions are defined as:
-
•
region: ,
-
•
region: ,
-
•
region: .
In the studies presented here the leading object is either a high- track, a leading jet or a Z boson. In the first study of the 13 TeV data only leading tracks are considered [ATL-PHYS-PUB-2015-019] while all types of leading objects were analysed using 7 Tev data [STDM-2010-04, STDM-2010-05, STDM-2011-30, STDM-2011-31, STDM-2011-42].
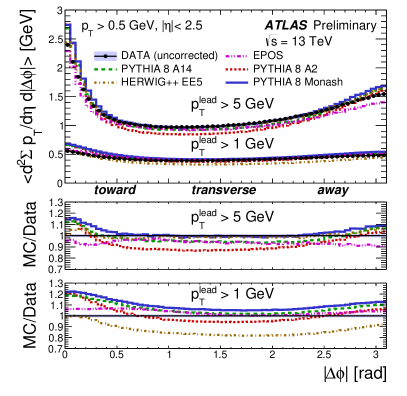
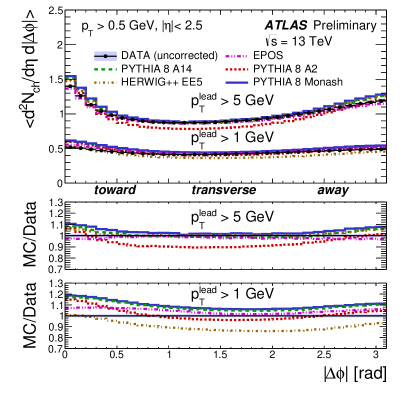
In Fig. 7 the average scalar sum density of tracks and the average track multiplicity density as a function of for the 13 TeV data and the MC model predictions are shown. The data and event selection are the same as in the multiplicity analysis described in Section 3. Comparison is performed on the detector level results, without any efficiency corrections. Two cases with different cuts for the leading track transverse momentum, one for GeV the other for GeV, are considered. For the higher cut the distributions show enhancement in the toward and away regions, while for lower cut they are almost flat. MC models describe the data within %.
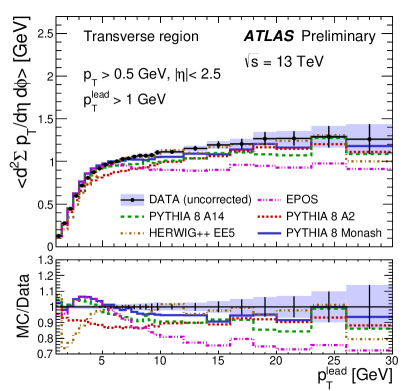
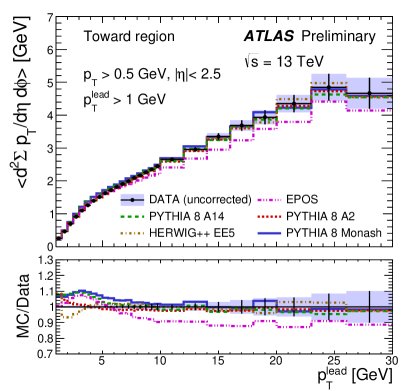
The dependence of the average scalar sum density of tracks on the transverse momentum of the leading track is shown in Fig. 8 for the transverse and toward regions. In the transverse region after an initial strong increase the scalar sum grows weakly, while in the toward region the increase continues up to the highest values of . MC models generally reproduce the trends observed in the data, but do not describe very well the initial increase for low . At larger values the largest differences are observed for epos, which however is tuned to describe Minimum Bias events rather than UE.
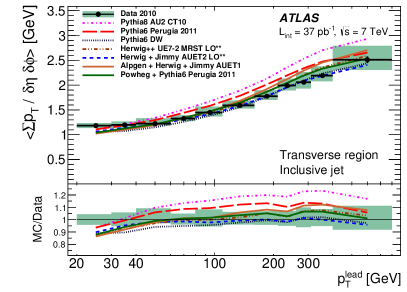
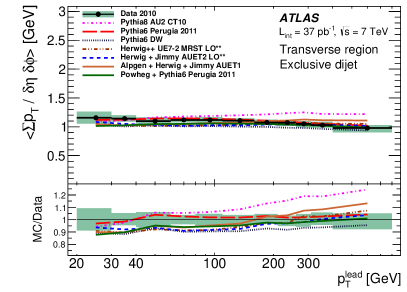
More exhaustive studies of underlying event were performed using 7 Tev data. Recently jets [STDM-2011-31] and Z bosons [STDM-2011-42] were used as the leading objects. In Fig. 9 the average scalar sum in the transverse region as a function of in the events with a leading jet is shown. For the inclusive sample of such events (Fig. 9 (left)) we can see an increase of for large values of . This is mostly due to multi-jet events, which can be removed by requiring exclusive dijet topology. In Fig. 9 (right) the results for dijet events are shown and no increase, but even a slight decrease, is observed.
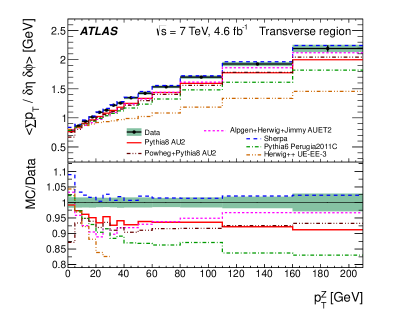
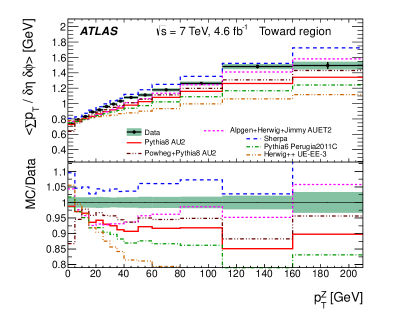
The same dependence on for events with the Z-bosons as the leading objects is shown in Fig. 10 (left). Here the increase with is even slightly stronger than for the events with jets, as the starting value of is 20% lower. The events with a leading Z boson can be used to study UE also in the toward region. Here the increase of with is much stronger than in the transverse region.
MC models generally describe results for leading jet better than for Z boson. In the latter case predictions of the models which include production of additional jets coming from the hard scattering are closer to the data.
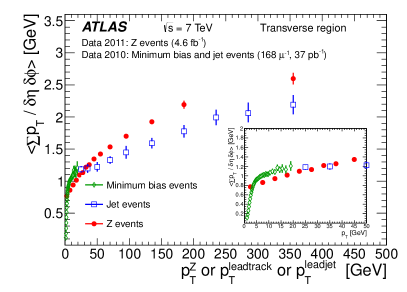
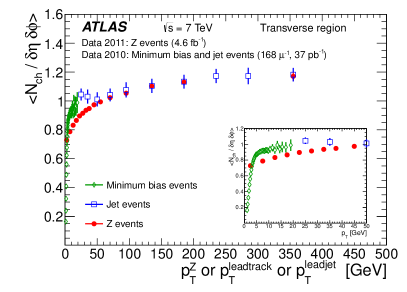
A summary of the results of analysis of the 7 TeV data with different leading objects is shown in Fig. 11. The average values of and obtained for the leading track and the leading jet are smoothly joining at . The dependence of on for tracks+jets is much different than for Z boson. This dependence is also different for , but at GeV the results for the leading jet and Z boson are very close.
5 Summary
The studies of inclusive minimum bias charged-particle distributions and underlying event properties are among the first analyses of the new data collected at TeV. The pseudorapidity, transverse momentum and multiplicity distributions measured with minimal model dependence are compared to predictions of MC models tuned to the data at lower energies. The best agreement with the data is reached by epos, a reasonable description is provided by pythia 8 while herwig++ and qgsjet-ii models are most distant from the data. Generally, the current tunes of the models describe the data better than the models available at the time of the first measurements of collisions at TeV did.
The first UE study at TeV on the detector level is also aimed on the comparison with MC models. In this case the predictions and the data agree much better, suggesting that the extrapolation with energy of the multi-particle interactions in the models performs reasonably well. The general trends for the dependence on observed in the transverse region at TeV agree with those found in more extensive studies performed at TeV. The fast rise for GeV is continued with a moderate slope not only for leading tracks, but also in the range available in the study of leading jets. Similar increase of UE activity is present also in the events with leading Z boson, but it has a different shape. In contrast, for events with leading jets with a clear dijet signature the average scalar sum density of tracks slightly decreases with . This means that the increase of UE activity with growing in the transverse region can be connected with the presence of additional low- jets.
Acknowledgements
This work was supported in part by the National Science Center grant DEC-2013/08/M/ST2/00320 and by PL-Grid Infrastructure.