Accretion-disc precession in UX Ursae Majoris
Abstract
We report the results of a long campaign of time-series photometry on the nova-like variable UX Ursae Majoris during 2015. It spanned 150 nights, with 1800 hours of coverage on 121 separate nights. The star was in its normal ‘high state’ near magnitude , with slow waves in the light curve and eclipses every 4.72 hours. Remarkably, the star also showed a nearly sinusoidal signal with a full amplitude of 0.44 mag and a period of d. We interpret this as the signature of a retrograde precession (wobble) of the accretion disc. The same period is manifest as a s wobble in the timings of mid-eclipse, indicating that the disc’s centre of light moves with this period. The star also showed strong ‘negative superhumps’ at frequencies and , where and are respectively the orbital and precession frequencies. It is possible that these powerful signals have been present, unsuspected, throughout the more than 60 years of previous photometric studies.
keywords:
accretion, accretion discs – binaries: close – novae, cataclysmic variables – Stars: individual: UX Ursae Majoris.1 Introduction
UX Ursae Majoris (UX UMa) is one of the oldest and most thoroughly studied of the cataclysmic variables (CVs). Among non-eruptive CVs, it’s probably the champion in both respects. Visual and photoelectric photometry showed it to be an eclipsing binary with a remarkably short period of 4.72 hours (Zverev & Kukarkin, 1937; Johnson, Perkins & Hiltner, 1954; Krzeminski & Walker, 1963), and Walker & Herbig (1954) proposed a model in which the hot star in the binary is surrounded by a large ring of gas on which a bright region (hot spot) resides. The hot spot became a key feature of the basic model for understanding CVs, in which the spot is interpreted as the region where the mass-transfer stream impacts the outer edge of the accretion disc.
The spectrum of UX UMa closely resembles that of dwarf novae in eruption: a blue continuum with broad, shallow hydrogen absorption lines, and narrow H emission contained within these absorption troughs. He i and weak He ii emission are sometimes also present. Recent spectroscopic studies have been reported by Linnel et al. (2008) and Neustroev et al. (2011). The distance is pc (Baptista et al., 1995, 1998). The out-of-eclipse mean magnitude is 13.0, but this is adversely affected by interstellar extinction (0.2 mag) and the geometrical projection of a fairly edge-on disc (1.0 mag; Paczynski & Schwarzenberg-Czerny 1980). After these corrections, the angle-averaged is about . That’s just about right for the ‘high state’ of a dwarf nova with an orbital period of 4.7 hours (Fig. 1 of Patterson 2011). Thus the spectrum and brightness are consistent with interpretation as a dwarf nova in the high state.
In addition, UX UMa shows another phenomenon which is highly characteristic of dwarf novae: very rapid (30 s) oscillations in its optical and UV brightness (Warner & Nather, 1972; Nather & Robinson, 1974; Knigge et al., 1998a). These oscillations are seen in practically every dwarf nova near the peak of eruption, and are consequently called ‘dwarf nova oscillations’ (DNOs; Patterson 1981, especially the abstract and Fig. 17). Their presence in UX UMa is yet another reason why the star is commonly regarded, and described, as essentially a ‘permanently erupting dwarf nova’.
UX UMa vaulted to the world’s attention from a program of time-series photometry in the 1940s. We launched a more intensive program in 2015, and discovered several additional periodic signals, which we describe in this paper and interpret as signifying the retrograde precession of the accretion disc.
2 Observations
We conducted this campaign with our global network of small photometric telescopes, the Center for Backyard Astrophysics (CBA). The network’s general approach to instrumentation and observing methods is given by Skillman & Patterson (1993), and the summary observing log is given in Table LABEL:obs-log. We used differential photometry with respect to one of the nearby field stars GSC 3469-0356 (), GSC 3469-0290 (), and GSC 3469-0867 (), with magnitudes corresponding to the APASS photometric survey (Henden et al., 2012). We constructed light curves using overlaps of the various time series to calibrate each on a common instrumental scale. That scale is roughly a magnitude since most of our data is unfiltered in order to improve signal-to-noise. Nevertheless, we did obtain sufficient data with a true filter to measure offsets, and this allowed us to place all our data into a magnitude scale that is expected to nearly correspond to a true , with a zero-point uncertainty of 0.04 mag.
The cycle time (integration + readout) between points in the various time series was usually near 60 seconds. We made no correction for differential (color) extinction, although such a correction is in principle necessary, since all CVs are bluer than field stars. But in a long time series, such effects are always confined to the same frequencies (very near 1 and 2 cycles per sidereal day), so the resultant corruption is easily identified and ignored. In the present case, it is also mitigated by the northern latitudes of observers and the far-northern declination of the star (51 degrees), which made it possible to obtain long runs within our self-imposed limit of 2.0 airmasses. Finally, we just prefer to keep human hands off the data as much as possible.
As detailed in Table LABEL:obs-log, the campaign amounted to 355 separate time series on 121 nights distributed over a span of 153 nights from February 24 to July 26, 2015. The total coverage was 1785 hours, all from sites in Europe and North America. This longitude span permitted many 14 hour runs, which eliminated all possibility of daily aliases – the usual bugaboo of single-longitude time series.
| Observer | CBA station | Nights/hours |
|---|---|---|
| Cejudo | Madrid (Spain) 0.3 m | 59/259 |
| Ulowetz | Illinois (USA) 0.24 m | 53/216 |
| de Miguel | Huelva (Spain) 0.3 m | 31/173 |
| Jones | Oregon (USA) 0.35 m | 16/126 |
| Boardman | Wisconsin (USA) 0.3 m | 19/104 |
| Barrett | Le Marouzeau (France) 0.2 m | 24/99 |
| Koff | Colorado (USA) 0.25 m | 14/95 |
| Stein | Las Cruces (New Mexico, USA) 0.35 m | 12/85 |
| Campbell | Arkansas (USA) 0.15 m | 15/76 |
| Vanmunster | Belgium 0.35 m | 14/63 |
| Menzies | Massachusetts (USA) 0.35 m | 9/60 |
| Slauson | Iowa (USA) 0.24 m | 15/59 |
| Goff | Sutter Creek (California, USA) 0.5 m | 9/48 |
| Roberts | Tennessee (USA) 0.4-0.5 m | 8/45 |
| Morelle | France 0.3 m | 6/43 |
| Dvorak | Rolling Hills (Orlando, USA) 0.25 m | 8/38 |
| Hambsch | Belgium 0.28 m | 7/29 |
| Starkey | Auburn (Indiana, USA) 0.4 m | 4/28 |
| Collins | North Carolina (USA) 0.35 m | 6/25 |
| Costello | Fresno (USA) 0.35 m | 4/21 |
| M. Cook | Newcastle (Ontario, Canada) 0.4 m | 4/20 |
| Oksanen | Finland 0.4 m | 3/20 |
| Lemay | Quebec (Canada) 0.35 m | 7/24 |
| L. Cook | Concord (California, USA) 0.2-0.7 m | 4/12 |
| Ogmen | Cyprus 0.35 m | 2/10 |
| Richmond | Rochester (New York, USA) 0.30 m | 2/7 |
3 Light curves and eclipses


Two representative nightly light curves are shown in Fig. 1. They are similar to essentially all light curves in the literature (e.g. Johnson, Perkins & Hiltner 1954; Walker & Herbig 1954; Warner & Nather 1972): regular, asymmetric eclipses, with ingress being steeper than egress; irregular, non-coherent variations at short timescales (flickering); plus a roughly ‘orbital’ hump, although the latter varies markedly – and interestingly! – from one night to the next. The mean brightness outside the eclipses and at minimum are and , respectively. These values are far from constant, and vary from one orbital cycle to the next. The upper frame of Fig. 2 shows a sample 27-day light curve, which suggests the presence of a slow wave with a period near 3.7 d that modulates the out-of-eclipse brightness, as well as the magnitude of the system at mid-eclipse. And the bottom frame shows a 100-day light curve (with eclipses removed), which confirms the apparent stability of this slow wave.


We measured the time of minimum eclipse and the corresponding magnitude by fitting a parabolic function to the bottom half of the minimum ( in orbital phase). Individual errors were estimated by Monte Carlo methods and found to vary in the range – d, with median value of d. Strictly speaking, this fitting procedure provides estimates of the time of minimum light, which tends to occur slightly later than the time of mid-eclipse in UX UMa (Baptista et al., 1995). But our data do not allow us to discriminate between these two timings, since the differences are much smaller than our uncertainties. A total of 214 minima were timed. These times, collected in Table 2, were found to track the ephemeris
| (1) |
Not surprisingly, the corresponding residuals were found to show no statistically significant departure from linearity over the 150 d baseline, since the orbital modulation is expected to be a stable clock on this time scale. But as we shall see below, they appear to be modulated by the 3.7 d period described above.
| 78.5100 | 78.7067 | 79.6903 | 81.8535 | 83.6238 | 83.8202 | 84.6072 | 88.5405 | 88.7371 | 89.7204 |
| 91.8847 | 93.6535 | 93.8504 | 95.8169 | 96.6035 | 97.5871 | 98.5704 | 99.3574 | 99.5543 | 99.7508 |
| 100.3406 | 100.5373 | 102.7010 | 102.8974 | 103.6839 | 103.8804 | 104.4702 | 105.8460 | 106.8306 | 107.4204 |
| 107.6177 | 108.4037 | 108.6006 | 108.7971 | 108.9946 | 109.3872 | 109.5843 | 109.7808 | 109.7807 | 109.9780 |
| 110.3708 | 110.5677 | 110.7644 | 111.7466 | 111.9439 | 112.3373 | 112.5341 | 112.7302 | 112.9277 | 113.5175 |
| 113.7146 | 114.5015 | 114.6975 | 114.8945 | 115.4837 | 116.6632 | 116.8615 | 117.6474 | 117.8443 | 118.4344 |
| 118.6303 | 119.4173 | 119.6142 | 119.8106 | 120.4012 | 120.5982 | 121.3848 | 121.5817 | 121.7782 | 122.3679 |
| 122.5644 | 122.7605 | 122.9570 | 123.3509 | 123.7435 | 124.3346 | 124.5313 | 124.7283 | 125.3184 | 125.5147 |
| 125.7115 | 126.4977 | 126.6944 | 126.8909 | 127.4810 | 127.6765 | 128.4647 | 128.6618 | 128.8575 | 129.6447 |
| 129.8404 | 130.4308 | 130.6275 | 130.8235 | 131.0210 | 131.4147 | 131.8079 | 132.0053 | 132.3981 | 132.5946 |
| 132.7920 | 132.9887 | 133.3812 | 133.5772 | 133.7745 | 133.9711 | 134.3641 | 134.5612 | 134.7576 | 135.5452 |
| 135.7413 | 135.9382 | 136.5286 | 136.7253 | 138.4939 | 138.6909 | 138.8884 | 139.6751 | 139.8719 | 140.4620 |
| 140.6585 | 140.8542 | 141.4447 | 141.6413 | 141.8378 | 142.4276 | 142.6249 | 142.8214 | 143.4122 | 143.6082 |
| 143.8053 | 144.0018 | 144.3949 | 144.7883 | 145.7714 | 145.9683 | 146.7553 | 147.7391 | 148.5249 | 149.5079 |
| 149.7052 | 150.4920 | 150.6885 | 150.8851 | 151.4758 | 151.6720 | 152.4582 | 152.8514 | 153.4418 | 153.6377 |
| 153.8349 | 154.4253 | 154.6217 | 155.4089 | 155.6054 | 155.8012 | 156.5882 | 156.7845 | 157.5718 | 158.5556 |
| 159.5390 | 160.5210 | 162.4896 | 163.4720 | 164.4554 | 164.8488 | 165.4389 | 166.4216 | 166.6187 | 166.8156 |
| 167.4055 | 167.6011 | 168.3887 | 168.5853 | 169.5697 | 169.7657 | 170.5522 | 170.7485 | 171.5346 | 172.5197 |
| 173.5027 | 175.4691 | 175.6662 | 176.6494 | 177.4359 | 177.6320 | 183.7289 | 184.7127 | 190.4157 | 190.6130 |
| 191.4001 | 192.5786 | 193.5618 | 194.5464 | 195.7266 | 196.5122 | 197.6937 | 198.4796 | 199.4623 | 201.6262 |
| 201.8226 | 202.4132 | 203.7890 | 206.5436 | 208.5088 | 209.4941 | 209.6898 | 211.6558 | 221.4904 | 222.4728 |
| 223.4569 | 224.4399 | 227.3903 | 227.7846 |
The orbital light curve is significantly contaminated by flickering, the 3.7 d modulation, and the ‘superhump’ variations described below. Making no attempt to remove these effects, and simply averaging over the 1800 hours of coverage, we found the mean orbital light curve seen in Fig. 3. This appears to be the first mean orbital light curve published for this venerable, oft-observed star. And it shows maximum light near orbital phase 0.35, roughly 180∘ out of phase with the standard ‘hot spot’ model developed for U Geminorum, and thought to prevail, mutatis mutandis, in all CVs (Smak, 1971; Warner & Nather, 1971). The accretion geometry must be significantly different in UX UMa.


4 Periodic signals in the light curve
Our primary analysis tool for studying periodic waves is power spectra calculated by Fourier methods. The frequency analysis was performed by using the Period04 package (Lenz & Breger, 2005), based on the discrete Fourier transform method. Uncertainties in the frequencies and amplitudes were estimated by using Monte Carlo methods from the same package. Of course the sharp eclipses severely contaminate analysis by Fourier methods, since the latter represent time series as sums of sinusoids. So to prepare the light curves for study, we first removed the eclipse portion of the light curves, viz. the phase interval 0.9–1.1.
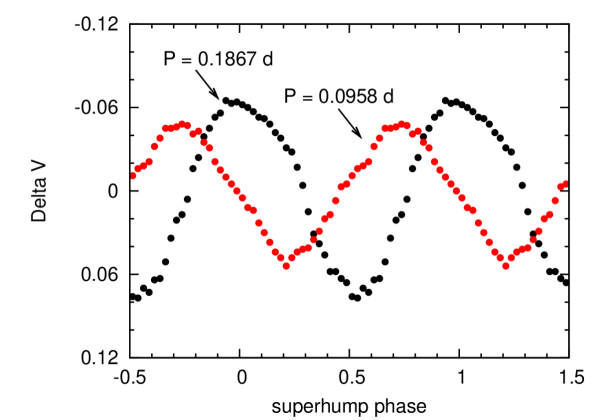
The low-frequency region of the power spectrum is shown in the upper frame of Fig. 4, where the most prominent peaks are labeled through , and alias peaks marked with ‘’. In the figure, and throughout the paper, frequencies are expressed in cycles per day,111The natural frequency unit for time-series studies on a planet plagued by rotation and sunrise. for which we use c d-1 as a shorthand. A prominent peak ( in Fig. 4) is observed at 5.0847(9) c d-1. This signal, with a semi-amplitude of 0.042 mag, coincides with the orbital frequency . But the most powerful signal ( in Fig. 4) occurs at 0.2717(5) c d-1, or 3.680(3) d, a signal that is unrelated to the orbital motion, and that we denote as , in anticipation of identifying it with nodal precession of the accretion disc. We summed at 0.2717 c d-1, and found a highly sinusoidal waveform with a semi-amplitude of 0.22 mag. This is shown in the upper frame of Fig. 5.
In addition to and , other signals appear in the vicinity of and . For their characterization, we subtracted the sinusoids corresponding to and from the full out-of-eclipse data set, and then recalculated the power spectrum of the residual light curve. The results are shown in the lower frame of Fig. 4, which reveals obvious signals at 5.3562(4) and 10.4391(4) c d-1 ( and in Fig. 4), with semi-amplitudes of 0.069 and 0.034 mag, respectively. These are consistent with identifications as and , which are expected at 5.3564(7) and 10.4410(9) c d-1, respectively. These upper sidebands of the orbital frequency are known as negative superhumps in variable-star nomenclature, because in period (rather than frequency) language, their period excesses over , , etc. are negative.222The terminology goes back to Harvey et al. (1995), and the full suite of CV periodic-signal arcana is reviewed in Appendix A of Patterson et al. (2002). The mean waveform of these negative superhumps are shown in the lower frame of Fig. 5.
The transition from the upper to the lower frame in Fig. 4 looks odd. Of course the one-day aliases, along with the main peaks, disappear when the and signals are subtracted from the time series. But in Fig. 4 there are also strong peaks at 4.814(1) and 9.899(1) c d-1 ( and in Fig. 4), with amplitudes greatly reduced after the subtraction. That’s surprising. But these frequencies are essentially equal to and , so a good possibility is that the dominant signal severely modulates the orbital signal, producing artificial flanking peaks at . The effects described below in §5 support this. Only the higher-frequency sidebands – the negative superhumps – survive the subtraction. A summary of the main frequencies is given in Table LABEL:freqs.
The power spectrum in the lower frame of Fig. 4 seems to show a strong broad peak around 1 c d-1. This peak, centred around 0.948(2) c d-1, is actually an alias of a stronger detection at 0.0521(8) c d-1, as shown inset in a zoomed-in view of the power spectrum in the range 0–1 c d-1. Is this detection an indication of a day periodicity in UX UMa? It could be, but after a closer inspection we find no trace of this signal during, approximately, the first half of the campaign. Admittedly, we have no grounds for believing that this is a true detection, and we are more inclined to guess that it is just noise.
| label | frequency | meaning | |
|---|---|---|---|
| (c d-1) | (mag) | ||
| 0.2717(5) | 0.220(1) | (nodal) | |
| 5.0847(9) | 0.042(1) | (orbital) | |
| 5.3562(4) | 0.069(1) | (nsh) | |
| 10.4391(4) | 0.034(1) | (nsh) | |
| 4.814(4) | |||
| 9.899(4) |

The waveforms of all four physically significant signals (, , , ) are impressively sinusoidal, and probably indicate that none of these signals rely on the deep eclipse for their existence. UX UMa would probably show these effects at any binary inclination, although the amplitude may well depend on inclination.

| 81.64 | 96.25 | 100.23 | 103.88 | 107.56 | 111.49 | 115.49 |
| 119.02 | 122.92 | 126.54 | 130.13 | 134.02 | 137.65 | 141.29 |
| 144.93 | 148.70 | 152.23 | 155.96 | 159.60 | 163.15 | 166.97 |
| 170.58 | 174.28 | 192.50 | 196.21 | 199.85 | 207.13 |
4.1 The 3.7 d clock
We have estimated the timings of maximum light in the 3.7 d cycle. A total of 27 maxima were timed, with estimated uncertainties on individual timings of 0.1 d. These values are presented in Table LABEL:timings_nodal. A linear regression to these timings provides the following test ephemeris
| (2) |
which we used to calculate the diagram shown in Fig. 6. The curvature indicates that no constant period satisfies the data, but rather a period drifting about a mean value of 3.69 d. From a parabolic fit to the residuals, we find that the period drifts at a rate of , or c d-2, which amounts to an overall decrease in the nodal period of 0.2 d over the 5 months spanned by our observations.


4.2 Periodic effect in the eclipse depths
As one may notice in Figs. 1 and 2, the brightness at minimum light () is notoriously variable, and presumably modulated by the 3.68 d wave discussed earlier for the out-of-eclipse brightness (). As for the eclipse depths, variations – if they exist at all – are not easy to perceive from these figures. We tackle these questions next.
We started by considering our estimates of and checked for possible periodic variations, finding the power spectrum shown in the upper frame of Fig. 7. The dominant peak at 0.2721 c d-1 shows that the 3.68 d period also modulates the minimum light. The lower frame of Fig. 7 shows these values folded (and binned) on the ephemeris given in Eq. (2), and indicates that varies essentially as a sinusoid. Comparison with the out-of-eclipse modulation indicates that: (i) both share the same periodicity; (ii) has a larger semi-amplitude (0.30 mag) than (0.22 mag); and (iii) both are in phase (difference in phase of , according the corresponding best sinusoidal fits).
What about the eclipse depth? If this is defined as , our previous analysis shows that is indeed non-constant, and varies sinusoidally throughout the precession cycle. Adopting our best sinusoidal fits for and , the eclipse depth is found to vary, on average, from 0.82 mag at the maximum of the precession cycle (phase ) to 1.00 mag at its minimum ().

The cyclic effect on the eclipse depth can also be analyzed in terms of fluxes. Fig. 8 shows the 3.68 day modulation of the flux at minimum light relative to the out-of-eclipse flux. In line with the discussion above in terms of magnitudes, eclipses are deepest at the minimum of the precession cycle. We note that a similar effect has been reported for the SW Sex nova-like PX And (Stanishev et al., 2002).
4.3 Periodic effect in the mid-eclipse residuals
As we examined the many eclipses, we noticed some which were distinctly asymmetric, confounding the effort to derive a precise timing of mid-eclipse. Departures from the mean ranged up to 80 s, but seemed to be systematic with time. So we calculated the power spectrum of the departures of eclipse timings from the ephemeris given in Eq. (1), and found the result seen in the upper frame of Fig. 9.
A significant peak is present at 0.2719(7) c d-1, or 3.678(9) d, the same period behind the large variations in light seen in Fig. 2. Apparently the centre of light, or at least the centre of eclipsed light, wanders back and forth on this period. And since the eclipsed light of UX UMa is dominated by the accretion disc, we conclude that the disc’s photometric centre moves about with this period.333Where ‘disc’ may or may not include the bright spot arising from mass transfer, which is a well-known permanent feature which causes the large asymmetry in the eclipse centred around orbital phase 0.05 (see Fig. 9 of Nather & Robinson (1974)). (Presumably the true orbital period, set by the laws of dynamics, can be relied on to stay immoveable during this 5-month campaign.) A fold of the residuals on the ephemeris given in Eq. (2) yields the result seen in the lower frame of Fig. 9: a nearly sinusoidal wiggle with a semi-amplitude of 33.3(9) s. It seems that there is no time lag () in the orbital eclipses at precession phases and 0.5 (maximum and minimum light, respectively). The eclipse takes place earlier than expected (negative residuals) for , and later (positive residuals) for .


4.4 The 0.1867 day (negative superhump) clock
We tried to time individual maxima in the negative-superhump cycle by picking out local maxima after removing the 3.68 d and orbital signals. Table LABEL:timings_nsh shows the resultant 161 timings, with errors in individual timings estimated to be around 0.007 d. A linear regression to these timings provides the ephemeris
| (3) |
The associated frequency, c d-1, is fully consistent with the value found from the power spectrum of the out-of-eclipse photometric data. The corresponding residuals relative to the above ephemeris are shown in Fig. 10. The downward curvature of the residuals mirrors that of Fig. 6, verifying that the observed superhump frequency changes in lockstep with the observed precession frequency. From a parabolic fit to the residuals, we find that the period of the negative superhump decreases at a rate or c d-2. The latter agrees with the rate of variation of the nodal frequency we found before, as it should be expected from the relation . We note that this relation remains valid in the short term, not just for the whole season.
| 98.458 | 99.604 | 100.371 | 100.572 | 102.773 | 102.966 | 103.889 | 104.476 | 108.551 | 108.763 | 108.935 |
| 109.495 | 109.866 | 110.437 | 110.621 | 110.812 | 111.710 | 111.883 | 112.474 | 112.643 | 112.859 | 113.432 |
| 113.791 | 114.366 | 114.745 | 116.786 | 117.703 | 117.910 | 118.486 | 118.652 | 119.618 | 119.809 | 120.338 |
| 120.528 | 121.453 | 121.625 | 121.806 | 122.419 | 122.606 | 122.780 | 122.977 | 123.694 | 124.451 | 124.643 |
| 124.815 | 125.397 | 125.579 | 126.354 | 126.732 | 126.925 | 127.420 | 127.609 | 127.797 | 128.560 | 128.744 |
| 128.925 | 129.704 | 129.894 | 130.448 | 130.978 | 131.349 | 131.718 | 131.915 | 132.474 | 132.680 | 132.864 |
| 133.437 | 134.700 | 135.457 | 135.649 | 135.833 | 136.397 | 136.611 | 136.784 | 138.446 | 138.646 | 138.824 |
| 139.773 | 140.515 | 140.728 | 140.916 | 141.470 | 141.651 | 141.833 | 142.367 | 142.559 | 142.762 | 142.942 |
| 143.518 | 143.709 | 143.841 | 144.283 | 144.839 | 145.716 | 145.905 | 146.673 | 147.606 | 148.370 | 149.443 |
| 149.626 | 149.824 | 150.584 | 150.777 | 151.536 | 152.479 | 152.854 | 153.564 | 153.753 | 154.513 | 155.473 |
| 155.660 | 157.494 | 158.442 | 158.642 | 159.401 | 159.591 | 160.475 | 162.561 | 162.717 | 163.509 | 164.395 |
| 164.585 | 164.768 | 165.528 | 166.474 | 166.666 | 167.570 | 168.484 | 168.677 | 169.447 | 170.397 | 170.592 |
| 170.778 | 172.438 | 172.801 | 173.559 | 174.523 | 175.587 | 176.538 | 176.720 | 177.505 | 177.675 | 182.677 |
| 183.629 | 190.519 | 192.536 | 193.668 | 194.456 | 196.546 | 197.631 | 198.562 | 199.514 | 201.732 | 202.496 |
| 203.820 | 207.679 | 208.432 | 222.437 | 223.418 | 227.474 | 230.451 |
The departures from a smooth curve are quite large – up to 45 min – whereas we estimate a typical measurement error of 10-15 min. But the dispersion in timings on individual nights is much smaller, so we suspected that some other effect contributes to that variance. The power spectrum of the residuals about the quadratic fit shows a peak at 0.273(2) c d-1, which indicates that the precession term is responsible for this effect, even though its direct photometric signature – the 3.68 d signal – has been accurately subtracted.

5 Discussion
Most cataclysmic variables show a periodic signal at , either from an eclipse – pretty obvious! – or from some other effect of high or moderate inclination, e.g. the periodic obscuration of the mass-transfer ‘hot spot’ as it wheels around the disc. Many (200) also show a photometric period a few percent longer than (positive superhumps). Most of the latter are short-period dwarf novae, which sprout these signals for 1–4 weeks, during their long outbursts (‘supermaxima’). This is now understood as arising from the apsidal precession of the accretion disc, rendered eccentric at the 3:1 resonance in the disc. A few stars which are not dwarf novae also show this effect, but these are all short-period ( h) nova-like variables, which in many ways can be seen as permanently erupting dwarf novae. These signals are known as ‘permanent’ superhumps (Patterson & Richman, 1991).
Only a disc large enough to reach the 3:1 resonance can suffer this instability (Whitehurst & King, 1991; Lubow, 1991), and that is presumably the reason that positive superhumps are only found in short-period stars. But some stars show photometric signals with – the negative superhumpers. Much less is known about them. The early papers on these phenomena (Bonnet-Bidaud, Motch & Mouchet, 1985; Patterson et al., 1993; Harvey et al., 1995) postulated the existence of a tilted accretion disc, which is forced to precess slowly backwards (relative to the orbit) by the torque from the secondary. The angular relation between the secondary (including its structures, viz. the mass-transfer stream) and the disc then repeats with a period slightly less than . This is a negative superhump. Roughly 20 CVs show negative superhumps (see Table 2 of Montgomery (2009)), and roughly half of these (see Table 5 of Armstrong et al. (2013)) also show a photometric signal at the postulated precession period. Detection of that low-frequency signal is a strong point in support of the theory, since a wobbling disc should present an effective area which varies with the wobble period.
Our data demonstrate that UX UMa joins this club. We hypothesize that its accretion disc wobbles about the orbital plane with a period d, and we see its effective area varying on that period. But the orbiting secondary – not in the inertial frame! – sees the disc with a slightly shorter recurrence period, such that c d-1, or d. The effect is basically identical to the famous tropical/sidereal year effect in the Earth-Sun system, or the draconic/sidereal month effect in the Earth-Moon system. Montgomery (2009) discusses this analogy in great, and fascinating, detail.
The cause and maintenance of disc tilt is not known. No actual dwarf nova in outburst shows negative superhumps, although their closest cousins – nova-like variables with h – frequently do (Patterson et al., 1993; Armstrong et al., 2013). It’s possible that the 3:1 resonance is again involved, but with the tilt instability growing so slowly that only a ‘permanent’ dwarf nova, which is in a high-viscosity state for a long time, can develop sufficient tilt. An alternative theory is the recent work by Thomas & Wood (2015), which invokes white-dwarf magnetism to break the azimuthal symmetry and permit – in fact, create – disc tilt. They make an impressive case; and such an origin would be especially intriguing because UX UMa also shows the very-high-frequency DNOs (signatures of white-dwarf rotation?), which have remained equally mysterious.
UX UMa is not a typical member of this club. Most members belong to the SW Sex subclass, which have shorter (3-4 h), occasional excursions to very low states, and only the feature (lacking , and emphatically lacking ). They also commonly show periodic radial-velocity signals of high amplitude, presumably indicative of the mass-transfer stream overflowing the disc (because of the tilt). Maybe CV zoology needs to be adjusted somewhat, in order to fit these oddities.
Finally, why did we find all these new effects in a star which has been closely studied for 60 years? Did they first arise in 2015? It seems unlikely. Inspection of early light curves (Walker & Herbig, 1954; Johnson, Perkins & Hiltner, 1954) reveals that both the mean brightness and eclipse depths are not constant (see, for instance, Table 1 in Smak (1994)), with variations within the range we have observed in 2015. Also, Knigge et al. (1998b) have reported differences of up to 50 per cent in brightness in Hubble Space Telescope (HST) observations of UX UMa carried out 3 months apart in 1994. They infer that a substantial ( per cent) variation of the mass transfer rate must have occurred, but a precessing disc during the 1994 HST observations would also account for the observed brightness variations. We therefore believe that the mean brightness and eclipse depths were not exceptional in 2015. We selected the star for observation partly because previously published light curves showed variations in the orbital waveform – suggesting that a signal at some nearby frequency might be present. But to actually reveal these effects, an extensive campaign is required, and no such campaign has ever been reported. So it’s a decent bet, though by no means sure, that these superhump effects have been lurking, unsuspected, in many previous observations of UX UMa.
6 Summary
-
(1).
We report a long photometric campaign during 2015, with coverage on 121 of 150 nights, totalling 1800 h. The star displayed a sinusoidal signal with a semi-amplitude of 0.22 mag and a mean period of 3.680(7) d, or a frequency 0.2717(5) c d-1. We identify the latter as , the accretion disc’s (putative) frequency of retrograde nodal precession.
-
(2).
Fig. 1 shows that the orbital waveform is highly variable from day to day, but not from orbit to orbit. Power-spectrum analysis shows that this arises from signals non-commensurate with , namely ‘negative superhumps’ with frequencies and .
-
(3).
The mean orbital light curve – shown in Fig. 3 and summed over more than 200 orbits – shows a wave with maximum light around orbital phase 0.35. This is roughly 180∘ out of phase with the hot-spot effect seen in U Gem, which defines the standard accretion geometry for CVs.
-
(4).
The 3.68 d period is strongly manifest in essentially every quantity we studied. The eclipse times wobble on this period with an amplitude of 33.3(9) s, probably because the disc’s (projected) centre of light moves with that period. The superhump times also wobble with that period, as do the eclipse depths.
-
(5).
Fig. 6 shows that the precession period varied smoothly, decreasing by 0.2 d over the 5-month campaign. As it did, the superhump period changed accordingly, maintaining .
-
(6).
About a dozen other CVs show this basic triad of frequencies (, , and ). Most are so-called SW Sex stars. Because the physics which underlies this category is probably the wobbling non-coplanar disc, it is likely that the credentialing scheme of that club (Thorstensen et al., 1991; Rodríguez-Gil et al., 2007; Dhillon, Smith & Marsh, 2013) will have to change, in order to accommodate UX UMa. We note that Neustroev et al. (2011) has also, based on spectroscopic evidence, proposed that UX UMa has transient episodes of SW Sex behaviour.
Acknowledgments
We thank the National Science Foundation for support of this research (AST12-11129), and also the Mount Cuba Astronomical Foundation. Finally, we thank the American Association of Variable Star Observers (AAVSO) for providing the infrastructure and continued inspiration which makes programs like this possible.
References
- Armstrong et al. (2013) Armstrong E., Patterson J., Michelsen E., Thorstensen J.R., Uthas H., Vanmunster T., Hambsch F.-J., Roberts G., Dvorak S., 2013, MNRAS, 435, 707
- Baptista et al. (1995) Baptista R., Horne K., Hilditch R.W., Mason K.O., Drew J.E., 1995, ApJ, 448, 395
- Baptista et al. (1998) Baptista R., Horne K., Wade R.A., Hubeny I., Long K.S., Rutten R.G.M., 1998, MNRAS, 298, 1079
- Bonnet-Bidaud, Motch & Mouchet (1985) Bonnet-Bidaud J.M., Motch C., Mouchet M., 1985, A&A, 143, 313
- Dhillon, Smith & Marsh (2013) Dhillon V.S., Smith D.A., Marsh T.R., 2013, MNRAS, 428, 3559
- Harvey et al. (1995) Harvey D., Skillman D.R., Patterson J., Ringwald F.A., 1995, PASP, 107, 551
- Henden et al. (2012) Henden A.A., Levine S.E., Terrell D., Smith T.C., Welch D., 2012, JAAVSO, 40, 430
- Johnson, Perkins & Hiltner (1954) Johnson H.L., Perkins B., Hiltner W.A., 1954, ApJS, 1, 91
- Knigge et al. (1998a) Knigge C., Drake N. Long K.S., Wade R.A., Horne K., Baptista R., 1998a, ApJ, 499, 429
- Knigge et al. (1998b) Knigge C., Long K.S., Wade R.A., Baptista R., Horne K., Hubeny I., Rutten R.G.M., 1998b, ApJ, 499, 414
- Krzeminski & Walker (1963) Krzeminski W., Walker M.F., 1963, ApJ, 138, 146
- Lenz & Breger (2005) Lenz P., Breger M., 2005, Commun. Asteroseismol., 146, 53
- Linnel et al. (2008) Linnell A.P., Godon P., Hubeny I., Sion E.M., Szkody P., 2008, ApJ, 688, 568
- Lubow (1991) Lubow S.H., 1991, ApJ, 381, 268
- Montgomery (2009) Montgomery M.M., 2009, ApJ, 705, 603
- Nather & Robinson (1974) Nather R.E., Robinson E.L., 1974, ApJ, 190, 637
- Neustroev et al. (2011) Neustroev V.V., Suleimanov V.F., Borisov N.V., Belyakov K.V., Shearer A., 2011, MNRAS, 410, 963
- Paczynski & Schwarzenberg-Czerny (1980) Paczynski B., Schwarzenberg-Czerny A., 1980, Acta Astron., 30, 127
- Patterson (1981) Patterson J., 1981, ApJS, 45, 517
- Patterson (2011) Patterson J., 2011, MNRAS, 411, 2695
- Patterson & Richman (1991) Patterson J., Richman H., 1991, PASP, 103, 735
- Patterson et al. (1993) Patterson J., Thomas G., Skillman D.R., Diaz M.P., 1993, ApJS, 86, 235
- Patterson et al. (2002) Patterson J., et al., 2002, PASP, 114, 721
- Rodríguez-Gil et al. (2007) Rodríguez-Gil P., et al., 2007, MNRAS, 377, 1747
- Skillman & Patterson (1993) Skillman D.R., Patterson J., 1993, ApJ, 417, 298
- Smak (1971) Smak J., 1971, Acta Astron., 21, 15
- Smak (1994) Smak J., 1994, Acta Astron., 44, 59
- Stanishev et al. (2002) Stanishev V., Kraicheva Z., Boffin H.M.J., Genkov V., 2002, A&A, 394, 625
- Thomas & Wood (2015) Thomas D.M., Wood M.A., 2015, ApJ, 803, 55
- Thorstensen et al. (1991) Thorstensen J.R., Ringwald F.A., Wade R.A., Schmidt G.D., Norsworthy J.E., 1991, AJ, 102, 272
- Walker & Herbig (1954) Walker M.F., Herbig G.H., 1954, ApJ, 120, 278
- Warner & Nather (1971) Warner B., Nather R.E., 1971, MNRAS, 152, 219
- Warner & Nather (1972) Warner B., Nather R.E., 1972, MNRAS, 159, 429
- Whitehurst & King (1991) Whitehurst R., King A., 1991, MNRAS, 249, 25
- Zverev & Kukarkin (1937) Zverev M.S., Kukarkin B.V., 1937, Variable stars, 5, 125