Characterization of the Very Low Mass Secondary in the GJ 660.1AB System
Abstract
We present spectroscopic analysis of the low mass binary star system GJ 660.1AB, a pair of nearby M dwarfs for which we have obtained separated near-infrared spectra (0.9-2.5 ) with the SpeX spectrograph. The spectrum of GJ 660.1B is distinctly peculiar, with a triangular-shaped 1.7 peak that initially suggests it to be a low surface gravity, young brown dwarf. However, we rule out this hypothesis and determine instead that this companion is a mild subdwarf (d/sdM7) based on the subsolar metallicity of the primary, [Fe/H] = 0.630.06. Comparison of the near-infrared spectrum of GJ 660.1B to two sets of spectral models yields conflicting results, with a common effective temperature Teff = 2550–2650 K, but alternately low surface gravity ( = 4.4) and very low metallicity ([M/H] = 0.96), or high surface gravity ( = 5.0–5.5) and slightly subsolar metallicity ([M/H] =0.20). We conjecture that insufficient condensate opacity and excessive collision induced H2 absorption in the models bias them toward low surface gravities and a metallicity inconsistent with the primary, and points toward improvements needed in the spectral modeling of metal-poor, very-low mass dwarfs. The peculiar spectral characteristics of GJ 660.1B emphasize that care is needed when interpreting surface gravity features in the spectra of ultracool dwarfs.
Subject headings:
stars: individual (GJ 660.1A (catalog ), GJ 660.1B (catalog )) — stars: late-type — stars: low mass, brown dwarfsAccepted 24 December 2015
1. Introduction
Our understanding of brown dwarfs and very low mass (VLM; M 0.1 M☉) stars has advanced considerably since the first discovery of substellar objects in the 1990s (Rebolo et al., 1995; Nakajima et al., 1995). Subsequent searches in various wide-field, multi-band infrared imaging surveys have revealed thousands of low-temperature VLM dwarfs, many in the immediate vicinity of the Sun ( 30 pc; Kirkpatrick 2005). Among these, VLM companions to nearby stars have been particularly valuable, as they share the distance, age and composition of their more massive, and more precisely characterized, primaries. Many of these VLM “benchmarks” have been intensely studied, serving as empirical tests of spectral, evolutionary and formation models (e.g., Becklin & Zuckerman 1988; Nakajima et al. 1995; Burgasser et al. 2000; Kirkpatrick et al. 2001; Wilson et al. 2001; Chauvin et al. 2005; Mugrauer et al. 2006; Metchev & Hillenbrand 2006; Saumon et al. 2007; Leggett et al. 2008, 2010; Dupuy et al. 2009; Faherty et al. 2010, 2011; Burningham et al. 2011; Bowler et al. 2012a, b, 2013; Gomes et al. 2013).
Deacon et al. (2014) have recently compiled a sample of VLM companions to nearby stars, many identified in the Pan-STARRS survey (Kaiser et al., 2002). One system not included in this compilation is GJ 660.1AB, identified by Schneider et al. (2011) as an M1 dwarf (Gray et al., 2003) with a relatively faint ( = 4) co-moving secondary at a separation of 608002 (1229 AU). Schneider et al. (2011) estimated a spectral type of M92 for the companion based on its relative brightness. The system has a parallactic distance of 20.01.4 pc, a high proper motion ( = [1815, 6943] mas/yr; van Leeuwen 2007), and a radial velocity of 3310 km s-1 (Hawley et al., 1996). As the Galactic velocity of the system, () = (0.52.1, 523, 604) km s-1, is inconsistent with any nearby young associations (e.g., Zuckerman & Song 2004; Mamajek 2007; Torres et al. 2008) and indicates old disk kinematics (Leggett, 1992), Schneider et al. estimate the age of the system to be older than 2 Gyr. No spectral observations of the companion have yet been reported.
In this article we report separated, near-infrared spectra for GJ 660.1A and B obtained with the NASA Infrared Telescope Facility (IRTF) SpeX spectrograph (Rayner et al. 2003). Section 2 summarizes the observations. Section 3 describes our analysis of the spectra, including classification of the low-resolution data, characterization of spectral peculiarities, and analysis of moderate resolution spectra of the primary which yields the system’s metallicity. Section 4 presents model fitting of the secondary spectrum and corresponding estimates of the effective temperature (Teff), surface gravity (), metallicity ([M/H]) and other physical properties of this source. We discuss our findings in Section 5, focusing in particular on mismatches between the model and observed spectra and their possible origin. For reference, Table 1 summarizes the properties of the GJ 660.1 components based on this and prior work.
| Property | GJ 660.1A | GJ 660.1B | Ref |
|---|---|---|---|
| Spectral Type | M1 | d/sdM7 | 1,2 |
| Distance (pc) | 20.01.4 | 3 | |
| 2MASS | 8.660.03 | 13.050.05 | 4 |
| 2MASS | 8.070.04 | 12.570.02 | 4 |
| 2MASS | 7.940.02 | 12.230.03 | 4 |
| Absolute 2MASS | 7.150.15 | 11.540.15 | 3,4 |
| Absolute 2MASS | 6.560.15 | 11.060.15 | 3,4 |
| Absolute 2MASS | 6.430.15 | 10.720.15 | 3,4 |
| Separation () | 6.080.02 | 2 | |
| Projected separation (AU) | 1229 | 2 | |
| Teff (K) | 3800 | 2550aaBased on BT-Settl spectral model fit; the radius is based on the scale factor between models and data and includes uncertainty in distance; see Section 3.3. | 1,5 |
| (cgs) | 4.74 | bb value from spectral model fits unreliable; see Section 4. | 1,6 |
| 0.470.07ccBased on analysis of SXD data; see Section 3.2.2 and Table 4. | 0.96aaBased on BT-Settl spectral model fit; the radius is based on the scale factor between models and data and includes uncertainty in distance; see Section 3.3. | 1 | |
| 0.630.06ccBased on analysis of SXD data; see Section 3.2.2 and Table 4. | 1 | ||
| Radius (R☉) | 0.530.04 | 0.0850.014aaBased on BT-Settl spectral model fit; the radius is based on the scale factor between models and data and includes uncertainty in distance; see Section 3.3. | 1,6 |
| Mass (M☉) | 0.570.07 | 0.084–0.091 | 1,6 |
2. Observations
Observations of the GJ 660.1AB system with SpeX were made during the nights of 2011 March 9 and 2015 April 9 (UT). Conditions were clear on both nights, with 08 and 06 seeing at -band, respectively. Our 2011 data were obtained with the SpeX prism mode and 05 slit, aligned perpendicular to the binary axis (position angle = 315), which provided 0.7–2.5 coverage in a single order for each component separately with resolution 120 and dispersion of 20–30 Å pixel-1. GJ 660.1B was exposed for 6 images of 90 s each at an airmass of 1.157 while GJ 660.1A was exposed for 8 images for 1 s x 4 coadds each at an airmass of 1.139. We also observed the A0 V star calibrator HD 148968 (B=7.116, V=6.98) for flux calibration, and obtained flat field and HeNeAr arc lamps. In 2015, we observed the primary only with the SpeX cross dispersed mode and 0815 slit aligned at the parallactic angle, providing moderate resolution data ( 750) with dispersion 3.6 Å pixel-1 covering 0.8–2.4 in six orders. Four exposures of 90 s each were obtained at an airmass of 1.139, followed by the same A0 V calibrator star and lamp exposures. Data reduction was performed using the SpeXtool package version 3.4 (Vacca et al., 2003; Cushing et al., 2004), which removes background, bad pixels and instrumental effects and optimally extracts the spectral data. The wavelength scale was calibrated to air wavelengths using the arc lamp spectrum, and slit and telluric transmission losses were corrected using the A0 V star observation.
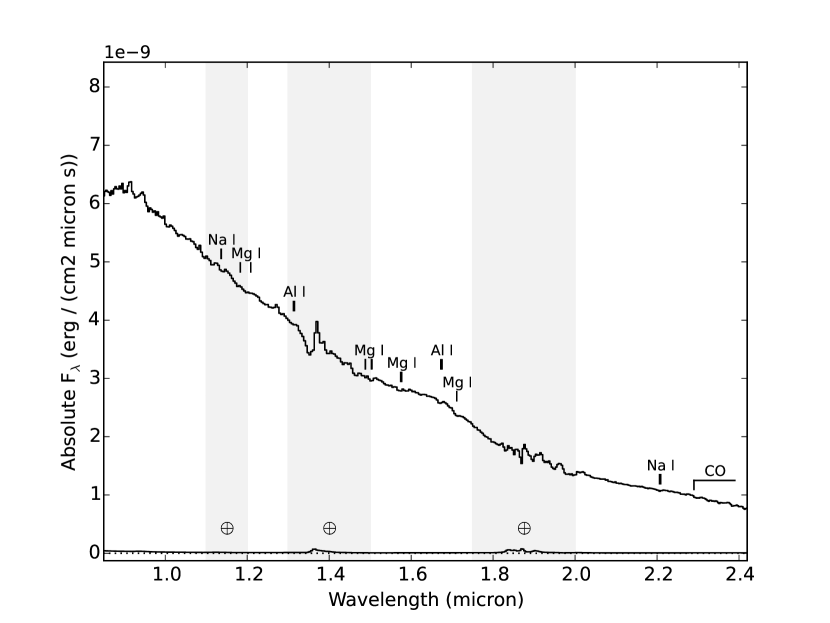
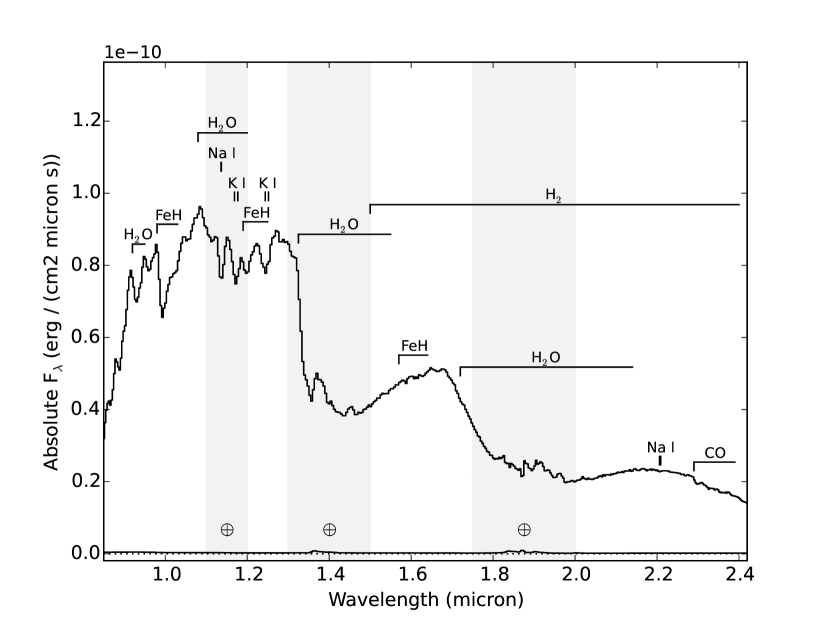
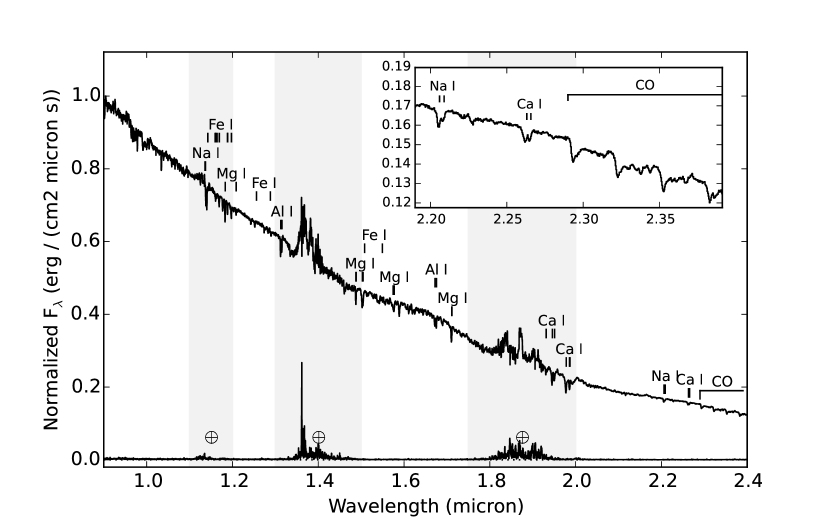
The reduced prism spectra of GJ 660.1A and B are displayed in Figure 1, while the reduced SXD spectrum of GJ 660.1A is shown in Figure 2. The spectra of the primary show features consistent with its M1 optical classification, including H2O (0.92–0.95 , 1.08–1.20 , 1.325–1.450 and 1.72–2.14 ) and CO (2.3 ) absorption, and numerous atomic metal lines in the moderate-resolution data (Leggett et al., 2001; Rayner et al., 2009). We analyze this spectrum in further detail in Section 3.2.2. The secondary spectrum exhibits features consistent with late M/early L dwarfs, including absorption from H2O, CO and FeH molecules (1.0 and 1.2 ), and several unresolved alkali lines including K I (1.25 ) and Na I (1.51 ; Reid et al. 2001; Leggett et al. 2001). This confirms the photometric classification of Schneider et al. (2011). There are a few clear peculiarities in the spectrum of this source, including its triangle-shaped H-band peak and shallow CO absorption, that are discussed in detail below.
3. Spectral Analysis
3.1. Classification of GJ 660.1B
To refine the classification of GJ 660.1B, we first considered the spectral indices and index-SpT relations from Allers et al. (2007). All measured indices had uncertainties estimated from spectral noise through Monte Carlo techniques, and these were propagated into the spectral type determinations along with each relation’s intrinsic scatter. These measurements (Table 2) resulted in a classification of M9.50.3, driven primarily by the strong H2O absorption present in the spectrum of this source.
We then compared the spectrum of GJ 660.1B directly to the M and L dwarf spectral standards defined in Kirkpatrick et al. (2010) using a chi-square statistic:
| (1) |
where is the measured spectral flux density of GJ 660.1B, is the uncertainty of this spectrum, is the spectrum of standard , and is the optimal scaling factor computed as
| (2) |
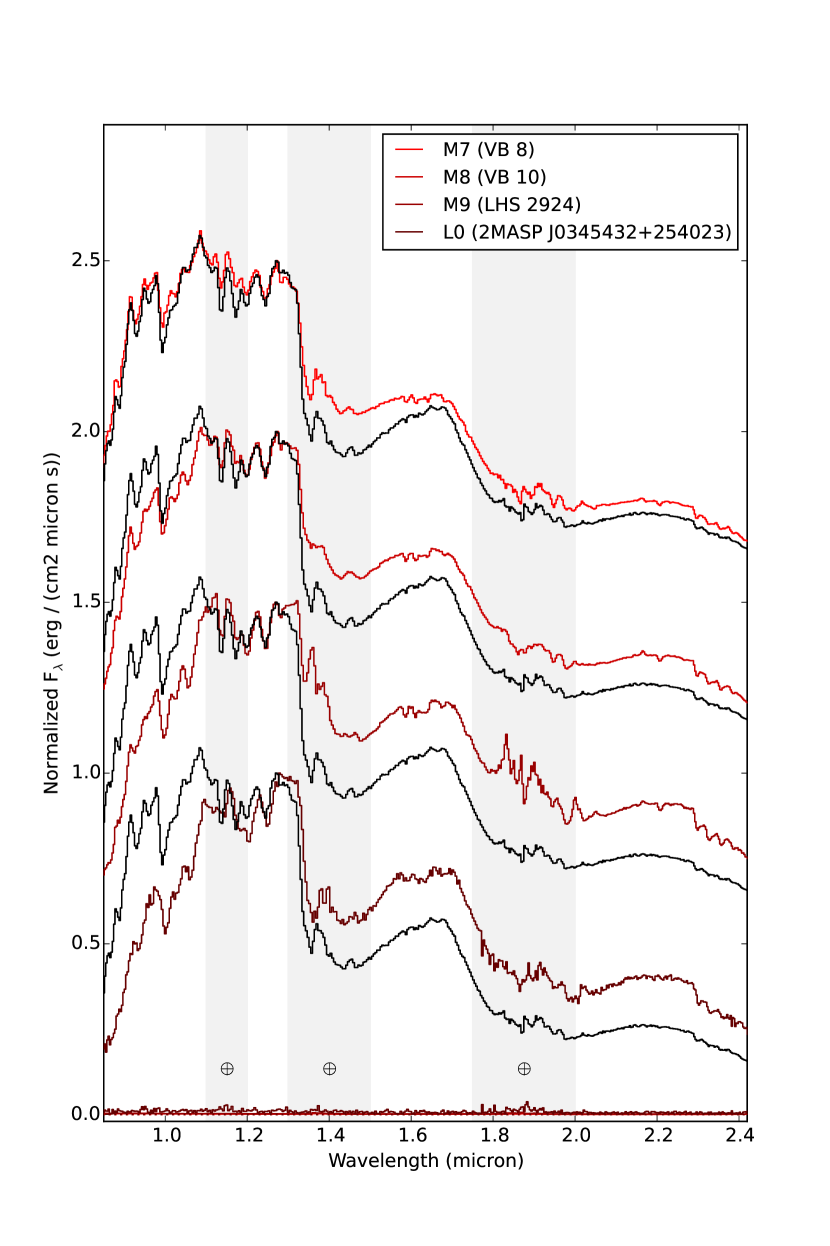
(see Cushing et al. 2008). Following the procedure described in Kirkpatrick et al. (2010), all sums were performed over the wavelength bins spanning 0.9–1.4 . The spectral standard with the lowest was found to be the M7 dwarf VB 8 (van Biesbroeck, 1961), but the agreement is poor beyond 1.35 (Figure 3). The M8, M9 and L0 spectral standards are also poor matches to the spectrum of GJ 660.1B across the 0.8–2.4 near-infrared band.
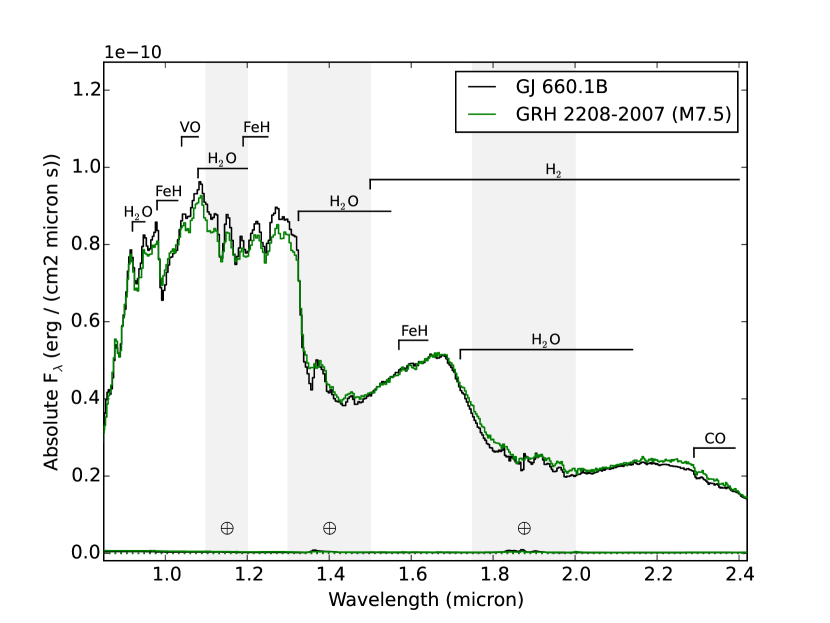
Finally, we compared the spectrum of GJ 660.1B to 911 optically-classified M5–L5 spectra in the SpeX Prism Library (SPL; Burgasser 2014) using the same fit statistic as above. Comparisons were made over the wavelength ranges 0.7–1.35 , 1.42–1.8, and 1.92–2.45 to avoid regions of strong telluric absorption. The best-fit template using the same statistic above is the high proper-motion ( = [12450, 8218] mas yr-1) M7.5 brown dwarf GRH 2208-2007 (Tinney et al., 1998; Cruz et al., 2003; Deacon et al., 2005, Figure 4) which fits significantly better than VB 8, although GJ 660.1B has a somewhat bluer overal spectral energy distribution (SED).
In summary, we found significant discrepancies in the classifcation of GJ 660.1B between three methods, with results ranging from M7 (standards) to M9.5 (indices). More importantly, the spectrum deviates significantly from the spectral standards in this type range. A robust classification of this source requires more detailed examination of these peculiarities.
3.2. Peculiarities in the Spectrum of GJ 660.1B
3.2.1 Hypothesis 1: A Young Brown Dwarf
The spectrum of GJ 660.1B exhibits an -band (1.7 ) peak that resembles those of many low surface gravity brown dwarfs in young clusters and associations (e.g., Lucas et al. 2001; Kirkpatrick et al. 2006; Allers et al. 2007; Allers & Liu 2013a). This spectral region in M and L dwarfs is shaped by H2O and FeH molecular bands and H2 collision-induced absorption (CIA; Linsky 1969; Borysow et al. 1997; Burgasser et al. 2008b; Allers & Liu 2013a), the last of which is a pressure-sensitive opacity source. Its triangle-shaped -band peak suggests that GJ 660.1B may have a low surface gravity. To quantify this hypothesis, we used the index-based gravity classification scheme of Allers & Liu (2013a), which examines gravity-sensitive features from VO, FeH, alkali lines and continuum shape. For a classification of M9.5, the resulting gravity scores (Table 3) yield a classification of INT-G (intermediate low surface gravity), which is consistent with objects of ages 100–300 Myr (Allers & Liu, 2013a). However, if we assume a spectral type of M7, the scores instead yield a FLD-G (field dwarf) gravity classification.
| Index | Value | Gravity | Gravity |
|---|---|---|---|
| Score (M9.5) | Score (M7) | ||
| VO-z | 1.0040.004 | – | – |
| FeH-z | 1.1890.006 | 0 | 0 |
| H-cont | 0.9610.006 | 1 | 0 |
| KI-J | 1.0840.003 | 1 | 0 |
| Mean | INT-G | FLD-G |
Note. — Indices defined in Allers & Liu (2013a).
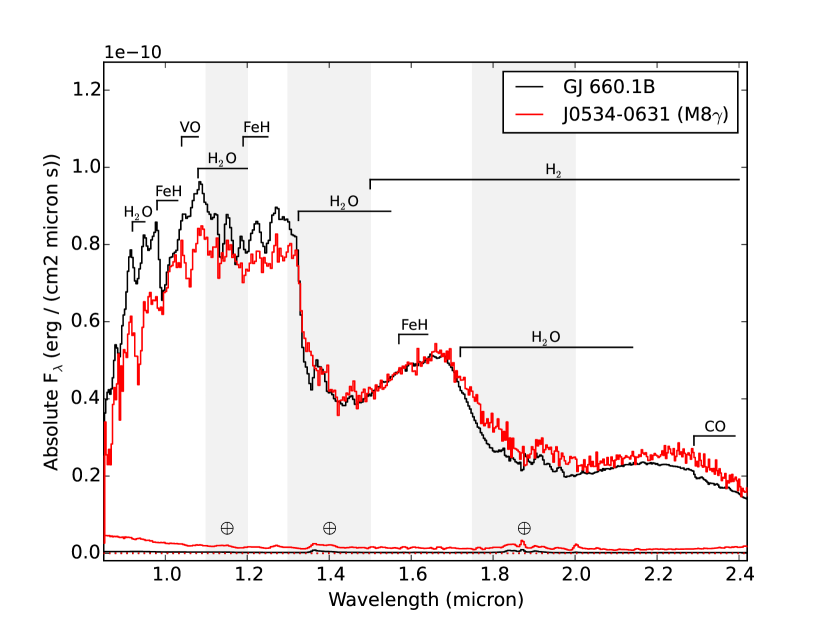
To assess these conflicting results, we compared the spectrum of GJ 660.1B directly to other low- and intermediate-gravity spectra in the SPL. The best-matching case is the M8111The suffix is assigned for ages 10–30 Myr (Cruz et al., 2009; Kirkpatrick et al., 2010), although 2MASS J053415920631401 has not yet been assigned to a particular association or moving group (J. Gagne, 2015, private communication)./M8 VLG 2MASS J053415920631401 (Kirkpatrick et al. 2010; Allers & Liu 2013a; Figure 5). While the -band peaks are similar between these sources, there is a clear mismatch in the 0.9–1.4 region. While 2MASS J053415920631401 shows weak FeH absorption at 1.0 and strong VO at 1.05 , the spectrum of GJ 660.1B has strong FeH and no discernable VO band. In addition, the overall SED of GJ 660.1B is significantly bluer ( = 0.820.06) than comparably classified dwarfs ( = 1.080.19 for M7 dwarfs, = 1.200.22 for M9 dwarfs; Faherty et al. 2009), whereas young brown dwarfs tend to be 0.1–0.3 magnitudes redder (Faherty et al., 2012). We therefore conclude that GJ 660.1B is not young, and that its peculiarities arise from another source.
3.2.2 Hypothesis 2: A Metal-Poor Dwarf
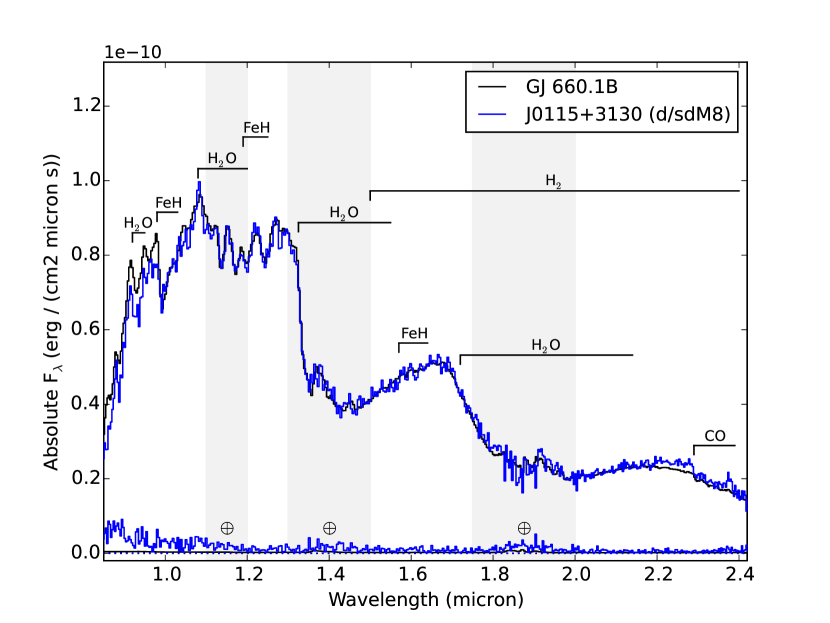
The best-matching SPL spectra to GJ 660.1B have common physical properties. Two particularly good matches are 2MASS J01151621+3130061, a moderately metal-poor d/sdM8 dwarf (Bowler et al., 2009, Figure 5); and HD 114762B, a d/sdM91 which is a companion to a metal-poor star ([Fe/H] = 0.7; Latham et al. 1989; Hale 1995; Bowler et al. 2009). The d/sd “mild subdwarf” classifications of these sources reflect spectral peculiarities arising from their slightly sub-solar metallicities (Burgasser et al., 2007). These spectra show the same triangular-shaped -band peaks, strong FeH and alkali line absorption, and blue SEDs as GJ 660.1B.
To validate this hypothesis, we used the moderate-resolution near-infrared SpeX spectrum of GJ 660.1A (Figure 2) to re-assess its metallicity. As described in Rojas-Ayala et al. (2010, 2012), metal lines in the near-infrared can be used to determine the metallicities of M-type dwarfs based on empirical calibrations from M dwarf companions to FGK stars. We used the metallicity calibration relations defined by Rojas-Ayala et al. (2012), Terrien et al. (2012), Mann et al. (2013), and Newton et al. (2014), which are based on the equivalent widths of the 1.516 K I, 2.205 Na I, and 2.263 Ca I metal lines and the H2O spectral indices defined in Covey et al. (2010) and Rojas-Ayala et al. (2012). The resulting estimates of [Fe/H] and [M/H] are listed in Table 4. All of the estimates are in agreement except those from Terrien et al. (2012), which exhibit a large difference between - and -band calibrations. Rejecting these, we determine mean values of [Fe/H] = 0.630.06 and [M/H] = 0.470.07 for GJ 660.1A. The former is lower than but statistically consistent with [Fe/H] = 0.880.13 as reported by Gaidos et al. (2014), based on the calibration of optical metal lines given by Mann et al. (2013). We adopt the near-infrared metallicity determination for GJ 660.1A the remainder of this study.
| Method | [Fe/H] | [M/H] |
|---|---|---|
| Rojas-Ayala et al. (2012) -band | 0.570.14 | 0.400.10 |
| Terrien et al. (2012) -band | 0.180.12aaNot included in uncertainty-weighted mean. | |
| Terrien et al. (2012) -band | 1.080.12aaNot included in uncertainty-weighted mean. | |
| Mann et al. (2013) -band | 0.600.07 | 0.320.08 |
| Mann et al. (2013) -band | 0.620.08 | 0.520.06 |
| Mann et al. (2013) -band | 0.640.06 | 0.500.05 |
| Newton et al. (2014) -band | 0.800.13 | |
| Weighted Mean | 0.630.06 | 0.470.07 |
| Optical (Gaidos et al., 2014) | 0.880.13 |
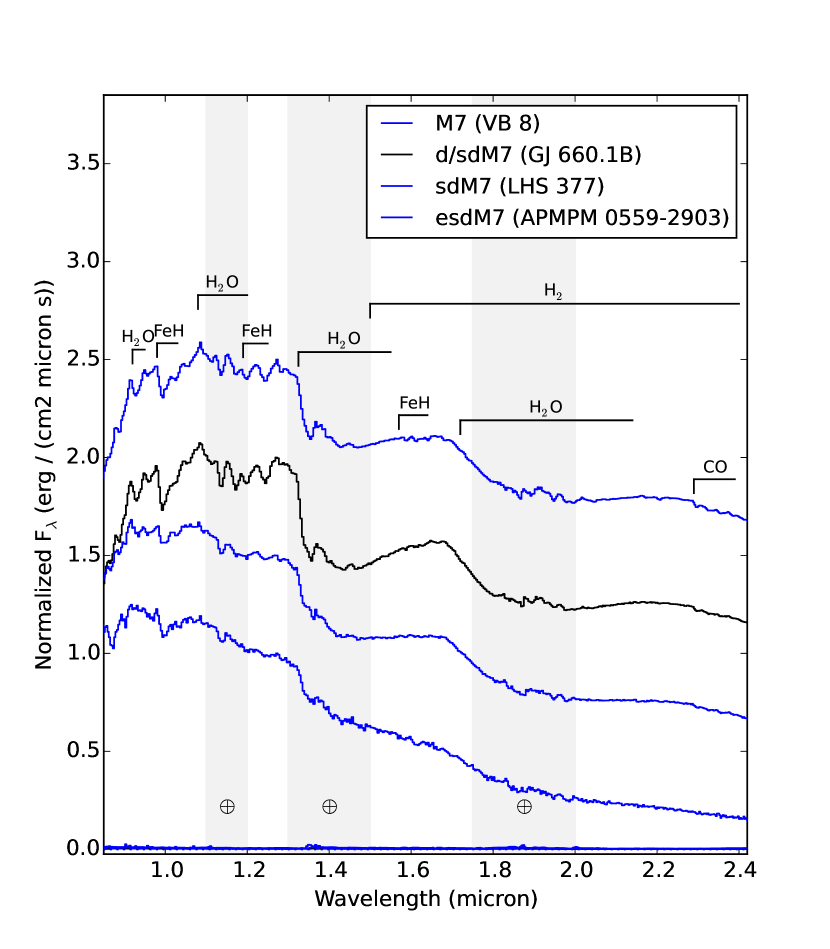
The proximity and co-movement of the two components of GJ 660.1AB strongly indicate coevality, and the subsolar metallicity of the primary supports our second hypothesis that the spectral peculiarities seen in GJ 660.1B likely arise from low metallicity effects. These peculiarities are not as extreme as those seen in M subdwarfs and extreme M subdwarfs, as illustrated in Figure 6, which shows that the near-infrared spectral morphology of GJ 660.1B is intermediate between those of M7 and sdM7 dwarfs. Following Bowler et al. (2009) and Kirkpatrick et al. (2010), we assign a classification of d/sdM7 for this source based on its similarity to the M7 standard over 0.9–1.4 and mild low metallicity features across the full SED (see also Jao et al. 2008).
3.2.3 Hypothesis 3: An Unresolved Binary
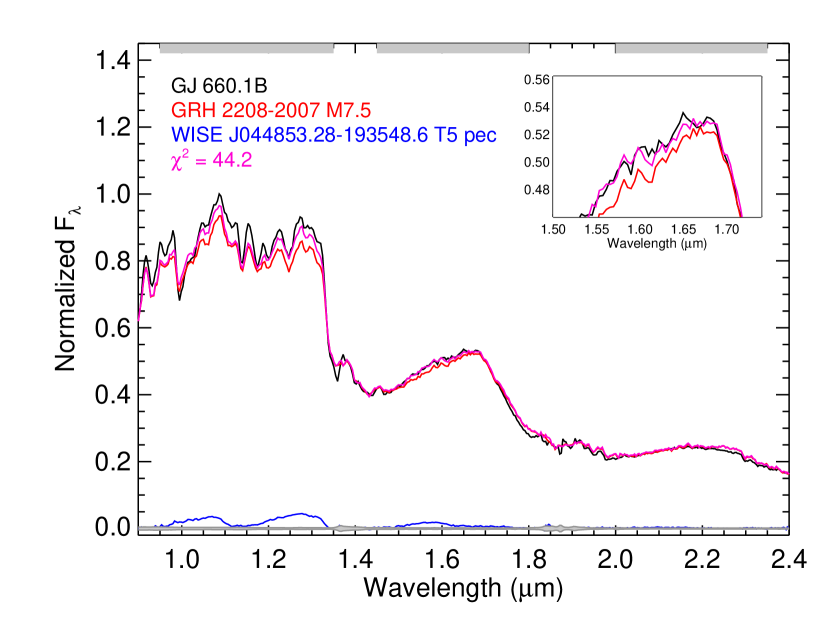
We also considered a third hypothesis, that the unusual spectral features of GJ 660.1B arise from the spectral contamination of an unresolved binary (or in this case, tertiary) companion. This scenario has used to explain peculiar spectral features in several late M dwarfs which are suspected or have been confirmed to host T dwarf companions (e.g., Burgasser et al. 2008a, 2012, 2015; Bardalez Gagliuffi et al. 2014). To examine this hypothesis, we followed the methods described in Burgasser et al. (2010) and Bardalez Gagliuffi et al. (2014), comparing the spectrum of GJ 660.1B to 487 M6–L2 dwarfs not previously classified as metal-poor, young or binary in the SPL. We then constructed 279,237 synthetic binary template spectra from these primaries and 574 L0–T6 dwarfs (assuming the secondary spectral type is the same or later than the primary type), using the Dupuy & Liu (2012) versus spectral type relation to scale the individual component spectra. Figure 7 displays the best-fit binary templates resulting from this analysis, which is a combination of GRH 2208-2007 and the T5 pec dwarf WISE J044853.28193548.6 (Kirkpatrick et al., 2011). While the binary template is a better fit ( = 44.2 versus 75.2), it fails to surpass the 99% significance threshold in an F-test comparison, and fails to reproduce structure in the 1.0–1.2 and 2.2–2.3 range. We therefore conclude that unresolved multiplicity is not the most likely source for the observed spectral peculiarities of GJ 660.1B.
3.3. Model Fitting
3.3.1 Methodology
To better quantify the physical parameters of GJ 660.1B, we compared its spectrum to two sets of atmosphere models characterized by Teff, and [M/H]: the BT-Settl models (Allard et al. 2011) and the Drift models (Helling et al., 2008a; Witte et al., 2009, 2011). For the former, we sampled models spanning effective temperatures Teff = 1400–2900 K, (in cm s-2) = 3.5–5.5, and [M/H] = 4.0 to +0.5; for the latter, we sampled Teff = 1700–3000 K, = 5.0–5.5, and [M/H] = 3.0 to 0.0. In both cases, the models were originally calculated every 100 K in Teff, 0.5 dex in and 0.5 dex in [M/H], and at much higher resolution than the SpeX data. We smoothed the models to = 120 using a Hann filter and interpolated onto a common wavelength scale. As the models are calculated in units of surface flux densities, we calibrated the observed spectrum of GJ 660.1B to absolute flux densities using its absolute 2MASS -band magnitude ( = 11.540.16; Schneider et al. 2011). The optimal scaling factor (Eqn 2) is then = / = (R/10 pc)2, where R is the radius of GJ 660.1B. These fits therefore provide an estimate of the source size (Bowler et al., 2009).
We deployed a Markov Chain Monte Carlo (MCMC) code with a Metropolis-Hastings algorithm (Metropolis et al., 1953; Hastings, 1970) to identify the best-fit model parameters and uncertainties for both sets of atmosphere models. We used initial estimates of Teff = 2650 K based on its d/sdM7 spectral type and the Teff/spectral type relations of Stephens et al. (2009); Marocco et al. (2013) and Filippazzo et al. (2015). We also assumed = 5.0, which is typical for a field late M dwarf; and [M/H] = 0.0. Two 105-step chains were run in which our three model parameters were alternately updated using step sizes drawn from normal distributions of width Teff = 50 K, = 0.25, and [M/H] = 0.25. Models at intermediate parameter values were linearly interpolated in logrithmic flux and compared to the observed spectrum using the same statistic as Eqn 1. The criterion to adopt a successive parameter was , where is a random number drawn from a uniform distribution between 0 and 1. We eliminated the first 10% of each chain before evaluation of the model parameters.
3.3.2 Results
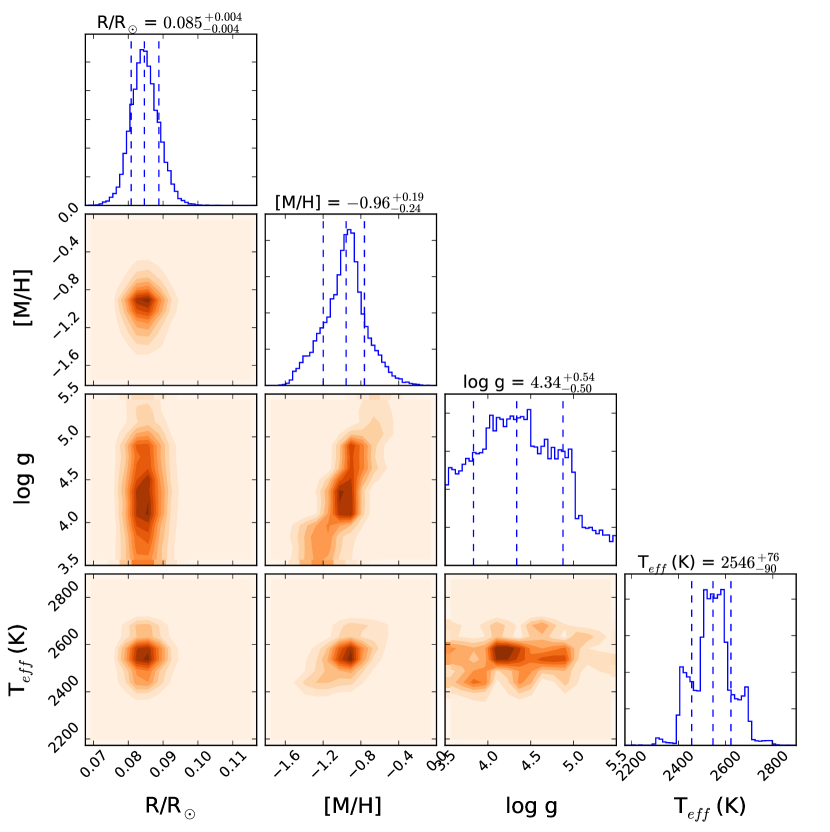
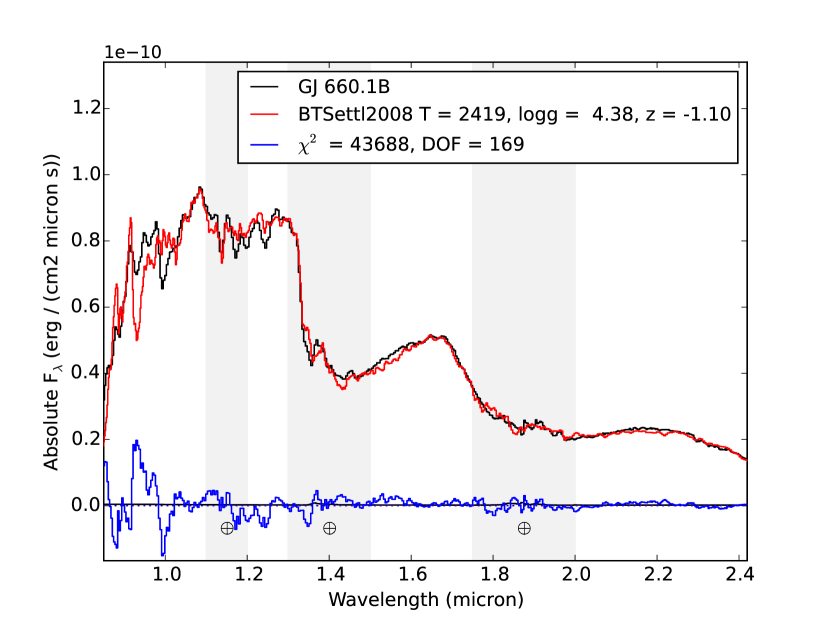
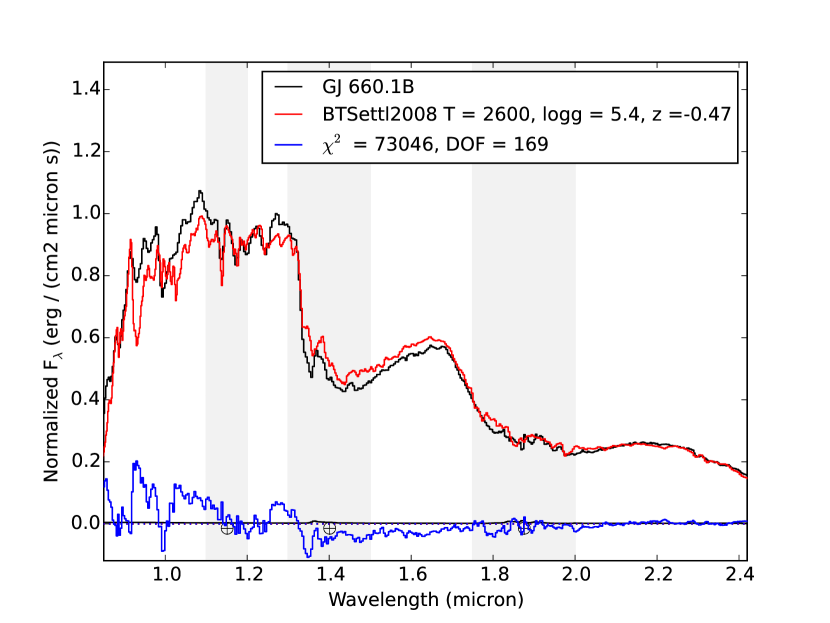
The distributions222Structure in the parameter distributions is primarily an artifact of the model interpolation scheme employed. of model parameters are shown in Figures 8 and 9, and summarized in Table 5. For the BT-Settl models, we find median parameters of Teff = 2550 K, = 4.4, and [M/H] = 0.96, where uncertainties represent the 16% and 84% quantiles in the marginalized parameter distributions. Both Teff and [M/H] are well-constrained, the former consistent with the classification of the source. However, the metallicity is 2.4 lower than the metallicity determined for the GJ 660.1A. Surface gravity constraints are weaker, and the fits primarily limit 5.0. As discussed below, this is problematic, as it predicts a very low mass and age for GJ 660.1B, contrary to the comparative analysis above. There is a strong correlation between [M/H] and , with a slope of d[M/H]/d 0.35. This likely arises from a trade-off in the strength of H2 CIA, which increases with both increasing surface gravity and decreasing metallicity (e.g., Witte et al. 2009). Solutions with 5 have mean metallicities of 0.630.15, which is more in line with the metallicity of GJ 660.1A. In contrast, the best-fit model (Figure 10) has both a low = 3.85 and a very low [M/H] = 1.20. This model is a reasonable match to the SED of GJ 660.1B beyond 1.4 but poorly reproduces the detailed features in the 0.9–1.4 region, most notably FeH absorption at 1.0 and 1.2 . Higher surface gravity and higher metallicity models match the 1.4 wavelength end of the spectrum better, but poorly reproduce the full SED.
| Spectral Models | ||||
|---|---|---|---|---|
| Spectral Model | Teff (K) | () | Radius () | |
| BT-Settl | 0.96 | 2550 | 4.4 | 0.085 |
| Drift | 0.20 | 2650 | 5.0–5.5 | 0.0780.013 |
| Spectral and Evolutionary Models | ||||
| Models | Mass (M⊙) | Age (Gyr) | Luminosity (L⊙) | Radius (R⊙) |
| BT-Settl & Baraffe | 0.038 | 0.022 | 2.8 | 0.23 |
| BT-Settl & Burrows | 0.031 | 0.027 | 2.9 | 0.21 |
| Drift & Baraffe | 0.088 | 0.6 | 3.19 | 0.120 |
| Drift & Burrows | 0.078 | 0.4 | 3.26 | 0.110 |
The radius inferred from the scale factor is 0.0850.014 R☉, where we have incorporated the uncertainty in the distance determination. This is smaller than, but not inconsistent with, radius estimates of 0.10–0.11 R☉ based on the evolutionary models (Burrows et al., 2001; Baraffe et al., 2003) for Teff = 2550 K and an age = 5 Gyr. However, at this age evolutionary models predict a surface gravity of 5.3–5.4, considerably higher than the surface gravity inferred from the atmosphere model fits. For the median Teff and from these fits, the evolutionary models of Baraffe et al. (2003) predict a mass M = 0.038 M☉, = 22 Myr and Revol = 0.23 R☉, all consistent with a very young brown dwarf, our rejected hypothesis. The Burrows et al. (2001) evolutionary models yield similar parameters (Table 5). Note that the evolutionary radius is nearly three times larger (1.8 discrepant) than the scaling factor radius. Bringing these into agreement requires a higher in order to lower Revol, since the scaling factor is primarily set by the Teff of the model (which is uncorrelated with the other parameters) and the observed absolute magnitude of GJ 660.1B.
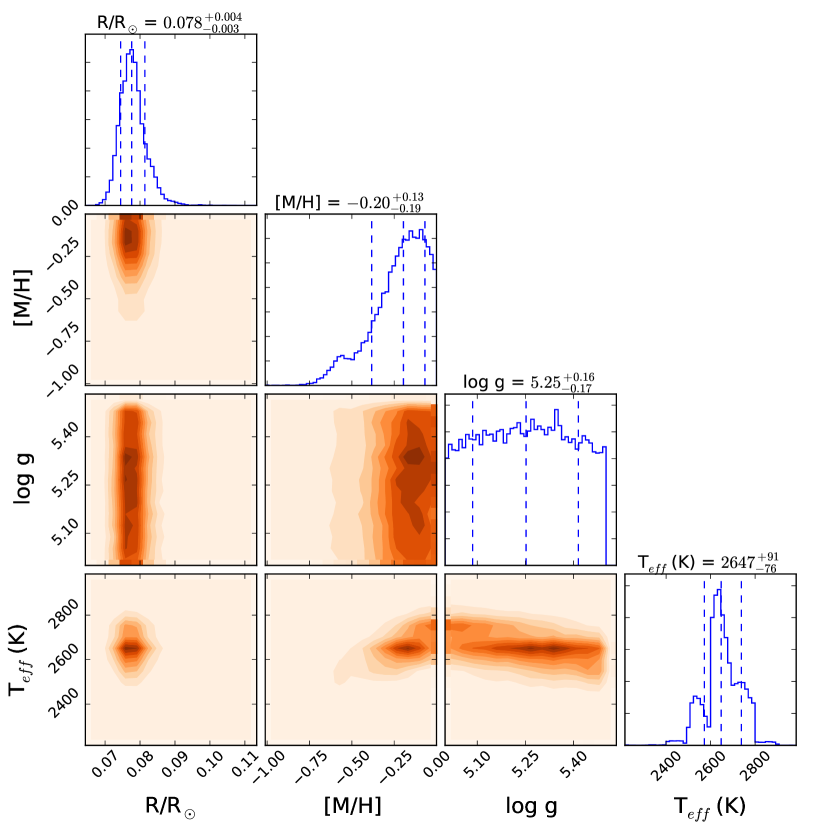
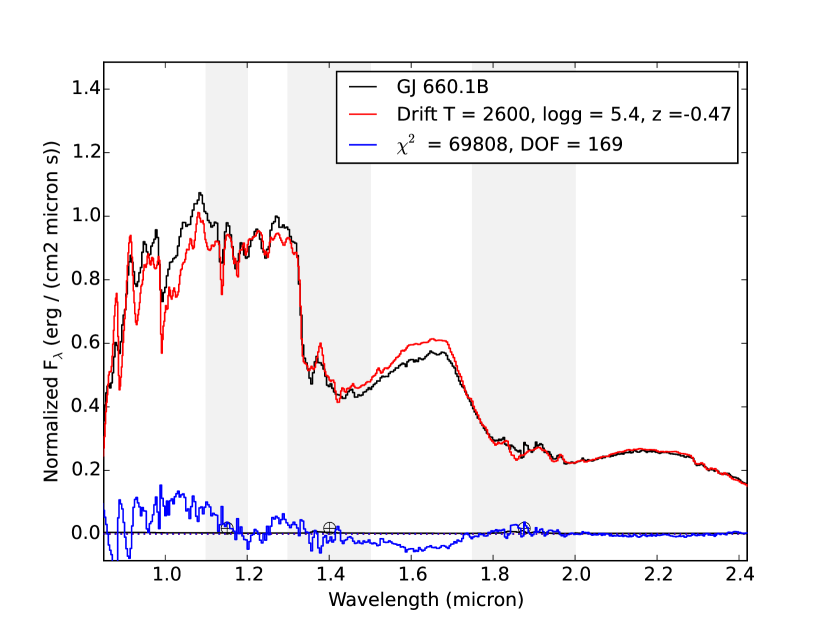
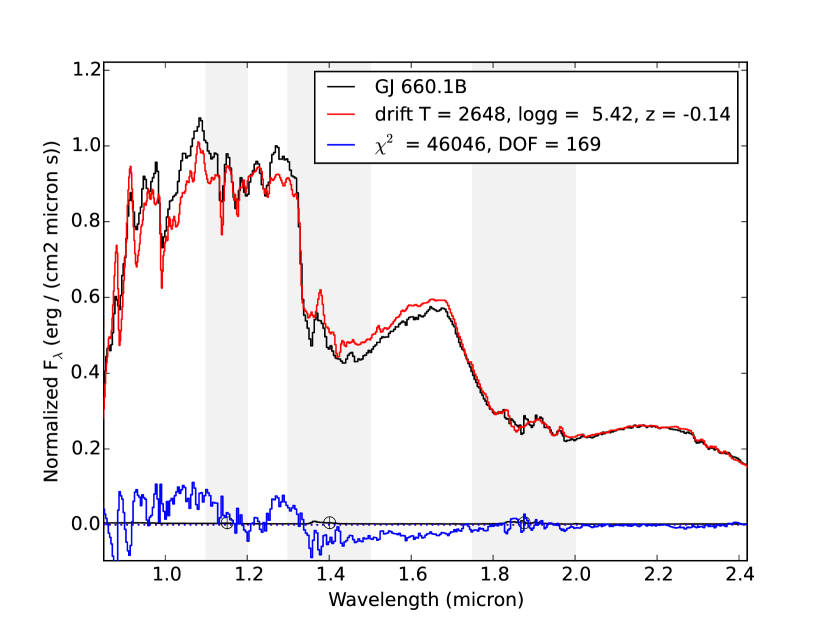
For the Drift models, we find an equivalent Teff = 2650 K and R = 0.0780.013 R☉, but a much higher [M/H] = 0.20, although the metallicity distribution has a long tail toward lower values. The Drift models were constrained to have 5.0 5.5, and there is no clearly preferred value in that range from the MCMC analysis. The Drift metallicity is inconsistent with that derived from the BT-Settl model (2.8 discrepant) and considerably lower than metallicity of the primary (1.3 discrepant), and this may be related to the surface gravity limits on the Drift models. There also appears to be a slight positive correlation between Teff and [M/H] and a slight negative correlation between Teff and in these fits. The best-fit Drift model (Figure 11) is a much better (although far from perfect) match to the 0.9–1.4 region as compared to the best-fit BT-Settl model, but a poorer match to the full near-infrared SED. For the median parameters, the evolutionary models of Baraffe et al. (2003) predict M = 0.088 M☉, = 0.6 Gyr and Revol = 0.120 R☉, which is biased toward higher masses and older ages by the constraint; again, the Burrows et al. (2001) models yield similar values. Despite the smaller evolutionary model radius, there remains a 2.8 disagreement between it and the scaling factor radius.
4. Discussion
Our spectral model fit analysis yields mixed results in elucidating the roles of surface gravity and metallicity in shaping the peculiar spectrum of GJ 660.1B. The models affirm a subsolar metallicity for this source, bracketing the metallicity determined for the primary. However, the BT-Settl models also converge on surface gravities that are appropriate for a very young brown dwarf (100 Myr), which disagrees with the kinematics of the system and comparison of the spectrum of GJ 660.1B to young template spectra. In addition, neither of the model sets produce a “best-fit” that is an accurate representation of the data. The low metallicity, low surface gravity BT-Settl model roughly reproduces the 1.4 SED of GJ 660.1B, but fails to match the molecular and atomic features for 1.4 . The high metallicity, high surface gravity Drift model has the opposite problem.
Bowler et al. (2009) reported similar disagreements in their analysis of the d/sdM9 companion to the metal-poor F9 star of HD 114762 ([Fe/H] = 0.7). Their Phoenix/GAIA model fits (Brott & Hauschildt, 2005) to low-resolution near-infrared spectra of HD 114762B converged to very low surface gravities, and retained a high . The study concluded that spectral models did not fit the low-resolution spectra of these low-metallicity, low-temperature sources, whereas moderate resolution spectra yielded better fits. Burgasser et al. (2009), Witte et al. (2011) and Manjavacas et al. (2014) have found comparable problems for late-M and L dwarf and subdwarf low-resolution spectra and photometry.
What is causing the models to fail? We conjecture that the interplay of two opacity sources are primarily responsible: condensate cloud opacity and H2 CIA. Condensates become an important opacity source in the atmospheres of late M and L dwarfs, producing a scattering haze that suppresses the 0.9–1.4 continuum (Allard et al., 2001; Ackerman & Marley, 2001; Cooper et al., 2003; Helling et al., 2008b). Burgasser et al. (2003, 2007) and Gizis & Harvin (2006) have conjectured that condensate production is inhibited in metal-poor late M and L subdwarfs, based on their exceptionally blue near-infrared SEDs () and persistent TiO optical bands. This has been confirmed in theoretical calculations by Witte et al. (2009), which demonstrated that grain production persists in low metallicity dwarfs but with an overall opacity that declines with metallicity; and by the absolute magnitudes of subdwarfs, which are brighter than equivalently classified dwarfs (Schilbach et al., 2009; Faherty et al., 2012). Pressure-sensitive H2 CIA, on the other hand, strengthens in both higher surface gravity and metal-poor dwarfs (), suppressing -band flux and producing bluer SEDs. Both of these trends—reduced condensate opacity and stronger H2 absorption—qualitatively explain the bluer SED tilt and stronger FeH and alkali absorption in the spectrum of GJ 660.1B and other metal-poor dwarfs as compared to field standards (Figure 3).
However, these opacity sources do not appear to be accurately represented in the models. Analysis of field M and L dwarf SPL spectra has shown that the Drift models, even with a prescription for metallicity-dependent condensate grain formation, underpredict condensate opacity in dwarfs with Teff 1900 K, resulting in SEDs that are bluer than observed (Witte et al., 2011). Similarly, Allard et al. (2011) have commented that BT-Settl models, and perhaps “all the current cloud models” fail to produce sufficient condensate absorption at the M dwarf/L dwarf transition. Separately, new calculations by Abel et al. (2012) and Frommhold et al. (2010) indicate current models may be excessively blue in the near-infrared due to incorrect H2 CIA opacity. Saumon et al. (2012) estimate that revised opacities translate into a 44% decrease in -band absorption at 2000 K for cloud-free atmosphere models.
We surmise that both insufficient condensate opacity and excessively strong H2 CIA are present in the Drift and BT-Settl models examined here, which are too blue and therefore biasing fits toward lower surface gravities (BT-Settl) and higher metallicities (Drift). These biases are apparent when we compare our GJ 660.1B spectrum to models for an “expected” parameter set (Teff = 2600 K, = 5.3 and [M/H] = 0.65), which exhibit excessively strong molecular bands over 1.0–1.2 , excess flux at -band and excess continuum suppression at -band (Figures 10 and 11). Increasing condensate opacity in the models would mute the molecular gas features, while both grain scattering and weaker H2 opacities would produce a redder tilt to the SED without the need for lower surface gravities. GJ 660.1B, HD 114762B, and other late M and L dwarf companions to metal-poor stars will be useful benchmarks for testing updated condensate and H2 CIA opacities in future atmosphere models.
Finally, we comment on the most interesting spectral peculiarity of GJ 660.1B, its triangular-shaped -band continuum. As discussed above, this feature is typically associated with low surface gravity sources and attributed to reduced H2 CIA in a low-pressure atmosphere. However, it has also been reported in the spectra of high proper motion late-M dwarfs with no evidence of youth (Kirkpatrick et al., 2010), and is present in the spectra of both GJ 660.1B and HD 114762B (Bowler et al., 2009). These common features point to subsolar metallicity as the likely source. However, more metal-poor late-M and L subdwarfs do not exhibit this feature (Burgasser et al. 2003, 2009; Kirkpatrick et al. 2010, 2014; Figure 6). An additional opacity source that may help shape the -band continuum of mild subdwarfs is the 1.55–1.60 FeH absorption band (Cushing et al., 2003; Dulick et al., 2003). Like its 1.0 and 1.2 counterparts, we expect this feature to be enhanced in the spectra of mild subdwarfs, resulting in a sloped, rather than flat, -band continuum. Stronger H2O absorption, a consequence of reduced condensate opacity, may also play a role in shaping this feature, while simultaneously skewing index-based near-infrared classifications to later types (Section 3.1). The presence of this feature, and its influence on the gravity indices, counters the claim of Allers & Liu (2013b) that metal-poor dwarfs cannot be misclassified as low gravity by this technique. However, we concur with these authors that “caution should be used when determining” near-infrared spectral types with indices alone. We advocate full-spectum comparisons as a more robust method for characterizing VLM dwarfs with unusual spectral and physical properties.
References
- Abel et al. (2012) Abel, M., Frommhold, L., Li, X., & Hunt, K. L. C. 2012, J. Chem. Phys., 136, 044319
- Ackerman & Marley (2001) Ackerman, A. S., & Marley, M. S. 2001, ApJ, 556, 872
- Allard et al. (2001) Allard, F., Hauschildt, P. H., Alexander, D. R., Tamanai, A., & Schweitzer, A. 2001, ApJ, 556, 357
- Allard et al. (2011) Allard, F., Homeier, D., & Freytag, B. 2011, in Astronomical Society of the Pacific Conference Series, Vol. 448, 16th Cambridge Workshop on Cool Stars, Stellar Systems, and the Sun, ed. C. Johns-Krull, M. K. Browning, & A. A. West, 91
- Allers & Liu (2013a) Allers, K. N., & Liu, M. C. 2013a, ApJ, 772, 79
- Allers & Liu (2013b) —. 2013b, Mem. Soc. Astron. Italiana, 84, 1089
- Allers et al. (2007) Allers, K. N., Jaffe, D. T., Luhman, K. L., et al. 2007, ApJ, 657, 511
- Baraffe et al. (2003) Baraffe, I., Chabrier, G., Barman, T. S., Allard, F., & Hauschildt, P. H. 2003, A&A, 402, 701
- Bardalez Gagliuffi et al. (2014) Bardalez Gagliuffi, D. C., Burgasser, A. J., Gelino, C. R., et al. 2014, ApJ, 794, 143
- Becklin & Zuckerman (1988) Becklin, E. E., & Zuckerman, B. 1988, Nature, 336, 656
- Borysow et al. (1997) Borysow, A., Jorgensen, U. G., & Zheng, C. 1997, A&A, 324, 185
- Bowler et al. (2009) Bowler, B. P., Liu, M. C., & Cushing, M. C. 2009, ApJ, 706, 1114
- Bowler et al. (2013) Bowler, B. P., Liu, M. C., Shkolnik, E. L., & Dupuy, T. J. 2013, ApJ, 774, 55
- Bowler et al. (2012a) Bowler, B. P., Liu, M. C., Shkolnik, E. L., et al. 2012a, ApJ, 753, 142
- Bowler et al. (2012b) Bowler, B. P., Liu, M. C., Shkolnik, E. L., & Tamura, M. 2012b, ApJ, 756, 69
- Brott & Hauschildt (2005) Brott, I., & Hauschildt, P. H. 2005, in ESA Special Publication, Vol. 576, The Three-Dimensional Universe with Gaia, ed. C. Turon, K. S. O’Flaherty, & M. A. C. Perryman, 565
- Burgasser (2004) Burgasser, A. J. 2004, ApJ, 614, L73
- Burgasser (2014) Burgasser, A. J. 2014, in Astronomical Society of India Conference Series, Vol. 11, Astronomical Society of India Conference Series, 7–16
- Burgasser et al. (2010) Burgasser, A. J., Cruz, K. L., Cushing, M., et al. 2010, ApJ, 710, 1142
- Burgasser et al. (2007) Burgasser, A. J., Cruz, K. L., & Kirkpatrick, J. D. 2007, ApJ, 657, 494
- Burgasser & Kirkpatrick (2006) Burgasser, A. J., & Kirkpatrick, J. D. 2006, ApJ, 645, 1485
- Burgasser et al. (2008a) Burgasser, A. J., Liu, M. C., Ireland, M. J., Cruz, K. L., & Dupuy, T. J. 2008a, ApJ, 681, 579
- Burgasser et al. (2008b) Burgasser, A. J., Looper, D. L., Kirkpatrick, J. D., Cruz, K. L., & Swift, B. J. 2008b, ApJ, 674, 451
- Burgasser et al. (2012) Burgasser, A. J., Luk, C., Dhital, S., et al. 2012, ApJ, 757, 110
- Burgasser & McElwain (2006) Burgasser, A. J., & McElwain, M. W. 2006, AJ, 131, 1007
- Burgasser et al. (2004) Burgasser, A. J., McElwain, M. W., Kirkpatrick, J. D., et al. 2004, AJ, 127, 2856
- Burgasser et al. (2009) Burgasser, A. J., Witte, S., Helling, C., et al. 2009, ApJ, 697, 148
- Burgasser et al. (2000) Burgasser, A. J., et al. 2000, ApJ, 531, L57
- Burgasser et al. (2003) Burgasser, A. J., Kirkpatrick, J. D., Burrows, A., et al. 2003, ApJ, 592, 1186
- Burgasser et al. (2015) Burgasser, A. J., Gillon, M., Melis, C., et al. 2015, AJ, 149, 104
- Burningham et al. (2011) Burningham, B., Leggett, S. K., Homeier, D., et al. 2011, MNRAS, 414, 3590
- Burrows et al. (2001) Burrows, A., Hubbard, W. B., Lunine, J. I., & Liebert, J. 2001, Reviews of Modern Physics, 73, 719
- Chauvin et al. (2005) Chauvin, G., Lagrange, A.-M., Dumas, C., et al. 2005, A&A, 438, L25
- Cooper et al. (2003) Cooper, C. S., Sudarsky, D., Milsom, J. A., Lunine, J. I., & Burrows, A. 2003, ApJ, 586, 1320
- Covey et al. (2010) Covey, K. R., Lada, C. J., Román-Zúñiga, C., et al. 2010, ApJ, 722, 971
- Cruz et al. (2009) Cruz, K. L., Kirkpatrick, J. D., & Burgasser, A. J. 2009, AJ, 137, 3345
- Cruz et al. (2003) Cruz, K. L., Reid, I. N., Liebert, J., Kirkpatrick, J. D., & Lowrance, P. J. 2003, AJ, 126, 2421
- Cushing et al. (2003) Cushing, M. C., Rayner, J. T., Davis, S. P., & Vacca, W. D. 2003, ApJ, 582, 1066
- Cushing et al. (2004) Cushing, M. C., Vacca, W. D., & Rayner, J. T. 2004, PASP, 116, 362
- Cushing et al. (2008) Cushing, M. C., Marley, M. S., Saumon, D., et al. 2008, ApJ, 678, 1372
- Cutri et al. (2003) Cutri, R. M., Skrutskie, M. F., van Dyk, S., et al. 2003, VizieR Online Data Catalog, 2246, 0
- Deacon et al. (2005) Deacon, N. R., Hambly, N. C., & Cooke, J. A. 2005, A&A, 435, 363
- Deacon et al. (2014) Deacon, N. R., Liu, M. C., Magnier, E. A., et al. 2014, ApJ, 792, 119
- Dulick et al. (2003) Dulick, M., Bauschlicher, Jr., C. W., Burrows, A., et al. 2003, ApJ, 594, 651
- Dupuy & Liu (2012) Dupuy, T. J., & Liu, M. C. 2012, ApJS, 201, 19
- Dupuy et al. (2009) Dupuy, T. J., Liu, M. C., & Ireland, M. J. 2009, ApJ, 699, 168
- Faherty et al. (2011) Faherty, J. K., Burgasser, A. J., Bochanski, J. J., et al. 2011, AJ, 141, 71
- Faherty et al. (2009) Faherty, J. K., Burgasser, A. J., Cruz, K. L., et al. 2009, AJ, 137, 1
- Faherty et al. (2010) Faherty, J. K., Burgasser, A. J., West, A. A., et al. 2010, AJ, 139, 176
- Faherty et al. (2012) Faherty, J. K., Burgasser, A. J., Walter, F. M., et al. 2012, ApJ, 752, 56
- Filippazzo et al. (2015) Filippazzo, J. C., Rice, E. L., Faherty, J., et al. 2015, AJ, in press, arXiv:1508.01767
- Foreman-Mackey et al. (2014) Foreman-Mackey, D., Price-Whelan, A., Ryan, G., et al. 2014, triangle.py v0.1.1, doi:10.5281/zenodo.11020
- Frommhold et al. (2010) Frommhold, L., Abel, M., Wang, F., et al. 2010, Molecular Physics, 108, 2265
- Gaidos et al. (2014) Gaidos, E., Mann, A. W., Lépine, S., et al. 2014, MNRAS, 443, 2561
- Gizis & Harvin (2006) Gizis, J. E., & Harvin, J. 2006, AJ, 132, 2372
- Gomes et al. (2013) Gomes, J. I., Pinfield, D. J., Marocco, F., et al. 2013, MNRAS, 431, 2745
- Gray et al. (2003) Gray, R. O., Corbally, C. J., Garrison, R. F., McFadden, M. T., & Robinson, P. E. 2003, AJ, 126, 2048
- Hale (1995) Hale, A. 1995, PASP, 107, 22
- Hastings (1970) Hastings, W. K. 1970, Biometrika, 57, 97
- Hawley et al. (1996) Hawley, S. L., Gizis, J. E., & Reid, I. N. 1996, AJ, 112, 2799
- Helling et al. (2008a) Helling, C., Dehn, M., Woitke, P., & Hauschildt, P. H. 2008a, ApJ, 675, L105
- Helling et al. (2008b) Helling, C., Ackerman, A., Allard, F., et al. 2008b, MNRAS, 391, 1854
- Jao et al. (2008) Jao, W.-C., Henry, T. J., Beaulieu, T. D., & Subasavage, J. P. 2008, AJ, 136, 840
- Kaiser et al. (2002) Kaiser, N., Aussel, H., Burke, B. E., et al. 2002, in Society of Photo-Optical Instrumentation Engineers (SPIE) Conference Series, Vol. 4836, Society of Photo-Optical Instrumentation Engineers (SPIE) Conference Series, ed. J. A. Tyson & S. Wolff, 154–164
- Kirkpatrick (2005) Kirkpatrick, J. D. 2005, ARA&A, 43, 195
- Kirkpatrick et al. (2006) Kirkpatrick, J. D., Barman, T. S., Burgasser, A. J., et al. 2006, ApJ, 639, 1120
- Kirkpatrick et al. (2001) Kirkpatrick, J. D., Dahn, C. C., Monet, D. G., et al. 2001, AJ, 121, 3235
- Kirkpatrick et al. (2010) Kirkpatrick, J. D., Looper, D. L., Burgasser, A. J., et al. 2010, ApJS, 190, 100
- Kirkpatrick et al. (2011) Kirkpatrick, J. D., Cushing, M. C., Gelino, C. R., et al. 2011, ApJS, 197, 19
- Kirkpatrick et al. (2014) Kirkpatrick, J. D., Schneider, A., Fajardo-Acosta, S., et al. 2014, ApJ, 783, 122
- Latham et al. (1989) Latham, D. W., Stefanik, R. P., Mazeh, T., Mayor, M., & Burki, G. 1989, Nature, 339, 38
- Leggett (1992) Leggett, S. K. 1992, ApJS, 82, 351
- Leggett et al. (2001) Leggett, S. K., Allard, F., Geballe, T. R., Hauschildt, P. H., & Schweitzer, A. 2001, ApJ, 548, 908
- Leggett et al. (2010) Leggett, S. K., Saumon, D., Burningham, B., et al. 2010, ApJ, 720, 252
- Leggett et al. (2008) Leggett, S. K., Saumon, D., Albert, L., et al. 2008, ApJ, 682, 1256
- Linsky (1969) Linsky, J. L. 1969, ApJ, 156, 989
- Lucas et al. (2001) Lucas, P. W., Roche, P. F., Allard, F., & Hauschildt, P. H. 2001, MNRAS, 326, 695
- Maldonado et al. (2015) Maldonado, J., Affer, L., Micela, G., et al. 2015, A&A, 577, A132
- Mamajek (2007) Mamajek, E. E. 2007, in IAU Symposium, Vol. 237, IAU Symposium, ed. B. G. Elmegreen & J. Palous, 442–442
- Manjavacas et al. (2014) Manjavacas, E., Bonnefoy, M., Schlieder, J. E., et al. 2014, A&A, 564, A55
- Mann et al. (2013) Mann, A. W., Brewer, J. M., Gaidos, E., Lépine, S., & Hilton, E. J. 2013, AJ, 145, 52
- Mann et al. (2014) Mann, A. W., Deacon, N. R., Gaidos, E., et al. 2014, AJ, 147, 160
- Marocco et al. (2013) Marocco, F., Andrei, A. H., Smart, R. L., et al. 2013, AJ, 146, 161
- McLean et al. (2003) McLean, I. S., McGovern, M. R., Burgasser, A. J., et al. 2003, ApJ, 596, 561
- Metchev & Hillenbrand (2006) Metchev, S. A., & Hillenbrand, L. A. 2006, ApJ, 651, 1166
- Metropolis et al. (1953) Metropolis, N., Rosenbluth, A. W., Rosenbluth, M. N., Teller, A. H., & Teller, E. 1953, J. Chem. Phys., 21, 1087
- Mugrauer et al. (2006) Mugrauer, M., Seifahrt, A., Neuhäuser, R., & Mazeh, T. 2006, MNRAS, 373, L31
- Nakajima et al. (1995) Nakajima, T., Oppenheimer, B. R., Kulkarni, S. R., et al. 1995, Nature, 378, 463
- Newton et al. (2014) Newton, E. R., Charbonneau, D., Irwin, J., et al. 2014, AJ, 147, 20
- Rayner et al. (2009) Rayner, J. T., Cushing, M. C., & Vacca, W. D. 2009, ApJS, 185, 289
- Rayner et al. (2003) Rayner, J. T., Toomey, D. W., Onaka, P. M., et al. 2003, PASP, 115, 362
- Rebolo et al. (1995) Rebolo, R., Zapatero-Osorio, M. R., & Martin, E. L. 1995, Nature, 377, 129
- Reid et al. (2001) Reid, I. N., Burgasser, A. J., Cruz, K. L., Kirkpatrick, J. D., & Gizis, J. E. 2001, AJ, 121, 1710
- Rojas-Ayala et al. (2010) Rojas-Ayala, B., Covey, K. R., Muirhead, P. S., & Lloyd, J. P. 2010, ApJ, 720, L113
- Rojas-Ayala et al. (2012) —. 2012, ApJ, 748, 93
- Saumon et al. (2012) Saumon, D., Marley, M. S., Abel, M., Frommhold, L., & Freedman, R. S. 2012, ApJ, 750, 74
- Saumon et al. (2007) Saumon, D., Marley, M. S., Leggett, S. K., et al. 2007, ApJ, 656, 1136
- Schilbach et al. (2009) Schilbach, E., Röser, S., & Scholz, R.-D. 2009, A&A, 493, L27
- Schneider et al. (2011) Schneider, A., Melis, C., Song, I., & Zuckerman, B. 2011, ApJ, 743, 109
- Slesnick et al. (2004) Slesnick, C. L., Hillenbrand, L. A., & Carpenter, J. M. 2004, ApJ, 610, 1045
- Stephens et al. (2009) Stephens, D. C., Leggett, S. K., Cushing, M. C., et al. 2009, ApJ, 702, 154
- Terrien et al. (2012) Terrien, R. C., Mahadevan, S., Bender, C. F., et al. 2012, ApJ, 747, L38
- Tinney et al. (1998) Tinney, C. G., Delfosse, X., Forveille, T., & Allard, F. 1998, A&A, 338, 1066
- Torres et al. (2008) Torres, C. A. O., Quast, G. R., Melo, C. H. F., & Sterzik, M. F. 2008, Young Nearby Loose Associations, ed. Reipurth, B., 757
- Vacca et al. (2003) Vacca, W. D., Cushing, M. C., & Rayner, J. T. 2003, PASP, 115, 389
- van Biesbroeck (1961) van Biesbroeck, G. 1961, AJ, 66, 528
- van Leeuwen (2007) van Leeuwen, F. 2007, A&A, 474, 653
- Wilson et al. (2001) Wilson, J. C., Kirkpatrick, J. D., Gizis, J. E., et al. 2001, AJ, 122, 1989
- Witte et al. (2011) Witte, S., Helling, C., Barman, T., Heidrich, N., & Hauschildt, P. H. 2011, A&A, 529, A44
- Witte et al. (2009) Witte, S., Helling, C., & Hauschildt, P. H. 2009, A&A, 506, 1367
- Zuckerman & Song (2004) Zuckerman, B., & Song, I. 2004, ARA&A, 42, 685