Low-metallicity Young Clusters in the Outer Galaxy I. Sh 2-207
Abstract
To study star formation in low metallicity environments ( dex), we obtained deep near-infrared (NIR) images of Sh 2-207 (S207), which is an H II region in the outer Galaxy with spectroscopically determined metallicity of dex. We identified a young cluster in the western region of S207 with a limiting magnitude of mag (10 ) that corresponds to a mass detection limit of 0.1 and enables the comparison of star-forming properties under low metallicity with those of the solar neighborhood. From the fitting of the K-band luminosity function (KLF), the age and distance of S207 cluster are estimated at 2–3 Myr and 4 kpc, respectively. The estimated age is consistent with the suggestion of small extinctions of stars in the cluster ( mag) and the non-detection of molecular clouds. The reasonably good fit between observed KLF and model KLF suggests that the underlying initial mass function (IMF) of the cluster down to the detection limit is not significantly different from the typical IMFs in the solar metallicity. From the fraction of stars with NIR excesses, a low disk fraction (10 %) in the cluster with relatively young age is suggested, as we had previously proposed.
Subject headings:
infrared: stars — planetary systems: protoplanetary disks — stars: pre-main-sequence — open clusters and associations: general — stars: formation — Galaxy: abundances — ISM: H II regions1. INTRODUCTION
In a series of papers, we are going to present observations regarding the properties of young low-metallicity clusters in order to characterize the metallicity dependence of star-formation processes, such as the initial mass function (IMF) and star formation efficiency. The study of disk fraction for young clusters can also be used to characterize the metallicity dependence of planet formation processes (Yasui et al., 2009). However, the study of star formation under low metallicity is attracting attention because it is important to characterize the star formation in the early universe (Omukai & Palla, 2001, 2003). Moreover, it is critical for understanding the star formation process itself.
Because of the Galactic metallicity gradient, our Galaxy contains clusters with various metallicity ranging from in the outermost Galaxy to in the innermost Galaxy. Our first targets are low-metallicity clusters because 1) the large dynamic range of metallicity can be explored on the low-metallicity side better than the high-metallicity side (up to ); 2) low-metallicity are good alternative targets for studying star formation in nearby dwarf galaxies that have similar low-metallicity environments and much higher spatial resolution and sensitivity than the substellar regime, and 3) they can serve as laboratories for studying star formation in the epoch of Galaxy formation. Because the average metallicity in the universe is just below the solar metallicity (Matteucci, 2012), clusters with subsolar metallicity represent the most ubiquitous past star-formation.
For studying low-metallicity clusters, we focused on the outer Galaxy (Galactocentric radius: kpc). Clusters in the outer Galaxy are much closer (heliocentric distance: kpc) than LMC/SMC ( kpc), which is often observed; thus, they are well suited for precisely studying star formation in a low-metallicity environment. However, because the outer Galaxy is beyond the solar neighborhood ( kpc), we used near-infrared (NIR) deep images from the Subaru 8.2 m telescope as primary sensitivity data down to the substellar regime (0.1 ), which is similar to the mass detection limit of extensive observations of embedded clusters in the solar neighborhood with smaller (2–4 m class) telescopes. Large ground-based telescopes also offer high spatial resolution that allows resolving stars in distant clusters. Therefore, we can compare the properties of star formation in low-metallicity environments with those in the solar neighborhood on the same basis.
We selected sample clusters from the Sharpless catalog (Sharpless, 1959), which lists photographically H-selected bright H II regions mostly in the 1st and 2nd quadrants of our Galaxy. Although a number of lower mass clusters are known to exist in the far outer Galaxy ( kpc; e.g., Snell et al. 2002; Yun et al. 2007, 2009) or the extreme outer Galaxy ( kpc; e.g., Cloud 2: Kobayashi & Tokunaga 2000; Yasui et al. 2008a; WB89-789: Brand & Wouterloot 2007; Cloud 1: Izumi et al. 2014), we focus on the relatively prominent young clusters associated with Sharpless H II regions to maximize the astronomical properties of clusters with a significant number of cluster members.
As the first measurement of the metallicity and distance, we refer to Caplan et al. (2000) and Deharveng et al. (2000). Deharveng et al. (2000) carefully assessed the abundance gradient of our Galaxy with H II regions using new observations (Caplan et al., 2000) along with the data in the literature. A number of clusters were selected with known oxygen metallicity dex, assuming solar abundance of (Asplund et al., 2009). We selected four of eight candidate clusters: Sh 2-207 (S207), Sh 2-208, Sh 2-209, as primary targets.
In this study, we present the first results for S207, which is one of the lowest metallicity star-forming regions, (Deharveng et al., 2000; Rudolph et al., 2006), in the Galaxy located in the 2nd quadrant. This paper is structured as follows: § 2 discusses previous studies about S207 and star-forming activities in S207 using WISE (Wide-field Infrared Survey Explorer) and 2MASS (Two Micron All Sky Survey) data; § 3 describes Subaru MOIRCS (Multi-Object InfraRed Camera and Spectrograph) deep images and data reduction; § 4 describes the results for a star-forming cluster in S207; and in § 5, we discuss the implications for the basic cluster parameters, such as age, distance, IMF, and disk fraction.
2. Sh 2-207
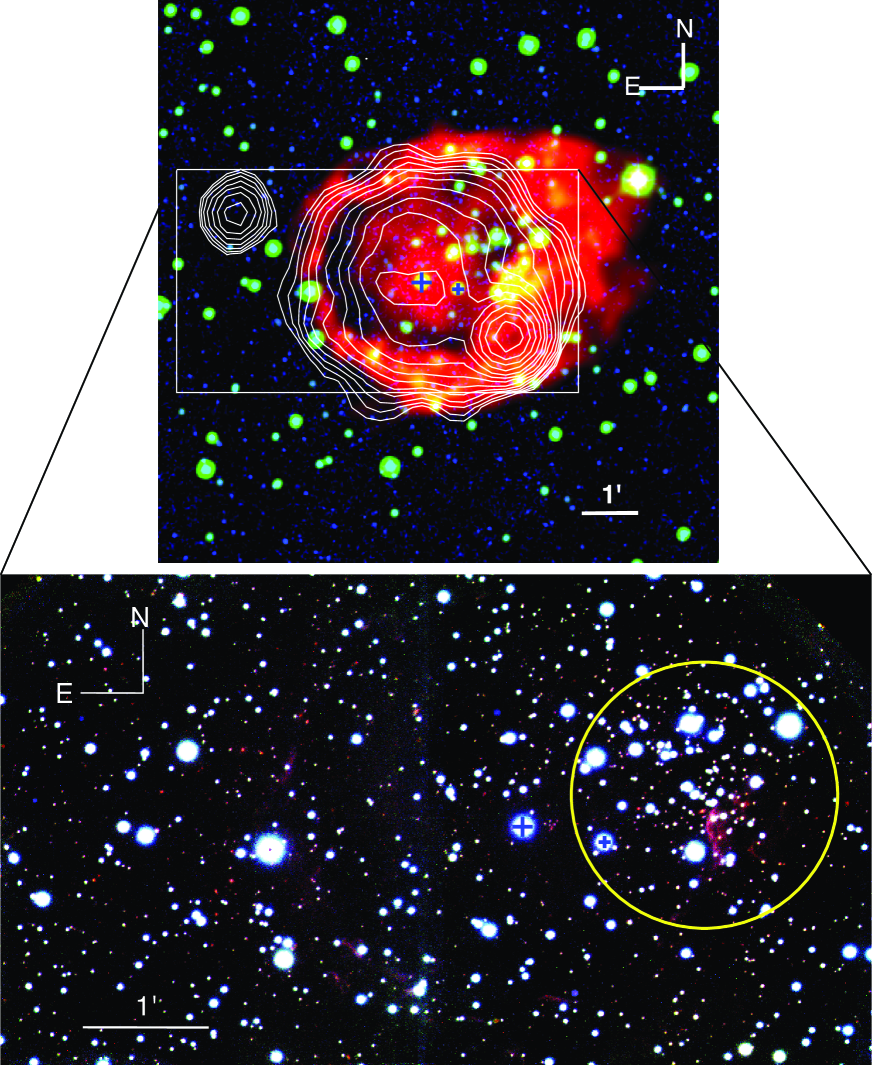
In this section, we discuss the properties of the target star-forming region S207. In Table 1, we summarize the properties from previous works, i.e., the coordinate, distance, oxygen abundance, and metallicity. We also show NIR and mid-infrared (MIR) pseudocolor images of S207 in Fig. 1 (top).
2.1. Basic properties from the literature
S207 is located at and on the Galactic plane with coordinates from SIMBAD111This research has made use of the SIMBAD database, operated at Centre de Données Astronomiques de Strasbourg, France. (Wenger et al., 2000). It has an extended H II region traced by H emission (Sharpless, 1959) and radio continuum emission (Condon et al., 1999). It also accompanies strong MIR emission that is detected with IRAS, IRAS 04159+5302 in IRAS Point Source Catalog (Beichman et al., 1988) and X0415+530 in IRAS Small Scale Structure (Helou & Walker, 1988). Despite the extensive search by Blitz et al. (1982), no CO was detected with the limit of the sensitivity of 0.5 K. Therefore, S207 has been mistaken as a planetary nebula (e.g., Condon et al. 1999).
The photometric distance, which is determined from spectroscopic and photometric observations, is estimated at 8 kpc for a probable dominantly-exciting O9.5IV type star222In Crampton et al. (1978), the spectral type is estimated to be O9V., GSC 03719-00546 (7.6 kpc by Moffat et al. 1979 and 8.6 kpc by Chini & Wink 1984; see the large blue plus in the top figure of Fig. 1). Assuming the Galactocentric distance of the Sun is kpc, the distance corresponds to kpc. However, note that the photometric distance is estimated at kpc ( kpc) using the second brightest star in optical bands, 2MASS 04194732+5309216 (A7 III-type star; Moffat et al. 1979) shown by the small blue plus in the top figure of Fig. 1. On the other hand, from observations of the H radial velocity using a Fabry–Perot spectrometer, the kinematic distance of S207 is estimated at about 4 kpc (4.3 kpc from km s-1 by Fich, Dahl, & Treffers 1990; 3.4 kpc from km s-1 by Pismis et al. 1991). In this case, the distance corresponds to kpc. Considering the structure of our Galaxy, S207 is located beyond the outer arm in the case of photometric distance, whereas it is located within the outer arm in the case of kinematic distance (e.g., Fig 1 of Reid et al. 2014). Later, we will propose that the distance to this cluster is more likely 4 kpc based on KLF analysis, which is similar to the above kinematic distance.
Based on the Fabry–Perot observations, Caplan et al. (2000) measured several optical emission line fluxes in 36 H II regions: [O II] 3726 and 3729, H, [O III] 5007, [He I] 5876, and H. Subsequently, Deharveng et al. (2000) derived the oxygen abundance (O/H), as well as the extinctions, electron densities and temperatures, and ionic abundances (O+/H+, O++/H+, and He+/H+). The estimated oxygen abundance of S207 is . Rudolph et al. (2006) reanalyzed the elemental abundances of 117 H II regions with updated physical parameters. Among them, the oxygen abundance of S207 is estimated using the data of Caplan et al. (2000) to be . This corresponds to the metallicity of dex assuming solar abundance of (Asplund et al., 2009). The spatial distribution of the Galactic abundance using the spectroscopy of Cepheids (Luck et al., 2006) also suggests low metallicity (0.5 dex) in the outer Galaxy with distance of 4 kpc in the second quadrant, where S207 is located.
2.2. Star-forming activities
Before discussing the results of our deep NIR imaging with Subaru, we discuss the star-forming activities in S207 with 2MASS (Skrutskie et al., 2006) NIR data and WISE (Wright et al., 2010) MIR data. The top figure of Fig. 1 shows a pseudocolor image of S207 with a wide field of view (1010′) with the center at ) in Galactic coordinates and in Equatorial coordinates. The figure is produced by combining the 2MASS Ks-band (2.16 m, blue), WISE band 1 (3.4 m; green), and WISE band 3 (12 m; red) images. We also show the 1.4 GHz radio continuum by the NRAO VLA Sky Survey (NVSS; Condon et al. 1998) with white contours, which are the same as the contours in Fig. 1 in Condon et al. (1999) for IRAS04159+5302. The 12 m emission is mainly from PAH emission, tracing photodissociation regions around H II regions, whereas the radio continuum traces the photoionized H II region. The distributions of the 12 m emission and radio continuum show that the H II region extends almost spherically with an approximately 2.5 arcmin radius. From the nearly perfect spherical shape centered on GSC 03719-00546, the O-type star should be the exciting source of the H II region. Although there is a strong radio continuum feature located 2′ toward the south-west of the star, this is likely to be a background object, such as a quasar, because no NIR counterpart is seen.
3. OBSERVATION AND DATA REDUCTION
3.1. Subaru MOIRCS imaging
Because our targets are distant clusters ( kpc) beyond the solar neighborhood, we used NIR deep images taken with the Subaru 8.2 m telescope as primary data with sensitivity down to the substellar regime and high spatial resolution to resolve stars in those distant clusters. NIR is currently best suited for stellar counting of distant young clusters compared to MIR.
Deep -band images were obtained for each band with the 8.2 m Subaru telescope equipped with a wide-field NIR camera and spectrograph, MOIRCS (Ichikawa et al., 2006; Suzuki et al., 2008). MOIRCS used two 2K “HAWAII-2” imaging arrays, which yield a field of view ( for each chip) with a pixel scale of pixel-1. The instrument uses the Mauna Kea Observatory (MKO) NIR photometric filters (Simons & Tokunaga, 2002; Tokunaga et al., 2002).
The observations were performed on 2006 November 8 UT, when it was highly humid (45–75 %). The seeing was 1′′. Because the detector output linearity is not guaranteed for counts over 20,000 ADU, we obtained short exposure images in addition to long-exposure images for more sensitive detection. The exposure times for the long-exposure images are 120, 20, and 30 s for the J, H, and bands, respectively, whereas the exposure time for short-exposure images is 13 s for all bands. The total integration times for the long-exposure images are 360, 480, and 960 s for the J, H, and bands, respectively, whereas the total integration time for the short-exposure images is 52 s for all bands. The center of the images of S207 is set at , , which covers the whole H II region described in Section 2.2 (see white box in the top figure of Fig. 1 for the MOIRCS field). For background subtraction, we also obtained images of the sky, which is 4 arcmin south of S207, to avoid the nebulosity of S207. We summarize the details of the observation in Table 2.
3.2. Data Reduction
All data in each band were reduced using IRAF333IRAF is distributed by the National Optical Astronomy Observatories, which are operated by the Association of Universities for Research in Astronomy, Inc., under cooperative agreement with the National Science Foundation. with standard procedures, including flat fielding, bad-pixel correction, median-sky subtraction, image shifts with dithering offsets, and image combination. We used sky flats, which are made from the archived MOIRCS data in SMOKA444SMOKA is the Subaru–Mitaka–Okayama–Kiso Archive System operated by the Astronomy Data Center, National Astronomical Observatory of Japan). We selected the data of the closest run. In addition to the above standard procedures, distortion correction was applied before image combination using the “MCSRED”555http://www.naoj.org/staff/ichi/MCSRED/mcsred_e.html reduction package for the MOIRCS imaging data. We constructed a pseudocolor image of S207 by combining the long-exposure images for (1.26 m, blue), (1.64 m, green), and (2.14 m, red) bands (Fig. 1, bottom).
3.3. Photometry
photometry was performed using the IRAF apphot package for stars in the western half-frame of the image for S207 (“S207 frame,” hereafter), where a star-forming cluster was found (Fig. 1, bottom; see Section 4.1). For comparison, we also performed photometry of stars in the western half-frame of the image of the sky (“sky frame,” hereafter). As photometric standards, isolated 2MASS stars in these fields were used after converting the 2MASS magnitudes to the MKO magnitudes using the color transformations in Leggett et al. (2006). Only 2MASS stars with good 2MASS photometric quality and with colors of , , and were used to avoid the color term effect. The zero point magnitudes both for the S207 frame and the sky frame were decided with relatively small dispersions: 0.08 mag for J and H bands, and 0.05 mag for Ks bands. The difference of zero point magnitudes between two frames are very small, 0.03 mag, 0.005 mag, and 0.02 mag for J, H, and K bands, respectively, confirming that the photometry for both frames is consistent. Because the cluster is very crowded, we used aperture diameter of for cluster members to avoid the contamination of adjacent stars. The flux uncertainty in the aperture was estimated for each frame from the standard deviation of the flux in about 6000 independent apertures in the blank area in the frame.
The limiting magnitudes (10/5) of long-exposure images for the S207 frame are mag, mag, and mag. For the sky frame, the limiting magnitude in H-band is slightly brighter compared to the S207 frame, mag, while those in the J and bands are the same as those for the S207 frame (see Table 3). For J and H bands for the S207 frame and the sky frame, the differences of limiting magnitudes between two frames are consistent with the differences of the exposure times. The limiting magnitudes in band are the same for both frames despite the different exposure times, 1.3 times longer for the S207 frame, probably owing to the nebulosity in the S207 frame, which is most prominent in band (see Fig. 1). Because there are no significant differences in the limiting magnitudes between the S207 frame and the sky frame, we can directly compare the number of stars in the S207 frame and those in the sky frame.
4. A newly identified young cluster in S207
4.1. Identification of a Young Cluster in S207
In the pseudocolor image of the observed field with MOIRCS (Fig. 1, bottom), a number of red sources and small nebulosities are found along the circular PDR-shell of S207. Among them, we found a star cluster in the western region of S207 from the enhancement of stellar density compared to that of the surrounding area. Because this enhancement is only seen in the western part of the image, we used stars only in the western half-frame in the following discussion of this section (S207 frame). First, we defined the cluster region. We set many circles with 100 pixel (12′′) radius around the cluster within 600 pix with 1 pixel step and counted the numbers of stars included in all circles (32 stars on average). Among them, we picked up a circle that contains the maximum numbers of stars (approximately 10) to define the center of the cluster with an accuracy of 5′′: , . Figure 2 shows the radial variation of the projected stellar density using the stars detected in MOIRCS photometry with 5. The horizontal solid line indicates the density of the entire sky frame. We defined the cluster region with a circle having a radius of 550 pix (), where the stellar density is more than that of the entire sky frame by 3 . In our previous work (Yasui et al., 2010), we defined the cluster region for S207 using a circle with radius of 200 pix (23′′), where the lower limit of the stellar density considering three times the Poisson error is higher than that of the sky frame by 3 using the radial variation with only stars detected in the -band long-exposure image. In this study, we extended the cluster region for better statistics.
The defined cluster region is shown as the yellow circle in the bottom figure of Fig. 1. The cluster is located near the region where the emission of WISE band 3 (12 m) is very strong (see Fig. 1, top); this combination is often seen in clusters (see Koenig et al. 2012). The cluster radius corresponds to 2.6 pc and 1.3 pc with distance of kpc and kpc, respectively. We defined detected point sources in the sky frame as “field objects” for a comparison sample of stars in the cluster region.
4.2. Color–magnitude Diagram
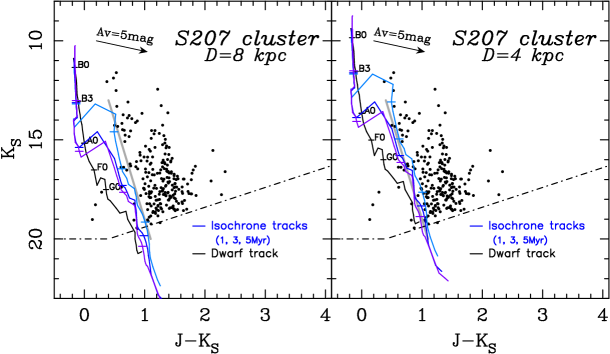
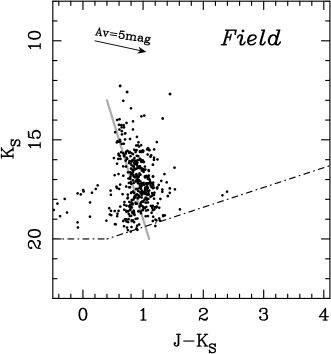
We constructed the versus color–magnitude diagrams of detected point sources in the S207 cluster (Fig. 3, left and middle) and the field objects (Fig. 3, right). The dwarf star tracks in the spectral type of O9 to M6 (corresponding mass of 0.1–20 ) by Bessell & Brett (1988) are shown as black lines, whereas isochrone models for the ages of 1, 3, and 5 Myr are shown as aqua, blue, and purple lines, respectively. The isochrone models are by Lejeune & Schaerer (2001) for the mass of , by Siess et al. (2000) for the mass of , and by D’Antona & Mazzitelli (1997, 1998) for the mass of . A distance of 8 kpc is assumed in the left figure of Fig. 3, whereas that of 4 kpc is assumed in the middle figure of Fig. 3. Arrows show the reddening vectors of mag.
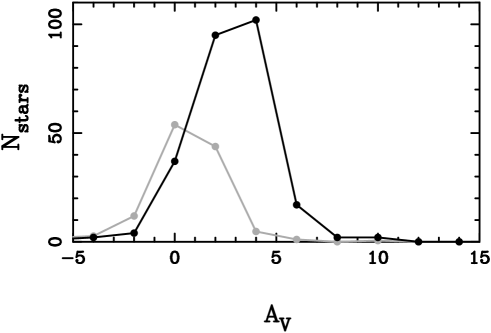
In the color–magnitude diagram, the extinction of each star was estimated from the distance between its location and the isochrone models along the reddening vector. For convenience, the isochrone model is approximated by the straight line shown as solid gray line. We then constructed the distributions of the extinction of stars in the cluster region (black) and the field objects (gray) in Fig. 4. The distribution of field objects is normalized to match with the total area of the cluster region. The resultant distribution of field objects shows a peak at mag, whereas that for the cluster region shows a peak at the slightly larger extinction of mag. Presumably, the difference in the distributions is mainly due to the cluster members, and the peak value (3 mag) is obtained from existing molecular clouds surrounding the S207 cluster or foreground extinction (see detail in Section 5.2). The average value of the cluster region is estimated at mag. Because the differences between the two distributions are not significant compared to those of the Cloud 2 (–15 mag in Yasui et al. 2009), it is difficult to distinguish cluster members from foreground/background contamination stars in the cluster region based only on the values of . Therefore, we discuss the properties of this cluster in the following section by comparing the number count of stars in the cluster region and the normalized number counts of field objects.
We placed the short horizontal lines on the isochrone models shown with the same colors as the isochrone tracks, which show the positions of 0.1, 1, 3, and 10 . Assuming the average of 3 mag, the K-band limiting magnitude of 19.0 mag (10 ) for the age of 1–3 Myr corresponds to the mass of 0.2 and 0.1 in the case of photometric distance of kpc and kinematic distance of kpc, respectively. For the age of 5 Myr, the magnitude corresponds to the mass of 0.5 and 0.09 with distance of 8 kpc and 4 kpc, respectively. In any case, the mass detection limit is sufficiently low, down to the substellar mass, which enables us to estimate the age using KLF (Section 4.4, 5.1) and derive the disk fraction with the same criteria as in the solar neighborhood (Section 5.3). Because the most likely age and distance of S207 are estimated at 2–3 Myr and 4 kpc, respectively, in Section 5.1, the mass detection limit is then 0.1 .
Note that there are some stars with of 0.5–0.5 mag in magnitudes of 18 mag, while such stars are not included in the S207 frame. Although the scatter in colors is often seen for fainter stars (e.g., Lucas et al. 2008), it appears to be somewhat large considering the detection limit. Because the magnitude errors for such stars are found to be relatively large, 0.1 mag, there may be some systematic errors due to possible unstable sky level at the observation night, when it is highly humid, despite the the relatively high quality of the photometry (Section 3.3). However, because the effects of such stars are very small, the ratio of only 4 % among all field objects, we use all field objects for a comparison sample of the cluster region except for estimation of the disk fraction, which is very sensitive to photometric errors (see Sections 4.3 and 5.3).
4.3. Color–color Diagram
In Fig. 5, we show the versus color–color diagram for stars in the S207 cluster region (left) and for the field stars (right). Only stars with detection of more than 20 for all bands are plotted. Although the threshold is often set to be 10 or 5 detection, we set the high threshold considering the somewhat high photometric errors in fainter magnitudes as noted in Section 4.2. Even with the detection limit, the K-band limiting magnitude of 20 detection ( mag) for the age of 1–5 Myr corresponds to the mass of 0.8 and 0.3 in the case of photometric distance of kpc and kinematic distance of kpc, respectively. The dwarf star tracks in the spectral type of late B to M6 in the MKO system by Yasui et al. (2008a) are the solid curves. The classical T Tauri star (CTTS) loci, originally derived by Meyer et al. (1997) in the CIT system, are shown as gray lines in the MKO system (Yasui et al., 2008a). Arrows show the reddening vectors of mag. Stars with circumstellar dust disks are known to show a large color excess (e.g., Lada & Adams 1992).
The intrinsic colors of each star were estimated by dereddening along the reddening vector to the young star locus in the color–color diagram (see Fig. 5). For convenience, the young star locus was approximated by the extension of the CTTS locus, and only stars that are above the CTTS locus were used. We constructed intrinsic color distributions for stars in the cluster region (gray solid line and gray-filled circles) and for field objects in the sky frame (gray dot-dashed line and gray-filled squares) in Fig. 6. The distribution of field objects is normalized to match with the total area of the cluster region. The distribution for the S207 cluster, shown by the black thick line with black-filled circles, is made by subtracting the counts of normalized distribution for field objects from those for the cluster region. Error bars are the uncertainties from Poisson statistics. The average value for stars in the cluster region is estimated at 0.29 mag from 99 stars, whereas that for field objects is estimated at 0.23 mag from 113 stars (29.38 stars after normalization). The average value for the S207 cluster is estimated at 0.32 mag . The difference in the average between the stars in the S207 cluster and the field objects in the sky frame (0.09 mag) can be attributed to thermal emissions from the circumstellar disks of the cluster members. Assuming that disk emissions appear in the but not in the band, the disk color excess of the S207 cluster members in the K band, , is equal to 0.09 mag.
4.4. K-band Luminosity Function (KLF)
We constructed the K-band luminosity function (KLF) for the S207 cluster. Because it is difficult to identify cluster members from values (cf. Yasui et al. 2009), as discussed in Section 4.2, we construct KLF by subtracting the normalized star counts of field objects from those for the stars in the cluster region. In Fig. 7, we show three KLFs: (1) KLF for stars in the cluster region shown by gray solid lines and gray-filled circles (cluster region KLF); (2) KLF for field objects with normalized star counts to match with the total area of the cluster regions, shown by gray dot-dashed lines and gray filled-squares (field KLF); and (3) KLF for background-subtracted star counts (S207 KLF) shown by black thick lines and black-filled circles. The number counts of KLFs generally increase in the fainter magnitude bins. However, the number counts of the cluster region KLF decrease in the faintest bin, and the S207 KLF has peaks at mag bin, which generally corresponds to the peak of IMF.
It should be noted that the detection completeness of stars with 10 detection is less than one, whereas that of the brighter stars is almost one (see Yasui et al. 2008a and Minowa et al. 2005). Considering the 10 detection magnitude of mag for both the S207 frame and the sky frame, completeness should be 1 in the magnitude bins of –18 mag. However, in the mag bin, which includes stars with –19.5 mag, not all stars may be perfectly detected owing to the small detection completeness of stars with –19.5 mag corresponding to the 5 –10 detection. The number counts in the bin of the cluster region KLF and the field KLF are 59 and 41.7, respectively. The number of stars with –19.5 mag in the cluster region KLF is counted as 21, while that in the field KLF is 20.0. Because the completeness of stars with 5 detection is estimated at 0.7 using Yasui et al. (2008a) (also see Minowa et al. 2005), the actual numbers of stars with –19.5 mag are 30 and 28.6 at most for the cluster region KLF and the field KLF, respectively. By combining this with the number of stars with –19 mag (38 for the cluster regiond KLF and 21.7 for the field KLF), the upper limit of the number count in mag bin for the cluster region KLF becomes 68 , shown as gray open circles and gray dashed lines, that for the field KLF becomes 50.3 , shown as gray open squares and gray dashed lines. Therefore, the resultant upper and lower limits of the star count in the S207 KLF are estimated at 26.3 , shown as the black open circles and dashed lines, and 8.7 , shown as dotted lines, respectively. As a result, the S207 KLF would have a peak at mag bin.
5. Discussion
5.1. Age and distance of S207
KLFs of different ages are known to have different peak magnitudes and slopes, fainter peak magnitudes and less steeper slopes with increasing age (Muench et al., 2000). By comparing observed and model KLFs, the age of the young clusters can be roughly estimated with an uncertainty of 1 Myr (Yasui et al. 2006, 2008a). We constructed model KLFs in the same way as our previous work (see Section 4 in Yasui et al. 2006) with the assumed distance of the cluster that underlies typical IMFs and mass–luminosity relations. We used the Trapezium IMF (Muench et al., 2002), which is considered the most reliable IMF for young clusters (e.g., Lada & Lada 2003), as discussed in Yasui et al. (2008a). Because the maximum mass of the stars in S207 seems much larger compared to that of the clusters in our previous work (3 ; Yasui et al. 2006, 2008a), we used additional isochrone models by Lejeune & Schaerer (2001) for the mass of and by Siess et al. (2000) for the mass of , in addition to the model for the lower mass () by D’Antona & Mazzitelli (1997, 1998), which is used in Yasui et al. (2006, 2008a). We constructed model KLFs with ages 0.5, 1, 2, 3, and 5 Myr assuming kinematic distance of kpc (Fig. 8, left) and photometric distance of kpc (Fig. 8, right). We also considered the and estimated in Sections 4.2 and 4.3.
We performed a chi-squared test between the S207 KLF (black line in Fig. 8) and model KLFs for each age and distance with magnitudes of –18.5 mag. The results of the best fit for fixed ages are shown as colored lines in Fig. 8. The obtained chi-square values are not very important because the constructed model KLFs are extremely simplified (e.g., age spread is not considered). However, the values can be used to check whether the assumed ages are likely or not. In the case of kpc (Fig. 8, left), the most likely age is approximately 0.5 Myr or 1 Myr with chi-square values of 30 (26.9 for the age of 0.5 Myr and 31.6 for the age of 1 Myr; 35.8, 33.4, and 37.3 for 2 Myr, 3 Myr, and 5 Myr, respectively). However, the ages are implausible based on the very high chi-square values, which are much less than the 5 % and 1 % confidence level in the degree of 5 (11.07 and 15.09, respectively). In the case of kpc (Fig. 8, right), the ages of 2 Myr, 3 Myr, or 5 Myr seem most reliable based on the chi-square value of 13 (13.2, 13.1, and 13.2 for the age of 2 Myr, 3 Myr, and 5 Myr, respectively; 51.1 and 51.7 for 0.5 Myr and 1 Myr, respectively), which is between 5 % and 1 % confidence limits. However, in the case of 5 Myr, the model KLF does not match the observed KLF in the faintest mag bin at all666In case that the faintest mag bin is also included in the KLF fitting for the distance of 4 kpc, obtained chi-square values for the age of 2 Myr and 3 Myr (16.4 and 13.2, respectively) are close to 5 % and 1 % confidence limit in the degree of 6 (14.44 and 16.81, respectively), while that for the age of 5 Myr (34.9) is much more than the limits.. Therefore, the age of 2–3 Myr in the case of distance kpc seems most likely for the S207 cluster.
The KLF fitting results suggest that the distance of the S207 cluster is consistent with the kinematic distance and that S207 is located in the outer arm, as described in Section 2.1. Because circular Galactic rotation is suggested for the outer arm (e.g., Hachisuka et al., 2015), the kinematic distance is likely to be correct, whereas that in the Perseus arm is incorrect because of the noncircular motion (Xu et al., 2006). The photometric distance may have large uncertainty because it is estimated from an O-type star, for which the luminosity class is difficult to determine. In addition, the estimate is only from one star. Actually, the photometric distance from an A-type star is much different ( kpc), as discussed in Section 2.1. For star-forming H II regions, the re-examined distances are often found to differ from previously estimated distances by more than a factor of 2 (e.g., Russeil et al., 2007).
5.2. Implication for IMF
In Section 4.3, the extinction of stars in the S207 cluster is estimated as small as mag, which should include foreground extinction. Because mag is expected in the direction of S207 from the three-dimensional extinction map of the Galactic plane (Sale et al., 2014), the extinction from the intracluster should be very small. Moreover, the non-detection of CO by Blitz et al. (1982) with sensitivity limit of 0.5 K suggests that the 3 upper limit of the H2 column density777The telescopes at Bell Telescope Laboratories (BTL) and Millimeter Wave Observatory (MWO) were used for the S207 observation in Blitz et al. (1982). The column density is estimated considering a main beam efficiency of 89 % for BTL (Bally et al., 1987) and 80 % for MWO (Magnani et al., 1985), and the velocity resolution of 0.65 km s-1 in Blitz et al. (1982). is 3–41020 cm-2, which corresponds to mag. The estimated extinction values suggest that the molecular cloud around the S207 cluster almost dissipated. Considering that star-forming clusters experience embedded phase for only 2–3 Myr (Lada & Lada, 2003), the small extinction of the S207 cluster suggests that the age of the cluster is 2–3 Myr, which is consistent with the age estimated from the KLF fitting.
In the KLF fitting (Section 5.1), typical IMF is assumed for estimating the age of the S207 cluster. In contrast, if we take the above rough age estimate as an independent information, the fitting results with model KLFs suggest that the IMF of the S207 cluster, which is located in very low-metallicity environments, can be approximated by the typical IMFs of the solar neighborhood (0 dex) for mass range 0.1 . Because the KLF shape is very sensitive to that of IMF (Yasui et al., 2006, 2008b), the reasonably good fit of the observed KLF down to the peak at mag ensures the universality of IMF.
5.3. Disk fraction
The ratio of stars with protoplanetary disks in young clusters, the disk fraction, is one of the most fundamental parameters in planet formation (Haisch et al., 2001; Lada & Lada, 2003). On the JHK color–color diagram, stars without circumstellar disks are seen as main-sequence stars reddened with extinction, whereas stars with circumstellar disks are seen in “the disk-excess region,” which is the orange highlighted region to the right of the dot-dashed line in Fig. 5 because of thermal emissions from the hot dust disk with temperature of 1500 K. The dot-dashed line intersecting the dwarf star curve at maximum values (M6 point on the curve) and is parallel to the reddening vector is the border between stars with and without circumstellar disks (see details in Yasui et al. 2009). The disk fraction for stars with more than 20 detection for all bands in the cluster region is estimated at 2 % from Fig. 5 (left). However, because some stars in the cluster region are indeed background or foreground stars, we have to subtract such contaminations (e.g., Haisch et al. 2000). The disk fraction for field objects in the sky frame is estimated at 0.4 % from Fig. 5 (right). As a result, the final disk fraction of the S207 cluster is estimated at 42 % with the number of field objects normalized to match with the total area of the cluster regions. In our previous work (Yasui et al., 2010), we estimated the disk fraction for the cluster at 55 %: 54 % for stars in the cluster region, which is a small region with radius pix, and 5 % for stars in the control field, which is the area located by more than 500 pix from the center of the cluster region. In this study, we defined the larger area ( pix; see Section 4.1) as the cluster region to estimate disk fraction with higher S/N. In addition, to avoid possible cluster members, we defined the control field in the sky frame, which is well apart from the nebulosity of S207. In any case, the discrepancy between the two results was within the uncertainties range.
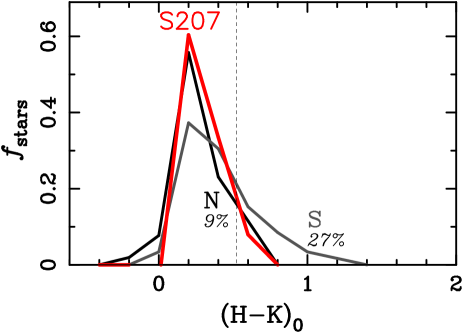
In Figure 9, we show the fraction of stars () per each intrinsic color bin () for the S207 cluster (red), which is from black line in Fig. 6), and those for other young clusters in the low-metallicity environments, Cloud 2-N (black) and Cloud 2-S (gray) with estimated disk fraction of 9 % and 27 %, respectively (Yasui et al., 2009). The dashed line shows the borderline for estimating the disk fraction in the MKO system888Although mag was shown for the borderline in the MKO system in Yasui et al. (2009), we found that the correct borderline is mag.. The distribution is known to be bluer and sharper with lower disk fraction for nearby young clusters (see the bottom panel of Fig. 7 in Yasui et al. 2009), which is also the case for the clusters in the low-metallicity environments (Yasui et al., 2009). The distribution of the S207 cluster appears to be sharp with dispersion of mag, which resembles the distribution of the Cloud 2-N cluster. This is consistent with that disk fraction of the S207 is low, 10 %.
NIR disk fractions are known to have high values (60 %) for very young clusters but decrease with increasing age. In the timescale of 10 Myr, the fraction reaches 5–10 % (Lada 1999; Hillenbrand 2005; Yasui et al. 2010; see the red line in the left figure of Fig 5 in Yasui et al. 2014). Although NIR disk fractions are generally slightly lower than MIR disk fractions, which are based on ground -band observations and space MIR observations, the characteristics are totally identical. As suggested in Yasui et al. (2010), the derived disk fraction for the S207 cluster (42 %) is lower than that for clusters in the solar neighborhood with identical age to the S207 cluster (30 % for 2–3 Myr; Yasui et al. 2010). The lower disk fraction in low-metallicity environments suggests that the disk lifetime in low-metallicity environments is quite short, as discussed in Yasui et al. (2009).
| Name | Sh 2-207 |
|---|---|
| Galactic longitude (deg) | 151.1905 (1) |
| Galactic latitude (deg) | 2.1256 (1) |
| R.A. (J2000.0) | 04 19 49.6 (1) |
| Dec. (J2000.0) | +53 09 29 (1) |
| Photometric heliocentric distancea (kpc) | 7.6 (2), 8.6 (3) |
| Adopted photometric heliocentric distance (kpc) | 8 |
| Photometric Galactocentric distanceb (kpc) | 15.5 |
| Kinematic heliocentric distancec (kpc) | 4.3 (4), 3.4 (5) |
| Adopted kinematic heliocentric distance (kpc) | 4 |
| Kinematic Galactocentric distanced (kpc) | 12 |
| Oxygen abundance | 7.96 (6, 7) |
| Metallicity [O/H] (dex)e | 0.8 |
Notes.
aReferences are shown in the parenthesis.
bAssumed the solar Galactocentric distance kpc. References are shown in the parenthesis.
cReferences are shown in the parenthesis.
dAssumed the solar Galactocentric distance kpc. References are shown in the parenthesis.
eAssumed the solar abundance of
(Asplund et al., 2009).
References.
(1) SIMBAD (Wenger et al., 2000), (2) Moffat et al. (1979), (3)
Chini & Wink (1984), (4) Fich et al. (1990), (5) Pismis et al. (1991),
(6) Caplan et al. (2000), and (7) Rudolph et al. (2006).
| Modes | Band | Coadd | Seeing | |||
|---|---|---|---|---|---|---|
| (1) | (2) | (3) | (4) | |||
| -long | 360 (360) | 120 | 1 | 3 (3) | ||
| -long | 480 (360) | 20 | 6 | 4 (3) | ||
| -long | 960 (720) | 30 | 4 | 8 (6) | ||
| -short | 52 (39) | 13 | 1 | 4 (3) | ||
| -short | 52 (39) | 13 | 1 | 4 (3) | ||
| -short | 52 (39) | 13 | 1 | 4 (3) |
Notes.
Col. (1): Total exposure time [s]. The values for the sky frames are
shown in parentheses.
Col. (2): Single-exposure time [s].
Col. (3): Number of coadd.
Col. (4): Total number of frames. The values for the sky frames are
shown in parentheses.
| Frame | (10/5) | (10/5) | (10/5) |
|---|---|---|---|
| Cluster | 19.6/20.4 | 19.1/20.0 | 19.0/20.0 |
| Sky | 19.6/20.4 | 19.0/19.8 | 19.0/20.0 |
References
- Anderson et al. (2014) Anderson, L. D., Bania, T. M., Balser, D. S., et al. 2014, ApJS, 212, 1
- Asplund et al. (2009) Asplund, M., Grevesse, N., Sauval, A. J., & Scott, P. 2009, ARA&A, 47, 481
- Bally et al. (1987) Bally, J., Stark, A. A., Wilson, R. W., & Henkel, C. 1987, ApJS, 65, 13
- Beichman et al. (1988) Beichman, C. A., Neugebauer, G., Habing, H. J., Clegg, P. E., & Chester, T. J. 1988, Infrared astronomical satellite (IRAS) catalogs and atlases. Volume 1: Explanatory supplement, 1,
- Bessell & Brett (1988) Bessell, M. S., & Brett, J. M. 1988, PASP, 100, 1134
- Blitz et al. (1982) Blitz, L., Fich, M., & Stark, A. A. 1982, ApJS, 49, 183
- Brand & Wouterloot (2007) Brand, J., & Wouterloot, J. G. A. 2007, A&A, 464, 909
- Caplan et al. (2000) Caplan, J., Deharveng, L., Peña, M., Costero, R., & Blondel, C. 2000, MNRAS, 311, 317
- Carpenter et al. (2006) Carpenter, J. M., Mamajek, E. E., Hillenbrand, L. A., & Meyer, M. R. 2006, ApJ, 651, L49
- Chini & Wink (1984) Chini, R., & Wink, J. E. 1984, A&A, 139, L5
- Condon et al. (1998) Condon, J. J., Cotton, W. D., Greisen, E. W., et al. 1998, AJ, 115, 1693
- Condon et al. (1999) Condon, J. J., Kaplan, D. L., & Terzian, Y. 1999, ApJS, 123, 219
- Crampton et al. (1978) Crampton, D., Georgelin, Y. M., & Georgelin, Y. P. 1978, A&A, 66, 1
- D’Antona & Mazzitelli (1997) D’Antona, F., & Mazzitelli, I. 1997, Memorie della Societa Astronomica Italiana, 68, 807
- D’Antona & Mazzitelli (1998) D’Antona, F., & Mazzitelli, I. 1998, ASP Conf. Ser. 134: Brown Dwarfs and Extrasolar Planets, 134, 442
- Deharveng et al. (2000) Deharveng, L., Peña, M., Caplan, J., & Costero, R. 2000, MNRAS, 311, 329
- Fich et al. (1990) Fich, M., Dahl, G. P., & Treffers, R. R. 1990, AJ, 99, 622
- Hachisuka et al. (2015) Hachisuka, K., Choi, Y. K., Reid, M. J., et al. 2015, ApJ, 800, 2
- Haisch et al. (2000) Haisch, K. E., Jr., Lada, E. A., & Lada, C. J. 2000, AJ, 120, 1396
- Haisch et al. (2001) Haisch, K. E., Jr., Lada, E. A., & Lada, C. J. 2001a, ApJ, 553, L153
- Helou & Walker (1988) Helou, G., & Walker, D. W. 1988, NASA RP-1190, Vol. 7 (1988), 0
- Hernández et al. (2005) Hernández, J., Calvet, N., Hartmann, L., Briceño, C., Sicilia-Aguilar, A., & Berlind, P. 2005, AJ, 129, 856
- Hillenbrand (2005) Hillenbrand, L. A. 2005, ArXiv Astrophysics e-prints, arXiv:astro-ph/0511083
- Ichikawa et al. (2006) Ichikawa, T., et al. 2006, Proc. SPIE, 6269
- Izumi et al. (2014) Izumi, N., Kobayashi, N., Yasui, C., et al. 2014, ApJ, 795, 66
- Kennedy & Kenyon (2009) Kennedy, G. M., & Kenyon, S. J. 2009, ApJ, 695, 1210
- Kobayashi & Tokunaga (2000) Kobayashi, N., & Tokunaga, A. T. 2000, ApJ, 532, 423
- Koenig et al. (2012) Koenig, X. P., Leisawitz, D. T., Benford, D. J., et al. 2012, ApJ, 744, 130
- Lada (1999) Lada, E. A. 1999, in The Origin of Stars and Planetary Systems, ed. C. J. Lada & N. D. Kylafis (Dordrecht: Kluwer), 441
- Lada & Adams (1992) Lada, C. J., & Adams, F. C. 1992, ApJ, 393, 278
- Lada & Lada (2003) Lada, C. J., & Lada, E. A. 2003, ARA&A, 41, 57
- Leggett et al. (2006) Leggett, S. K., et al. 2006, MNRAS, 373, 781
- Lejeune & Schaerer (2001) Lejeune, T., & Schaerer, D. 2001, A&A, 366, 538
- Lucas et al. (2008) Lucas, P. W., Hoare, M. G., Longmore, A., et al. 2008, MNRAS, 391, 136
- Luck et al. (2006) Luck, R. E., Kovtyukh, V. V., & Andrievsky, S. M. 2006, AJ, 132, 902
- Magnani et al. (1985) Magnani, L., Blitz, L., & Mundy, L. 1985, ApJ, 295, 402
- Matteucci (2012) Matteucci, F. 2012, Chemical Evolution of Galaxies: , Astronomy and Astrophysics Library. ISBN 978-3-642-22490-4. Springer-Verlag Berlin Heidelberg, 2012,
- Meyer et al. (1997) Meyer, M. R., Calvet, N., & Hillenbrand, L. A. 1997, AJ, 114, 288
- Minowa et al. (2005) Minowa, Y., Kobayashi, N., Yoshii, Y., et al. 2005, ApJ, 629, 29
- Moffat et al. (1979) Moffat, A. F. J., Jackson, P. D., & Fitzgerald, M. P. 1979, A&AS, 38, 197
- Muench et al. (2000) Muench, A. A., Lada, E. A., & Lada, C. J. 2000, ApJ, 533, 358
- Muench et al. (2002) Muench, A. A., Lada, E. A., Lada, C. J., & Alves, J. 2002, ApJ, 573, 366
- Omukai & Palla (2001) Omukai, K., & Palla, F. 2001, ApJ, 561, L55
- Omukai & Palla (2003) Omukai, K., & Palla, F. 2003, ApJ, 589, 677
- Pismis et al. (1991) Pismis, P., Hasse, I., & Quintero, A. 1991, PASP, 103, 843
- Reid et al. (2014) Reid, M. J., Menten, K. M., Brunthaler, A., et al. 2014, ApJ, 783, 130
- Rudolph et al. (2006) Rudolph, A. L., Fich, M., Bell, G. R., Norsen, T., Simpson, J. P., Haas, M. R., & Erickson, E. F. 2006, ApJS, 162, 346
- Russeil et al. (2007) Russeil, D., Adami, C., & Georgelin, Y. M. 2007, A&A, 470, 161
- Sale et al. (2014) Sale, S. E., Drew, J. E., Barentsen, G., et al. 2014, MNRAS, 443, 2907
- Sharpless (1959) Sharpless, S. 1959, ApJS, 4, 257
- Siess et al. (2000) Siess, L., Dufour, E., & Forestini, M. 2000, A&A, 358, 593
- Simons & Tokunaga (2002) Simons, D. A., & Tokunaga, A. 2002, PASP, 114, 169
- Skrutskie et al. (2006) Skrutskie, M. F., Cutri, R. M., Stiening, R., et al. 2006, AJ, 131, 1163
- Snell et al. (2002) Snell, R. L., Carpenter, J. M., & Heyer, M. H. 2002, ApJ, 578, 229
- Suzuki et al. (2008) Suzuki, R., et al. 2008, PASJ, 60, 1347
- Tokunaga et al. (2002) Tokunaga, A. T., Simons, D. A., & Vacca, W. D. 2002, PASP, 114, 180
- Wenger et al. (2000) Wenger, M., Ochsenbein, F., Egret, D., et al. 2000, A&AS, 143, 9
- Williams & Cieza (2011) Williams, J. P., & Cieza, L. A. 2011, ARA&A, 49, 67
- Wright et al. (2010) Wright, E. L., Eisenhardt, P. R. M., Mainzer, A. K., et al. 2010, AJ, 140, 1868
- Xu et al. (2006) Xu, Y., Reid, M. J., Zheng, X. W., & Menten, K. M. 2006, Science, 311, 54
- Yasui et al. (2006) Yasui, C., Kobayashi, N., Tokunaga, A. T., Terada, H., & Saito, M. 2006, ApJ, 649, 753
- Yasui et al. (2008a) Yasui, C., Kobayashi, N., Tokunaga, A. T., Terada, H., & Saito, M. 2008, ApJ, 674, 443
- Yasui et al. (2008b) Yasui, C., Kobayashi, N., Tokunaga, A. T., Saito, M., & Tokoku, C. 2008, Formation and Evolution of Galaxy Disks, 396, 225
- Yasui et al. (2009) Yasui, C., Kobayashi, N., Tokunaga, A. T., Saito, M., & Tokoku, C. 2009, ApJ, 705, 54
- Yasui et al. (2010) Yasui, C., Kobayashi, N., Tokunaga, A. T., Saito, M., & Tokoku, C. 2010, ApJ, 723, L113
- Yasui et al. (2014) Yasui, C., Kobayashi, N., Tokunaga, A. T., & Saito, M. 2014, MNRAS, 442, 2543
- Yun et al. (2007) Yun, J. L., López-Sepulcre, A., & Torrelles, J. M. 2007, A&A, 471, 573
- Yun et al. (2009) Yun, J. L., Elia, D., Palmeirim, P. M., Gomes, J. I., & Martins, A. M. 2009, A&A, 500, 833