Lithium in Open Cluster Red Giants Hosting Substellar Companions
Abstract
We have measured stellar parameters, [Fe/H], lithium abundances, rotation, and 12C/13C in a small sample of red giants in three open clusters that are each home to a red giant star that hosts a substellar companion (NGC2423 3, NGC4349 127, and BD+12 1917 in M67). Our goal is to explore whether the presence of substellar companions influences the Li content. Both 12C/13C and stellar rotation are measured as additional tracers of stellar mixing. One of the companion hosts, NGC2423 3, is found to be Li-rich with (Li)1.56 dex, and this abundance is significantly higher than the (Li) of the two comparison stars in NGC 2423. All three substellar companion hosts have the highest (Li) and 12C/13C when compared to the control red giants in their respective clusters; however, except for NGC2423 3, at least one control star has similarly high abundances within the uncertainties. Higher (Li) could suggest that the formation or presence of planets plays a role in the degree of internal mixing on or before the red giant branch. However, a multitude of factors affect (Li) during the red giant phase, and when the abundances of our sample are compared to abundances of red giants in other open clusters available in the literature, we find that they all fall well within a much larger distribution of (Li) and 12C/13C. Thus, even the high Li in NGC2423 3 cannot be concretely tied to the presence of the substellar companion.
Subject headings:
open clusters and associations: individual (NGC 2423, NGC 4349, M67) - stars: abundances - stars: chemically peculiar - stars: late-typeI. Introduction
The abundance of lithium, (Li), in stellar photospheres is a useful diagnostic of a variety of phenomena related to the internal mixing near the stellar surface. It has been used as a crude clock for some low mass main sequence (MS) stars (see Sestito & Randich 2005 for uses and limitations) and to study non-standard, i.e., non-convective, mixing processes in red giant (RG) stars (Gratton et al. 2000, Denissenkov & VandenBerg 2003, Guandalini et al. 2009). Moreover, studies of MS stars suggest that the planet formation process may alter the stellar (Li) early in the star’s life by causing enhanced Li-depletion (e.g., Israelian et al. 2009, Gonzalez 2014, and references therein), which is supported theoretically (e.g., Baraffe & Chabrier, 2010). However, whether (Li) of MS planet hosts truly differs from apparently planet-free stars after controlling for stellar ages, masses, etc. is still hotly debated (e.g, Ghezzi et al. 2010b, Baumann et al. 2010, Ramírez et al. 2012).
Because the number of known RGs that host planets or other substellar companions (SSCs) lags considerably behind the number of MS hosts, there is not much known about whether Li in planet hosts is substantially different from non-planet hosts. Ten RG planet hosts were included in the Carlberg et al. (2012) study of Li and rotation in RGs, and the planet hosts did not show any unusual (Li). Two SSC hosts were included in a contemporaneous study of (Li) in open clusters, and these appear to have enhanced (Li) (Delgado Mena et al., 2015). Most recent studies comparing the abundance patterns of RG planet hosts and non-hosts have not included Li in their analyses (e.g., Maldonado et al. 2013 and Jofré et al. 2015).
Complicating any comparisons between SSC hosts and control populations are the difficulty in estimating accurate masses for RGs and the large dispersion of (Li) seen in RGs—at least three orders of magnitude for “normal” RGs and two more orders of magnitude when including the rare Li-rich stars. Li-rich stars, generally considered to be those with (Li) dex, exceed the Li abundances predicted by standard models, and the addition of non-standard mixing tends to predict lower (Li) (e.g., Charbonnel 1995, Denissenkov & VandenBerg 2003) except in special cases (Sackmann & Boothroyd 1999, Palacios et al. 2001, Denissenkov & Herwig 2004). Other physical properties of red giants that are associated with Li-richness include fast rotation (e.g., Drake et al. 2002 and Carlberg et al. 2012) and infrared excesses (e.g., de la Reza et al. 2015 and references therein). Siess & Livio (1999) suggested that high Li, fast rotation, and infrared excess could all be plausibly explained by the engulfment of planets or brown dwarfs. At least one planet-hosting RG in the field is known to be Li-rich (Adamów et al., 2012).
Open clusters have historically been used to understand the mixing processes that affect the abundances of Li and other elements during the red giant phase, especially to discern the mass dependence. Mixing in RGs not only dilutes Li but also alters the surface C, N, and O abundances and reduces 12C/13C. While the first evidence of non-standard mixing in Population I stars was found for field RGs (e.g., Tomkin et al. 1976 and references therein), Gilroy (1989) was the first to study the mass dependence using open clusters. She found a positive correlation between 12C/13C and the cluster turn-off mass up to 2.2 but no correlation between (Li) and the turn-off mass. Smiljanic et al. (2009) found the same correlation between 12C/13C and turn-off mass and also identified a small grouping of massive stars with low 12C/13C. They interpreted this as a signature of extra mixing taking place during the early-AGB stage.
Extra mixing also occurs in low mass stars at the luminosity bump phase (the stage when the H-burning shell encroaches on the region of the star that was well mixed by convection during first dredge-up) where additional Li depletion occurs via thermohaline mixing (Charbonnel & Zahn, 2007). Evidence of this mixing is seen in the dichotomy of (Li) in open clusters in the region of the color-magnitude diagram (CMD) where red clump stars and first ascent stars overlap (e.g., Pilachowski et al. 1988, Pasquini et al. 2001, Anthony-Twarog & Twarog 2004, Pasquini et al. 2004, Anthony-Twarog et al. 2009 )
Open clusters were also instrumental in progressing our understanding of a mass-dependent Li-depletion mechanism in MS stars, known as the Li-dip. This feature was first found in the Hyades (Boesgaard & Tripicco, 1986), where MS stars in a very narrow temperature range show a large depletion in Li compared to stars that are both hotter and cooler. Cummings et al. (2012) showed that the mass at which the Li-dip occurs increases with increasing metallicity. Understanding the amount of Li depletion on the main sequence is of course necessary for interpreting the abundances measured at later stages of evolution.
The goal of this study is to test whether the presence of substellar companions affects the level of (Li) observed during the red giant phase. Given the complex evolution of Li throughout a stars’s life, we focused the study on three substellar companion-hosting RGs (2 planetary mass and 1 brown dwarf mass companion) that are members of open clusters. Cluster membership allows for a more precise estimate of the stellar masses and, importantly, the comparison to other RGs of nearly identical mass and composition, which provides a better opportunity for isolating effects due to the presence of companions. Therefore, we also present (Li) for 1–3 red giants in each cluster that are not known to host planets. We also measure 12C/13C and to explore possible differences in the stars’ mixing histories.
II. Clusters Properties and Stellar Sample
Most of the stars in this study come from Lovis & Mayor (2007), which describes their program for monitoring RGs in 13 open clusters for planetary companions. Their sample includes 6 stars in NGC 2423 (3, 43, 240, 73, 20, and 56) and 7 stars in NGC 4349 (127, 174, 53, 168, 203, 5, and 9). In both clusters, a SSC was discovered around the brightest (presumably most evolved) star monitored in each cluster. Two additional stars come from Brucalassi et al. (2014), who discovered three planet-hosting stars (two MS stars and one RG) among a large sample of M67 stars being monitored for companions. Again, the planet was discovered around one of the most evolved stars monitored.
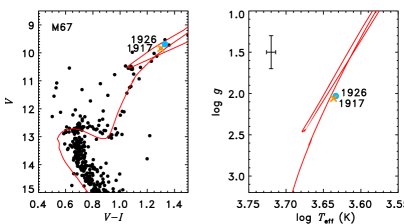
M67 is one of the most well-studied open clusters and has a near-solar age and metallicity. We adopt an age of 4.3 Gyr, , and pc for M67 from Salaris et al. (2004) and [Fe/H]= (see Section IV.1). A Bressan et al. (2012) isochrone with these properties gives the masses of the stars on the red giant branch (RGB) to be 1.3 , consistent with the mass adopted in Brucalassi et al. (2014) for the planet hosting star ( ). In the top left column of Figure 1, we show the CMD of M67 with photometry from Montgomery et al. (1993) and the Bressan et al. (2012) isochrone with the adopted cluster parameters. The planet hosting star is BD+12 1917, and we selected BD+12 1926 as a comparison star for its very similar color and magnitude.
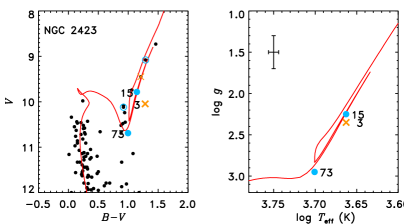
The properties of the other two clusters are more disputed. Lovis & Mayor (2007) adopted the cluster parameters available in WEBDA for NGC 2423, and we also adopt those values for the age (=8.867), reddening (E)=0.097), and distance (=766 pc). They adopted [Fe/H] of from Twarog et al. (1997). However, more recent studies find lower metallicities (Mortier et al. 2013 and Heiter et al. 2014). Our measured [Fe/H] is dex. In the middle left panel of Figure 1, we show optical photometry (Hassan, 1976) of the cluster together with an isochrone adopting the metallicity of dex. The planet host is NGC 2423 3, and the two comparison stars were selected to bracket that star in magnitude. The thin-lined/open symbols of the three RGs we target show the photometry of Hassan (1976), while the thicker/filled symbols show the updated photometry of these stars (Høg et al., 2000) used in Section V.
For NGC 4349, the available WEBDA values are =8.315, =0.384, and =2176 pc. Lovis & Mayor (2007) adopted [Fe/H]= dex from Piatti et al. (1995). Newer studies make substantial changes to these parameters. Majaess et al. (2012) re-derived cluster properties using infrared photometry and found the cluster to be older (=8.55), closer (=1630 pc) and less-reddened (=0.291). Their results were insensitive to adopted metallicity. We find a metallicity of [Fe/H]= dex. The bottom left panel of Figure 1 shows the optical photometry of Lohmann (1961), corrected to the standard photometry system with the corrections given by Majaess et al. (2012). The isochrones adopt the Majaess et al. (2012) properties and our metallicity. The SSC host is the brightest RG, NGC 4349 127, and we selected three apparently less-evolved RGs as comparison stars. Majaess et al. (2012) revised the mass measurement of NGC 4349 127 from (Lovis & Mayor, 2007) down to , which would lower the companion’s from 19.8 to 17.0 .

III. Observations
All of the stars analyzed in this study were observed with the Magellan Inamori Kyocera Echelle (MIKE) spectrograph between May 2012 and March 2014 using the slit, which results in a resolving power of 44,000. The data were reduced with the Carnegie python pipeline (Kelson, 2003)111Available at http://code.obs.carnegiescience.edu/mike, which completes standard CCD processing (overscan subtraction, bad pixel masks, flat fielding, sky subtraction), and extracts and wavelength calibrates the target spectra. Only data from the red arm of the spectrograph, covering 4800–9400 Å, were used in this analysis. The 34 echelle orders were combined to a one-dimensional format and velocity shifted to the stellar rest frame. The signal-to-noise ratio (S/N) of the data is 150–250 near 6700 Å.
IV. Stellar Parameters and Abundances
IV.1. , , [Fe/H], &
The stellar parameters of , , [Fe/H], and were measured spectroscopically using equivalent widths (EWs) of Fe I and Fe II lines. We used the Carlberg et al. (2012) Fe line list, and measured EWs for 72 Fe I and 13 Fe II lines. These measurements are given in Table 1. We used the ‘abfind’ driver in the 2014 release of MOOG (Sneden, 1973) to compute (Fe) from the EWs, using MARCS spherical atmosphere models (Gustafsson et al. 2008, Plez 2008). The parameters of the atmospheric models were adjusted until the output (Fe I) and (Fe II) were within 0.02 dex and there was no correlation between the output (Fe I) and either the lines’ excitation potentials or reduced EWs. The results are given in the first six columns of Table 2. The column is the standard deviation of the Fe I lines.
We find average cluster metallicities of [Fe/H] dex () for NGC 2423, [Fe/H] dex () for NGC 4349, and [Fe/H] dex () for M67. Our measured and are compared to the cluster isochrones in the right panels of Figure 1. A representative error bar is given in each panel. The stellar parameters are in excellent agreement with the cluster isochrones.
In Table 3, we compare our measurements of the stellar parameters of the SSC hosts to the values reported in the literature. Ghezzi et al. (2010a) and Mortier et al. (2013) measured parameters for two of the stars. For NGC 2423 3, our result is intermediate to these two studies. For NGC 4349 127, our and are lower than both studies, but generally agree within the uncertainties. For BD+12 1917, all of our parameters agree with Brucalassi et al. (2014) within the uncertainties.
| Species | EW1 | EW2 | EW3 | EW4 | EW5 | EW6 | EW7 | EW8 | EW9 | ||||
|---|---|---|---|---|---|---|---|---|---|---|---|---|---|
| () | (eV) | (dex) | (mÅ) | (mÅ) | (mÅ) | (mÅ) | (mÅ) | (mÅ) | (mÅ) | (mÅ) | (mÅ) | ||
| 5307.36 | 26.0 | 1.61 | -2.99 | 185.2 | 186.1 | 172.1 | 176.7 | 147.6 | 154.9 | 150.4 | 189.6 | 179.4 | |
| 5322.04 | 26.0 | 2.28 | -2.80 | 134.65 | 138.4 | 128.6 | 130.0 | 106.2 | 112.9 | 105.1 | 143.7 | 132.8 | |
| 5466.99 | 26.0 | 3.57 | -2.23 | 91.9 | 91.9 | 83.9 | 88.9 | 66.8 | 68.2 | 65.3 | 90.9 | 84.9 | |
| 5491.83 | 26.0 | 4.19 | -2.19 | 42.9 | 43.6 | 43.2 | 45.2 | 31.3 | 35.7 | 31.2 | 44.9 | 44.8 | |
| 5522.45 | 26.0 | 4.21 | -1.56 | 78.5 | 78.7 | 79.0 | 83.2 | 69.7 | 68.3 | 70.9 | 84.7 | 83.0 |
Note. — (This table is available in its entirety in a machine-readable form in the online journal. A portion is shown here for guidance regarding its form and content.)
| Star | [Fe/H] | (Li)LTE | (Li)NLTE | 12C/13C | |||||
|---|---|---|---|---|---|---|---|---|---|
| (K) | (dex) | (dex) | (dex) | (km s-1) | (dex) | (dex) | (km s-1) | ||
| NGC 2423 15 | 4600. | 2.25 | 0.11 | 1.56 | 19 | ||||
| NGC 2423 3 | 4600. | 2.35 | 0.11 | 1.51 | +1.30 | +1.56 | 24 | ||
| NGC 2423 73 | 5020. | 2.95 | +0.01 | 0.10 | 1.42 | +0.16 | +0.32 | 17 | |
| NGC 4349 127 | 4370. | 1.70 | 0.11 | 1.70 | +0.94 | +1.26 | 23 | ||
| NGC 4349 174 | 4570. | 2.05 | 0.11 | 1.69 | +0.59 | +0.87 | 21 | ||
| NGC 4349 5 | 5030. | 2.50 | 0.10 | 1.62 | +0.49 | +0.66 | 20 | 4.7 | |
| NGC 4349 9 | 4960. | 2.35 | 0.11 | 1.53 | +1.00 | +1.18 | 20 | 7.5 | |
| BD+12 1917 | 4330. | 2.06 | 0.12 | 1.55 | 16 | ||||
| BD+12 1926 | 4300. | 2.03 | 0.12 | 1.53 | 14 |
IV.2. Lithium and 12C/13C
Both (Li) and 12C/13C were measured via spectral synthesis using the line lists and general procedure of Carlberg et al. (2012). The Li line list was originally published by Ghezzi et al. (2009). We adopted scaled-solar abundances for each star, using the solar values in Asplund et al. (2009). Since RGs have completed first dredge-up, their C/N are not solar, but the total abundance of C+N is conserved. We adopted a ratio of C/N and an initial guess of scaled-solar abundances for C+N. However, C+N was a free parameter in the synthesis fits. When fitting the Li I doublet near 6708 Å, all of our stars required an increase in the C and N abundances. We used a simple gaussian broadening to fit the spectral region, which varied from 0.15–0.26 Å, with the exception of NGC 4349 9, which was best fit by including rotational broadening of 10 km s-1 on top of 0.15 Å of gaussian broadening. The local thermodynamic equilibrium (LTE) abundances were corrected for non-LTE (NLTE) effects by interpolating the grid of corrections computed by Lind et al. (2009).
12C/13C was measured by fitting the spectral features of 12CN and 13CN in the 8001–8006 Å spectral region. The C+N abundances were again left as free parameters with the ratio still fixed at 1.5. Generally, the stars required 0.05 dex less of each element in the fit for 12C/13C than in the fit for (Li).
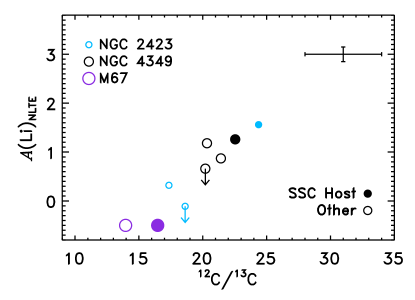
The results for 12C/13C and (Li) are given in columns 7–9 of Table 2 and are plotted in Figure 2. NGC 2423 3, one of the planet hosts, is found to be Li-rich with (Li)NLTE=1.56 dex. This abundance is over an order of magnitude larger than the two comparison stars. The brown dwarf host in NGC 4349 (star 127) also has the highest (Li) compared to the control stars, although its abundance is consistent with that of one of the control stars (star 9) within the uncertainties. All but one of the control stars (NGC 2423 15) in these two clusters have been monitored for substellar companions by Lovis & Mayor (2007), with no companions yet found. The two stars analyzed in M67 appear to have identical (Li), but the control star has not been monitored for substellar companions.
There is also a tight correlation (Spearman’s rank correlation coefficient, with ) between (Li) and 12C/13C for the stars in this study that may suggest the stars are showing different levels of dilution. Excepting the Li-rich star, the correlation also progresses with cluster age (and thus stellar mass) with the youngest cluster showing the highest abundances (least dilution) and the oldest cluster showing the lowest abundances (most dilution). This dilution scenario is explored in more detail in Section VI.3. In all cases, the SSC hosting red giant in each cluster has the largest (Li) and 12C/13C compared to the other members we analyzed, although only NGC2423 3 has abundances that are significantly different from the other RGs in the cluster. In Section VI.1, we explore whether the abundance patterns are consistent with the relative evolutionary stages of the stars in each cluster.
IV.3.
The stellar rotational velocity () was measured for each star by fitting profiles to six unblended iron lines as in Carlberg et al. (2012). Macroturbulence () values were computed using each’s stars and the - relationship given in Hekker & Meléndez (2007) for luminosity class III stars (5 km s-1). For the NGC 2423 and M 67 stars, the combination of instrumental broadening and created profiles broader than the observed lines for no rotation. For these stars, we used appropriate for luminosity class IV stars (3 km s-1). Our measured are given in the last column of Table 2. We found that almost all of the stars have very slow rotation, with km s-1. Only NGC4349 5 and NGC4349 9 have measurable rotation rates of and km s-1, respectively. Given these stars’ location near the base of the RGB in the CMD in Figure 1, this result is consistent with the picture that these stars are still spinning down. NGC4349 9’s position on the - diagram could also be consistent with the red clump. Rotation models of intermediate mass stars, which leave the MS with much higher rotation rates than low mass stars, show that this rotation rate is still within the predicted red clump rotation for the fastest rotators (e.g., Tayar et al. 2015).
V. Stellar Masses
One of the advantages of studying RGs in open clusters is that their stellar ages and thus masses are better constrained than for the typical field RG. However, changes to the inferred cluster age and metallicity affects the isochronal mass estimate for the RGs, and this is particularly problematic for the two NGC clusters whose properties are less well constrained than M67. For the SSC hosts in these two clusters, there is also a discrepancy between the mass estimates derived purely from cluster isochrones and those that rely on the individual stars’ spectroscopic information. Both Ghezzi et al. (2010a) and Mortier et al. (2013) used the online code PARAM222Available at http://stev.oapd.inaf.it/cgi-bin/param. (da Silva et al., 2006) to estimate the likely stellar mass, age, , and radius of planet-hosting RGs. Ghezzi et al. (2010a) find for NGC 2423 3 and for NGC 4349 127. In contrast, Mortier et al. (2013) find for NGC 2423 3 and for NGC 4349 127. Some of the difference in these two calculations may result from different adoptions of reddening to the stars. Both studies find a lower mass for NGC2423 3 compared to the 2.4 adopted by Lovis & Mayor (2007). The mass of NGC4349 127 by Ghezzi et al. (2010a) is well within the range of previous mass estimates based on stellar isochrone fitting (3.1–3.9 , see Section II), while Mortier et al. (2013) finds a substantially lower mass.
We can add an additional mass estimate using our measured and combined with literature -band photometry and adopting a distance and reddening to each cluster. We adopt magnitudes from the Tycho-2 catalog (Høg et al., 2000), which are available for all of the NGC 2423 stars and NGC 4349 127. These are converted to the Johnson magnitude system. Magnitudes for the remaining NGC 4349 stars come from Mermilliod et al. (2008). The adopted reddening and distances, given in Section II, allows us to compute absolute magnitudes, . These are converted to bolometric luminosities () using the bolometric corrections in Table 1 of Torres (2010). The stellar mass is then derived from , where is the Stefan-Boltzmann constant, and is the gravitational constant.
We find that the NGC 2423 RGs have masses between 1.9–2.4 , with an average of 2.1 . The planet hosting star has . The mass estimates for the NGC 4349 RGs range from 2.2–3.3 , with an average of 2.8 . The brown dwarf hosting star has . The typical total uncertainty in the mass is . Like the other mass estimates that rely on some spectroscopic information, our results favor lower masses than those that rely purely on photometric isochrone fitting.
VI. Discussion
VI.1. Expected (Li) in Each Cluster
In the following subsections, we discuss the relative evolutionary stages of the RGs in each cluster individually. The masses of the RGs are different enough that very different processes affecting the Li evolution are relevant for each cluster. One crucial difference on the RGB is whether the stars have degenerate (lower mass stars) or non-degenerate He cores (higher mass stars). For solar-metallicity stars, the critical mass separating these regimes is (Charbonnel & Lagarde, 2010). For stars with non-degenerate He cores, Li evolution should cease once the stars complete first dredge-up. Stars with degenerate He cores will evolve through both the luminosity bump and He flash stages of evolution, and both of these stages have been suggested to alter RGs’ (Li) (e.g., Sackmann & Boothroyd 1999, Kumar et al. 2011).
VI.1.1 NGC 2423
The NGC 2423 stars are near the transition mass separating degenerate and non-degenerate He cores. This fact is especially relevant for trying to understand the enhanced (Li) of NGC 2423 3. Its evolutionary stage appears to be intermediate to the other two stars analyzed in the cluster and only slightly less evolved than NGC 2423 15. If the lower mass estimates are correct, then the star may have recently evolved through the luminosity bump, which could explain its higher (Li) if thermohaline mixing took place at the luminosity bump (e.g., Charbonnel & Lagarde 2010). In this scenario, however, one would expect the similarly evolved comparison star NGC 2423 15 to also show high Li. On the other hand, if the higher mass inferred from the cluster age is correct, then the star will transition to the core He burning stage without any thermohaline mixing taking place—as is evident by the lack of a bump feature in the isochrone in Figure 1. In that case, the enriched Li may be better explained as coming from an external source, such as planet engulfment.
The (Li) results in NGC 2423 could also be described as a bifurcation or bimodal distribution of (Li), which has also been seen in NGC 752, NGC 3680, and IC 4651 (e.g., Pilachowski et al. 1988, Pasquini et al. 2001, Anthony-Twarog & Twarog 2004, Pasquini et al. 2004, Anthony-Twarog et al. 2009). The RGs in these clusters all have masses 1.8–1.9 , within the range of mass estimates for NGC 2423 but favoring the degenerate He-core case. One interpretation of the bifurcation is that it is discriminating between first ascent RGs (high (Li)) and red clump stars (low (Li)) that are occupying the same locus on the CMDs (Pilachowski et al., 1988). This interpretation was used by Pasquini et al. (2004) to argue that the RGs in NGC 3680, which mostly show high (Li), are dominated by first ascent stars. However, since red clump stars should be more common than first ascent stars, Pasquini et al. (2001) argued that it was possible that the red clump stars in NGC 3680 were in fact the high (Li) stars. These studies further complicate the interpretation of NGC 2423 3 and whether its high Li is related to the presence of the planet or to its evolutionary stage.
VI.1.2 NGC 4349
The NGC 4349 RGs are almost certainly above the mass threshold for non-degenerate He cores. The most similar comparison star to the SSC host is star 174, which is less evolved than the SSC host unless 174 is on the AGB and 127 is on the RGB. Star 127’s (Li) exceeds 174’s even after accounting for the 0.15 dex uncertainty in the abundance, which suggests that the high Li is significant. However, if star 127 is on the AGB track and not the RGB track, it would be at the right luminosity to be undergoing an early-AGB extra-mixing phase that could replenish its Li (Charbonnel & Balachandran, 2000).
The evolutionary status of the other two comparison stars are more difficult to interpret. Stars 5 and 9 have nearly identical colors and magnitude yet one has the lowest (Li) and one the second largest (Li) of the four stars observed. They fall on the region of the isochrone where it is most difficult to discriminate first ascent and clump stars. The higher (Li) of star 9 may be because it is at the base of the RGB and has not yet completed first dredge-up, while star 5 is in the red clump and thus has undergone the most Li depletion. If this interpretation is correct and the SSC host is an RGB star, than the high (Li) of the SSC host may be significant and due to the presence of the companion.
VI.1.3 M67
M67’s RGs are definitively in the degenerate He core mass regime, and the two RGs studied here have evolved beyond the luminosity bump. The bump can be seen in M67’s isochrone in Figure 1 at and . The Li evolution of RGs in M67 is more complex than that of the other two clusters. In addition to the possible alterations to Li at the luminosity bump, the RGs in M67 are also likely the evolved counterparts of Li-dip stars. The Li-dip refers to a feature seen when plotting (Li) of main sequence stars in open clusters as a function of , and thus mass (Boesgaard & Tripicco, 1986). For a narrow range of masses, (Li) is considerable lower than stars that are slightly more or less massive. For solar metallicity, this mass is (Anthony-Twarog et al., 2009). Recall that Brucalassi et al. (2014) found for the planet-hosting star. This could explain why the (Li) of the literature M67 RGs (see Section VI.2) all have higher (Li) than our two stars if the literature stars all evolved from stars just outside of the Li-dip. The comparison star in this work is nearly identical to the planet host in every way. Thus, there is no evidence that the presence of the planet has affected the stellar (Li) (though we note that the comparison star has not been monitored for companions).
VI.2. Comparison to Other Red Giants
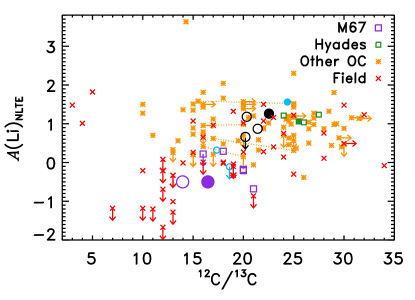
In Figure 3, we compare our measurements of (Li) and 12C/13C to open cluster RGs and field RGs in the literature. The field giants come from Lambert et al. (1980). Over half of the open cluster sources come from Gilroy (1989), which notably includes four RGs in the Hyades including the planet host Tau (Sato et al., 2007). Gilroy (1989) found that the mean 12C/13C of each cluster was positively correlated with the cluster turn-off mass (similar to what we find) whereas the average (Li) showed no correlation with turn-off mass. Although the Gilroy (1989) study included M67 stars, only 12C/13C was measured for them. However, there are five stars in M67 for which we have (Li) measured by Canto Martins et al. (2011) and updated 12C/13C measured by Tautvaišiene et al. (2000). Figure 3 also includes four NGC 6819 RGs that combine (Li) come from Anthony-Twarog et al. (2013) with 12C/13C from Carlberg et al. (2015). The remaining stars come from Luck (1994), Gonzalez & Wallerstein (2000), Santrich et al. (2013), Monaco et al. (2014) and Böcek Topcu et al. (2015), where each study provided both the (Li) and 12C/13C measurements for each star. With the exception of the NGC 6819 stars and the Trumpler 5 stars (Monaco et al., 2014), all of the literature studies presented only LTE abundances and thus have had NLTE corrections applied in the same way by us.
Among the field stars, there is a correlation between (Li) and 12C/13C that is especially apparent at 12C/13C . Lambert et al. (1980) suggested that these stars have masses . In contrast, the open cluster stars generally have masses and show no correlation between (Li) and 12C/13C. In the broader context of these literature abundances, none of our stars’ (Li) and 12C/13C appear unusual, but the tight correlation we found in Figure 2 is significant. We tested the likelihood that drawing nine stars at random from either the full sample of open cluster stars or the large Gilroy (1989) subsample would have abundances as correlated as in our sample (), and we found the probability to be low. The likelihood is 0.2% for the Gilroy (1989) sub-sample and 0.03% for the entire literature open cluster sample.
If the correlation between (Li) and 12C/13C that we find is real, the lack of such a correlation in the literature open cluster sample may be due in part to the fact that it was not homogeneously analyzed. For example, there are seven stars in common between Tautvaišiene et al. (2000) (adopted 12C/13C for M67 literature stars) and Gilroy (1989) and Gilroy & Brown (1991) that we can compare. The newer measurements find larger 12C/13C for all but one of the stars in common, with 12C/13C ranging from to 14. Alternatively, the large literature sample may simply indicate a more complex relationship between (Li) and 12C/13C in more massive stars. Because lithium is more sensitive to the details of mixing than 12C/13C, different degrees of non-standard mixing could lead to a wide spread of (Li) at a given 12C/13C (see Section VI.3). Additionally, any replenishment of Li due to companion engulfment will further confuse any relationship between (Li) and 12C/13C that is due solely to stellar evolution processes.
VI.3. The Role of Non-Standard Mixing in Abundances
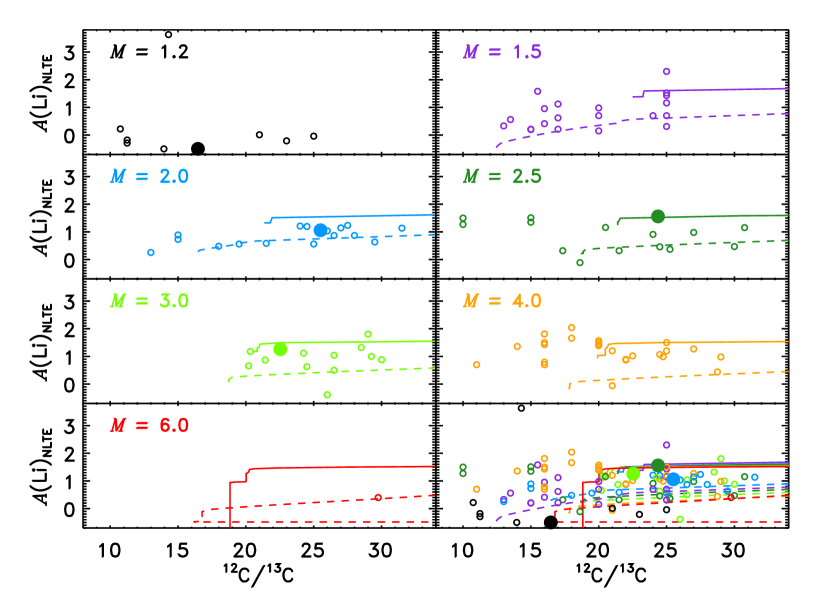
The correlation between (Li) and 12C/13C seen in Figure 2 suggests that the stars have experienced different levels of mixing, since both (Li) and 12C/13C are reduced by deeper mixing. To explore this possibility, we compare the observed (Li) and 12C/13C to model predictions from Lagarde et al. (2012) in Figure 4. These models were run to explore the differences between models that adopt standard mixing only and those that include both thermohaline and rotation-induced mixing. The mass range of the models brackets the mass range of the stellar sample. The observed data are color-coded to match the closest matching model mass, and comparisons between the individual model masses and all of the models together are shown in separate panels. The standard models reproduce well the upper envelope of (Li) for 12C/13C. The models that include other mixing processes reproduce the lower range of (Li) for a wider range of 12C/13C. Only one initial condition for non-zero rotation was considered in these models. Charbonnel & Lagarde (2010) showed that stars with lower MS rotation rates had less rotation-induced mixing and thus higher (Li) as RGs. Since the majority of our stars have abundances that fall between the standard models and the rotation models, we can assume that these stars had slower MS rotation rates than what was adopted for the models. However, the models fail to reproduce the stars with low 12C/13C but relatively high (Li).
With the exception of the M67 stars, all of the open cluster stars with known SSCs are more massive than the Kraft break (1.3 , Kraft 1967) and thus have a wide range of rotation rates on the MS. Thus, for the SSC hosts in NGC 2423, NGC 4349 and the Hyades, the relative (Li) compared to the non-hosts may relate to different amounts of rotational mixing on the main sequence. In these clusters, the SSC hosts have either considerably higher (NGC 2423) or comparable (Li) to the other stars in the cluster; therefore, we can conclude that the SSC hosts had comparable or smaller MS rotation rates than the non planet hosts. This interpretation is in conflict with the results of Alves et al. (2010), who found observationally that planet hosting MS stars tend to have higher angular momentum than their planet-less counterparts, especially at masses . On the other hand, Chanamé et al. (2005) demonstrated that the degree of rotational mixing on the RGB for the same MS turn-off rotation was sensitive to the steepness of the differential rotation profile of the star. Thus, if the planet hosts had similar turn-off rotation rates to the stars in their respectively clusters, their higher observed (Li) and 12C/13C may also indicate a shallower rotation profile, rather than a slower MS rotation rate, compared to the other cluster stars.
VI.4. Li in Planet-Hosting Red Giants
The first Li-rich planet hosting star, BD+48 740 (Adamów et al., 2012), is a field star and has (Li)NLTE of 2.33 dex (updated to 2.07 dex in Adamów et al. 2014), slow rotation, but no measurement of 12C/13C. The authors consider the eccentricity of the planet’s orbit to be uncommonly high (), and they argue that the high eccentricity and stellar (Li) suggested the ingestion of an inner, massive planet. Planet ingestion could trigger a mass loss event that results in a brief period of infrared excess (Siess & Livio, 1999). BD+48 740 and the three SSC hosting stars studied here were included in a recent comprehensive survey of IR excess around known Li enhanced stars (Rebull et al., 2015), but no excess was found for any of them.
We can also test whether the (Li) of our SSC hosts correlate with eccentricity or any other orbital property. Table VI.4 presents the stellar (Li) and companion orbital properties of all of the open cluster SSC hosts ordered from highest to lowest stellar (Li). These properties include the companion mass (), orbital period (), semi-major axis (), and eccentricity (). We also list and and give the distance of periastron passage () as a fraction of the stellar radius. This last property gives a sense of the relative importance of possible tidal interactions between the planet and host star. The “Ref.” column gives the source of the and measurement. Both and have been recalculated using the adopted values of . The table also includes the planet-hosting field star BD+48 740.
Although BD+48 740 has both the largest stellar (Li) and hosts the planet with the largest eccentricity, the trend does not continue in the open cluster stars. The star hosting the next most eccentric planet (BD+12 1917) has the lowest (Li) in this sample. The only other Li-rich star (NGC 2423 3) does not stand out from the sample in any orbital characteristic of the planet. The (Li) does trend with the orbital periods of the companions, with the largest (Li) corresponding to the longest periods. However, because of the different stellar masses and orbital eccentricities, this trend does not extend to the orbital semi-major axes or the periastron passage distances of the companions. Based on this small sample, there appears to be no obvious physical connection between a RG’s Li and the orbital properties of the companion it hosts.
| Name | (Li)NLTE | aaRecalculated using adopted . | aaRecalculated using adopted . | Ref. | |||||
|---|---|---|---|---|---|---|---|---|---|
| (dex) | () | (days) | (AU) | () | () | () | |||
| BD+48 470 b | +2.33 | 1.6 | 1.88 | A12 | |||||
| NGC2423 3 b | +1.56 | 2.02 | G10 | ||||||
| NGC4349 127 b | +1.26 | 2.35 | G10 | ||||||
| Tau b | +1.06 | 1.94 | G10 | ||||||
| BD+12 1917 b | 0.53 | B14 |
VII. Conclusions
We have measured spectroscopic stellar parameters and abundances for nine RG stars in three open clusters, with one substellar companion host in each cluster. The average [Fe/H] for the clusters are found to be dex (NGC 2423), dex (NGC 4349), and dex (M67). Our focus is on the (Li) and 12C/13C of the RGs to explore whether the presence of planets affects the stellar Li content either through differences in stellar mixing (traceable with 12C/13C) or possibly through the past engulfment of other planets in the system. One of the planet-hosts, NGC 2423 3, is found to be Li-rich and has significantly higher (Li) than the two comparison stars we measured. The brown dwarf host, NGC 4349 127, has the highest (Li) compared to its comparison stars; however, one of the comparison stars has a similar abundance within the uncertainties. In contrast, the planet host in M67 is nearly identical to its comparison star in every stellar parameter we measured, including (Li) and 12C/13C. Similarly, the planet-hosting star in the Hyades (a cluster for which (Li) and 12C/13C are available in the literature) does not have any unusual abundances.
Since Li-richness in RGs is a relatively rare phenomenon, only one other planet-host was previously known to be Li-rich (Adamów et al., 2012). Combining this star with the open cluster SSC hosts, we looked for a connection between the companion’s orbital properties and the stellar (Li). We found that (Li) correlated with the companion’s orbital period, but there was no correlation to the distance of periastron passage or eccentricity that would suggest a past planet-star interaction. Additionally, none of the stars show evidence of an IR excess (Rebull et al., 2015).
The stellar Li content on the RGB is also largely influenced by stellar mass and the associated differences in mixing histories. Therefore, we have compared our (Li) and 12C/13C to measurements of other cluster stars in the literature in an attempt to understand the mixing history of stars and the potential relationship between (Li) and whether the star hosts a planetary companion. In the intermediate mass regime (2–3.5 ), our planet-hosts have some of the highest (Li). If rotation-induced mixing is the cause of the (Li) spread for stars in this mass regime, this could imply that the planet hosts had lower MS rotation rates. However, a limitation of this interpretation is the small number of stars in each cluster that have both (Li) and 12C/13C. Studying larger populations of stars in individual open clusters will better constrain the role of mass and evolutionary stage on (Li), providing the opportunity to elucidate the role of rotation and the presence of planets.
Another limitation of this study is the discrepant mass estimates for the cluster RGs which limits our knowledge of the stars’ current evolutionary phases and whether they have degenerate or non-degenerate He cores. This limitation is especially problematic for the Li-rich planet host NGC 2423 3, whose mass estimate is near the dividing mass between these two evolutionary pathways. Its evolutionary stage would be at the luminosity bump if its core is degenerate; thus, its higher Li could also plausibly be due to thermohaline mixing. Improved photometry for better characterization of the cluster properties and precise parallax measurements (such as what will be provided by de Bruijne 2012) would help resolve the mass uncertainty.
References
- Adamów et al. (2012) Adamów, M., Niedzielski, A., Villaver, E., Nowak, G., & Wolszczan, A. 2012, ApJ, 754, L15
- Adamów et al. (2014) Adamów, M., Niedzielski, A., Villaver, E., Wolszczan, A., & Nowak, G. 2014, A&A, 569, A55
- Alves et al. (2010) Alves, S., do Nascimento, Jr, J.-D., & de Medeiros, J. R. 2010, MNRAS, 408, 1770
- Anthony-Twarog et al. (2009) Anthony-Twarog, B. J., Deliyannis, C. P., Twarog, B. A., Croxall, K. V., & Cummings, J. D. 2009, AJ, 138, 1171
- Anthony-Twarog et al. (2013) Anthony-Twarog, B. J., Deliyannis, C. P., Rich, E., & Twarog, B. A. 2013, ApJ, 767, 19
- Anthony-Twarog & Twarog (2004) Anthony-Twarog, B. J., & Twarog, B. A. 2004, AJ, 127, 1000
- Asplund et al. (2009) Asplund, M., Grevesse, N., Sauval, A. J., & Scott, P. 2009, ARA&A, 47, 481
- Baraffe & Chabrier (2010) Baraffe, I. & Chabrier, G. 2010, A&A, 521, A44
- Baumann et al. (2010) Baumann, P., Ramírez, I., Meléndez, J., Asplund, M., & Lind, K. 2010, A&A, 519, A87
- Böcek Topcu et al. (2015) Böcek Topcu, G., Afşar, M., Schaeuble, M., & Sneden, C. 2015, MNRAS, 446, 3562
- Boesgaard & Tripicco (1986) Boesgaard, A. M., & Tripicco, M. J. 1986, ApJ, 302, L49
- Bressan et al. (2012) Bressan, A., Marigo, P., Girardi, L., et al. 2012, MNRAS, 427, 127
- Brucalassi et al. (2014) Brucalassi, A., Pasquini, L., Saglia, R., et al. 2014, A&A, 561, L9
- Canto Martins et al. (2011) Canto Martins, B. L., Lèbre, A., Palacios, A., et al. 2011, A&A, 527, A94
- Carlberg et al. (2012) Carlberg, J. K., Cunha, K., Smith, V. V., & Majewski, S. R. 2012, ApJ, 757, 109
- Carlberg et al. (2015) Carlberg, J. K., Smith, V. V., Cunha, K., et al. 2015, ApJ, 802, 7
- Chanamé et al. (2005) Chanamé, J., Pinsonneault, M. H., & Terndrup, D. M. 2005, ApJ, 631, 540
- Charbonnel (1995) Charbonnel, C. 1995, ApJ, 453, L41
- Charbonnel & Balachandran (2000) Charbonnel, C., & Balachandran, S. C. 2000, A&A, 359, 563
- Charbonnel & Lagarde (2010) Charbonnel, C. & Lagarde, N. 2010, A&A, 522, A10
- Charbonnel & Zahn (2007) Charbonnel, C., & Zahn, J.-P. 2007, A&A, 467, L15
- Cummings et al. (2012) Cummings, J. D., Deliyannis, C. P., Anthony-Twarog, B., Twarog, B., & Maderak, R. M. 2012, AJ, 144, 137
- da Silva et al. (2006) da Silva, L., Girardi, L., Pasquini, L., et al. 2006, A&A, 458, 609
- de Bruijne (2012) de Bruijne, J. H. J. 2012, Ap&SS, 341, 31
- de la Reza et al. (2015) de la Reza, R., Drake, N. A., Oliveira, I., & Rengaswamy, S. 2015, ApJ, 806, 86
- Delgado Mena et al. (2015) Delgado Mena, E. , Tsantaki, M., Sousa, S. G., Kunitomo, M., Adibekyan, V., Zaworska, P., Santos, N. C., Israelian, G., Lovis, C., 2015, A&A, in press. arXiv:1511.04682
- Denissenkov & Herwig (2004) Denissenkov, P. A. & Herwig, F. 2004, ApJ, 612, 1081
- Denissenkov & VandenBerg (2003) Denissenkov, P. A. & VandenBerg, D. A. 2003, ApJ, 593, 509
- Drake et al. (2002) Drake, N. A., de la Reza, R., da Silva, L., & Lambert, D. L. 2002, AJ, 123, 2703
- Ghezzi et al. (2009) Ghezzi, L., Cunha, K., Smith, V. V., et al. 2009, ApJ, 698, 451
- Ghezzi et al. (2010a) Ghezzi, L., Cunha, K., Schuler, S. C., & Smith, V. V. 2010a, ApJ, 725, 721
- Ghezzi et al. (2010b) Ghezzi, L., Cunha, K., Smith, V. V., & de La Reza, R. 2010b, ApJ, 724, 154
- Gilroy (1989) Gilroy, K. K. 1989, ApJ, 347, 835
- Gilroy & Brown (1991) Gilroy, K. K., & Brown, J. A. 1991, ApJ, 371, 578
- Gonzalez (2014) Gonzalez, G. 2014, MNRAS, 441, 1201
- Gonzalez & Wallerstein (2000) Gonzalez, G., & Wallerstein, G. 2000, PASP, 112, 1081
- Gratton et al. (2000) Gratton, R. G., Sneden, C., Carretta, E., & Bragaglia, A. 2000, A&A, 354, 169
- Guandalini et al. (2009) Guandalini, R., Palmerini, S., Busso, M., & Uttenthaler, S. 2009, PASA, 26, 168
- Gustafsson et al. (2008) Gustafsson, B., Edvardsson, B., Eriksson, K., et al. 2008, A&A, 486, 951
- Hassan (1976) Hassan, S. M. 1976, A&A, 26, 13
- Heiter et al. (2014) Heiter, U., Soubiran, C., Netopil, M., & Paunzen, E. 2014, A&A, 561, 93
- Hekker & Meléndez (2007) Hekker, S. & Meléndez, J. 2007, A&A, 475, 1003
- Høg et al. (2000) Høg, E., Fabricius, C., Makarov, V. V., et al. 2000, A&A, 355, L27
- Israelian et al. (2009) Israelian, G., Mena, E. D., Santos, N. C., Sousa, S. G., Mayor, M., Udry, S., Cerdeña, C. D., Rebolo, R., & Randich, S. 2009, Nature, 462, 189
- Jofré et al. (2015) Jofré, E., Petrucci, R., Saffe, C., et al. 2015, A&A, 574, A50
- Kelson (2003) Kelson, D. D. 2003, PASP, 115, 688
- Kraft (1967) Kraft, R. P. 1967, ApJ, 150, 551
- Kumar et al. (2011) Kumar, Y. B., Reddy, B. E., & Lambert, D. L. 2011, ApJ, 730, L12
- Lagarde et al. (2012) Lagarde, N., Decressin, T., Charbonnel, C., et al. 2012, A&A, 543, A108
- Lambert et al. (1980) Lambert, D. L., Dominy, J. F., & Sivertsen, S. 1980, ApJ, 235, 114
- Lind et al. (2009) Lind, K., Asplund, M., & Barklem, P. S. 2009, A&A, 503, 541
- Lohmann (1961) Lohmann, W. 1961, Astronomische Nachrichten, 286, 105
- Lovis & Mayor (2007) Lovis, C. & Mayor, M. 2007, A&A, 472, 657
- Luck (1994) Luck, R. E. 1994, ApJS, 91, 309
- Majaess et al. (2012) Majaess, D., Turner, D., Moni Bidin, C., et al. 2012, A&A, 537, L4
- Maldonado et al. (2013) Maldonado, J., Villaver, E., & Eiroa, C. 2013, A&A, 554, 84
- Mermilliod et al. (2008) Mermilliod, J.-C., Mayor, M., & Udry, S. 2008, A&A, 485, 303
- Monaco et al. (2014) Monaco, L., Boffin, H. M. J., Bonifacio, P., et al. 2014, A&A, 564, L6
- Montgomery et al. (1993) Montgomery, K. A., Marschall, L. A., & Janes, K. A. 1993, AJ, 106, 181
- Mortier et al. (2013) Mortier, A., Santos, N. C., Sousa, S. G., et al. 2013, A&A, 557, A70
- Pasquini et al. (2001) Pasquini, L., Randich, S., & Pallavicini, R. 2001, A&A, 374, 1017
- Pasquini et al. (2004) Pasquini, L., Randich, S., Zoccali, M., et al. 2004, A&A, 424, 951
- Palacios et al. (2001) Palacios, A., Charbonnel, C., & Forestini, M. 2001, A&A, 375, L9
- Piatti et al. (1995) Piatti, A. E., Clariá, J. J., & Abadi, M. G. 1995, AJ, 110, 2813
- Pilachowski et al. (1988) Pilachowski, C., Saha, A., & Hobbs, L. M. 1988, PASP, 100, 474
- Plez (2008) Plez, B. 2008, Physica Scripta Volume T, 133, 014003
- Ramírez et al. (2012) Ramírez, I., Fish, J. R., Lambert, D. L., & Allende Prieto, C. 2012, ApJ, 756, 46
- Rebull et al. (2015) Rebull, L. M., Carlberg, J. K., Gibbs, J. C., et al. 2015, AJ, 150, 123
- Sackmann & Boothroyd (1999) Sackmann, I.-J. & Boothroyd, A. I. 1999, ApJ, 510, 217
- Salaris et al. (2004) Salaris, M., Weiss, A., & Percival, S. M. 2004, A&A, 414, 163
- Santrich et al. (2013) Santrich, O. J. K., Pereira, C. B., & Drake, N. A. 2013, A&A, 554, A2
- Sato et al. (2007) Sato, B., Izumiura, H., Toyota, E., et al. 2007, ApJ, 661, 527
- Sestito & Randich (2005) Sestito, P. & Randich, S. 2005, A&A, 442, 615
- Siess & Livio (1999) Siess, L., & Livio, M. 1999, MNRAS, 308, 1133
- Smiljanic et al. (2009) Smiljanic, R., Gauderon, R., North, P., et al. 2009, A&A, 502, 267
- Sneden (1973) Sneden, C. A. 1973, Ph.D. Thesis, The University of Texas at Austin
- Tautvaišiene et al. (2000) Tautvaišiene, G., Edvardsson, B., Tuominen, I., & Ilyin, I. 2000, A&A, 360, 499
- Tayar et al. (2015) Tayar, J., Ceillier, T., García-Hernández, D. A., et al. 2015, ApJ, 807, 82
- Tomkin et al. (1976) Tomkin, J., Luck, R. E., & Lambert, D. L. 1976, ApJ, 210, 694
- Torres (2010) Torres, G. 2010, AJ, 140, 1158
- Twarog et al. (1997) Twarog, B. A., Ashman, K. M., & Anthony-Twarog, B. J. 1997, AJ, 114, 2556