The Longevity of Lava Dome Eruptions
2Department of Geology, University at Buffalo, Buffalo NY, USA,
3USGS and USAID Volcano Disaster Assistance Program, Vancouver WA, USA,
4School of Geosciences, University of Edinburgh, Edinburgh, UK
Feb 08, 2016)
Abstract
Understanding the duration of past, on-going and future volcanic eruptions is an important scientific goal and a key societal need. We present a new methodology for forecasting the duration of on-going and future lava dome eruptions based on a database (DomeHaz) recently compiled by the authors. The database includes duration and composition for 177 such eruptions, with “eruption” defined as the period encompassing individual episodes of dome growth along with associated quiescent periods during which extrusion pauses but unrest continues. In a key finding we show that probability distributions for dome eruption durations are both heavy-tailed and composition-dependent. We construct objective Bayesian statistical models featuring heavy-tailed Generalized Pareto distributions with composition-specific parameters to make forecasts about the durations of new and on-going eruptions that depend on both eruption duration-to-date and composition. Our Bayesian predictive distributions reflect both uncertainty about model parameter values (epistemic uncertainty) and the natural variability of the geologic processes (aleatoric uncertainty). The results are illustrated by presenting likely trajectories for fourteen dome-building eruptions on-going in 2015. Full representation of the uncertainty is presented for two key eruptions, Soufriére Hills Volcano in Montserrat (10–139 years, median 35yr) and Sinabung, Indonesia (1–17 years, median 4yr). Uncertainties are high, but, importantly, quantifiable. This work provides for the first time a quantitative and transferable method and rationale on which to base long-term planning decisions for lava dome forming volcanoes, with wide potential use and transferability to forecasts of other types of eruptions and other adverse events across the geohazard spectrum.
Key Points
-
•
The durations of lava dome eruptions are heavy-tailed and depend on composition.
-
•
Objective Bayesian statistical models can describe the dependence on composition.
-
•
Model-based forecasts are made for the continued duration of active dome eruptions.
Index Terms and Key Words
-
8488
VOLCANOLOGY: Volcanic hazards and risks;
-
3245
MATHEMATICAL GEOPHYSICS: Probabilistic forecasting.
1 Introduction
The likely duration of ongoing volcanic eruptions is a topic of great interest to volcanologists, volcano observatories, and communities around volcanoes. However, few studies have investigated eruption durations (Bebbington 2007, Gunn et al. 2014, Mastin et al. 2009, Simkin 1993, Sparks and Aspinall 2004), in part because the data are sparse and distributed. This work utilizes a new database of lava dome eruptions to analyze the durations of dome building eruptions using an objective Bayes statistical model, and investigates possible characteristics (e.g., magma composition) that affect those eruption durations.
Lava dome forming eruptions can be long-lived, and can produce violent and difficult-to-forecast activity including plinian and vulcanian explosive activity and menacing pyroclastic density currents. The eruptive periods associated with domes are notorious for their tendency to cease extrusive activity and then to start up again weeks, months or years later. Periods of active dome extrusion and growth are interspersed with periods of relative quiescence, during which extrusion may slow or even pause altogether, but where persistent volcanic unrest continues and the volcano does not return to a long-term state of dormancy. This contribution focuses on the durations of these longer-term unrest phases, hereafter termed eruptions, which include periods of both lava extrusion and intervening quiescence.
2 The Lava Dome Database
When studying population characteristics of volcanic eruptions, it is critical to have clear and consistent criteria for selecting which data to include (Rodado et al. 2011). Our study includes all eruptions in a new lava dome database DomeHaz (Ogburn et al. 2012, v2.2) for which duration is recorded. This database contains information from dome-forming episodes that comprise eruptions at volcanoes. For most eruptions the information includes duration of eruptions, periods and pauses of dome growth; extrusion rates; and the timing and magnitude (VEI) of any associated large explosions. Entries were collected systematically from peer-reviewed sources, volcano observatory data sources, the Smithsonian Institution Global Volcanism Program (GVP) database (Global Volcanism Program 2013), the Bulletin of the Global Volcanism Network (BGVN) (Venzke et al. 2002), the Large Magnitude Explosive Volcanic Eruptions (LaMEVE, version 2) database (Crosweller et al. 2012), and Newhall and Melson (1983).
There is always ambiguity in what precisely constitutes a single “eruption”. Simkin et al. (1981) treated inactive periods of three months or less as a pause in an eruption, but took longer periods without activity to be gaps between eruptions. Dome-forming eruptions, which can be long-lived and often feature cyclical dome growth episodes, are particularly difficult to characterize consistently. Following Ogburn et al. (2015), we treat as a single eruption any period during which
-
1.
The volcano is described as “continuously active” in the literature, and/or
-
2.
Dome quiescence lasts less than years, and/or
-
3.
Frequent or continuous signs of unrest are reported throughout dome quiescence, without an apparent return to background levels.
As an example, this analysis will classify a persistently active system like Merapi to have been continuously active since 19 August, 1768. Very few cases rely on only one of these criteria, rather, there are usually multiple lines of evidence that support classifying discrete episodes of dome growth as a single eruption.
We identify dome-forming eruptions (of the total) with reported durations in DomeHaz, of which were still ongoing eruptions at the time of publication. Most completed DomeHaz eruptions (, ) lasted less than years. Of the remaining longer-lived completed eruptions, however, lasted longer than years, and lasted longer than years. All but one (Sinabung) of the ongoing eruptions has lasted years or more, half of them over years, and over years. Very long-lived dome-forming eruptions have occurred at Santa María (Santiaguito) Volcano, Guatemala ( years, and ongoing); Sangay Volcano, Ecuador ( years, ending in 1916); and Merapi Volcano, Indonesia ( years, and ongoing). Whereas the Santa María lava dome eruption has been extruding almost continuously since 1922, most other long-lived eruptions are characterized by frequent pauses lasting up to several years.
3 A Statistical Model
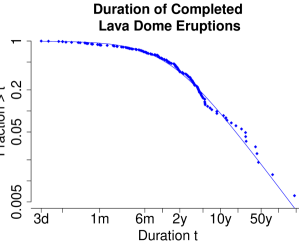
Following Sparks and Aspinall (2004), we model the duration of lava dome eruptions as random variables with the generalized Pareto distribution. This heavy-tailed distribution is supported empirically by the near linearity of the log-log plot in Figure (1) of frequency-versus-duration for the eruptions considered here. A formal goodness-of-fit test for the Pareto distribution gave a test statistic value of on degrees of freedom for a -value of , far from rejecting this hypothesis. In contrast, a test of the Exponential distribution gave on degrees of freedom, for showing this more commonly-used survival distribution is completely inconsistent with our data. The Pareto model is also supported theoretically by the statistical theory of extreme values, which asserts that the exceedances of sufficiently high thresholds of independent replicates from a wide range of probability distributions will have a generalized Pareto distribution (see the discussion of the “peaks over threshold” approach to extreme statistics in Coles 2001, Ch. 4). We present Bayesian models for forecasting in Section (5.2), to achieve forecasts that reflect all sources of model uncertainty. Computational details are presented in Appendix A.

3.1 Generalized Pareto Models
Sparks and Aspinall (2004) fit a generalized Pareto distribution to data consisting of a selection of dome-building eruptions taken from the Smithsonian Institution database (Simkin and Siebert 1994). We apply an extension of this model to a more recent collection of dome-building eruptions taken from DomeHaz (Ogburn et al. 2012); the extension reflects variation among the eruptive durations for volcanoes of differing compositions (dacitic/rhyolitic, andesitic, basaltic). Note that the Sparks and Aspinall (2004) study also differs because it considers durations of (shorter) discrete dome-building episodes, while we study durations of (longer) entire eruptive periods (see Section 2), so both the driving questions and the results are not directly comparable.
In our parameterization a random variable (here, the duration of an eruptive phase) with the generalized Pareto distribution can take on any positive number, with survival probability function and probability density function given for by
| (1) |
for some dimensionless “shape” parameter and a “scale” parameter measured in the same time units as — here, years. We denote this distribution by . For (as suggested by our data) the survival probability and density function decrease so slowly with increasing that the mean survival time is infinite, so that the average of a growing list of eruption durations should be expected to grow without bound. For that reason we present the median and quartiles for these distributions, which are well-defined and finite for all , rather than means and variances, which are not.
Eruptions which have already lasted for some considerable time are more likely to last a longer additional time than are new eruptions. For that reason it is of particular interest to find the conditional distribution of the remaining period of activity , for an eruption that has already lasted for some period . This too has a generalized Pareto distribution, with updated parameters: .
The most popular method for estimating uncertain statistical parameters from data is Maximum Likelihood estimation (Casella and Berger 1990, §7.2.2), in which parameters such as and are estimated by the values and for which the Likelihood Function (the joint probability density function for all the observed quantities, regarded as a function of the model parameters) attains its maximum value. In Appendix A we present the likelihood function for both fully-observed data (when both the start and end times for an eruption are known) and for censored data (where only a lower bound is known for the duration of an eruption, usually because it is still ongoing at the time of the analysis). Both fully-observed and censored data are present in our dataset. Here we present the resulting forecasts of the remaining duration of each of the fourteen volcanoes in our data set that are still active, as well as forecasts of total duration for possible new eruptions of each composition type.
We explore in two different ways the possibility that the remaining duration of activity for a lava dome eruption may depend on observable covariates such as the magma composition in terms of silica content (in percent). First, we classify into three groups by the eruption composition or, where unavailable, characteristic composition for that volcano, and fit models separately to each class; second, we introduce a log-linear regression model in which both the shape parameter and scale parameter for the Pareto duration distribution may depend on the silica content . Full details are given in Appendix A.
4 Results
In this section we fit three variations on the model of Section 3 to the DomeHaz data: an Aggregate model fitting a single generalized Pareto model to all 177 eruptions; a Grouped model, fitting separate Pareto models to each of three classes of eruption, based on composition; and a log-linear Regression model in which the Pareto parameters depend explicitly on silica levels. In each case model parameters are estimated by numerical maximization of the likelihood function to find Maximum Likelihood Estimators (MLEs), and Standard Errors (SEs) are estimated from the inverse Hessian matrix at the MLE.
4.1 Aggregate Model
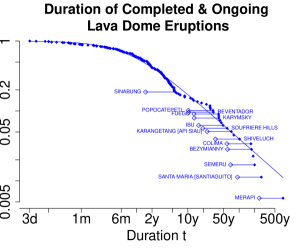
MLEs and SEs for the parameters of the aggregate GPa model without compositional dependence are and . Panel (a) of Figure (2) shows an empirical plot of fraction vs. duration on a log-log scale, along with the best model fit, for the volcanic eruptions in the dataset whose eruptive episode had ended by 15 March 2015 when the dataset was constructed. Panel (b) shows a similar plot for all eruptions, including the ones then ongoing, shifted forward by the median projected remaining duration (under the model) for an eruption already lasting duration years (marked with an empty diamond), to (filled diamond). In each plot both duration and the fraction with duration exceeding are displayed on logarithmic scales, so for large the model fit will be approximately a straight line with slope .
 |
 |
| (a) | (b) |
 |
 |
| (c) | (d) |
4.2 Grouped by Composition
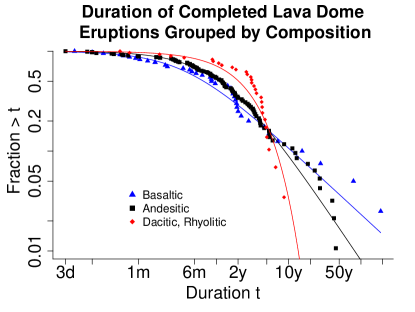
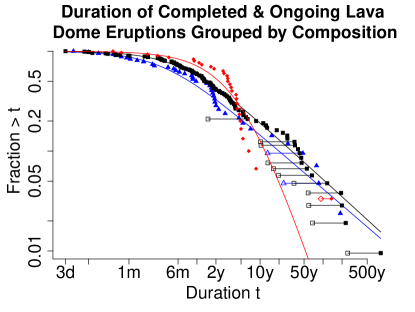
Bottom row of Figure (2) shows fits to data separated by magma composition into three classes: mafic, typically basaltic volcanoes; intermediate, including andesitic and basaltic andesitic volcanoes; and evolved systems, typically dacitic or rhyolitic volcanoes. Goodness-of-fit tests again show that Pareto models fit each of these well, while Exponential models (with one exception) do not. Exponential models offer a good fit to the twenty-nine completed dacitic/rhyolitic eruptions, all of which lasted less than ten years and twenty-six of which lasted less than five— suggesting falsely that the heavy-tailed Pareto distribution may be unnecessary. The thirtieth is the on-going eruption at the Santa María/Santiaguito volcano complex in Guatemala, whose 92-year-old duration to date confirms the heavy-tailed nature of duration distributions. For the 29 completed Dacite/Rhyolite eruptions we fit the simpler Exponential model, a limiting case of the for large and with . Model parameters for the and distributions are estimated separately within each class. Both the plots and the parameter estimates presented in Table 1 show that the duration distribution differs markedly by composition.
| Completed by 15 March 2015 | Completed & Ongoing | |||||||||
| Composition | # | SE | SE | # | SE | SE | ||||
| Basalt: | 40 | 0.6712 | 0.0540 | 0.3698 | 0.1272 | 42 | 0.5440 | 0.0390 | 0.2932 | 0.1002 |
| Andesite: | 94 | 1.0900 | 0.0540 | 1.2140 | 0.1738 | 105 | 0.5769 | 0.0180 | 0.5993 | 0.0746 |
| Dacite/Rhyolite: | 29 | 30 | 1.8920 | 0.3969 | 5.0440 | 1.9380 | ||||
4.3 A Log-linear Regression Model for Compositional Dependence
The generalized Pareto parameter estimates and in Table 1 vary strikingly and consistently across composition classes— each parameter increases with increasing silica content. This feature can be captured in the regression model
| (2) |
expressing log-linear dependence of the generalized Pareto distribution on the silica content , for new regression parameters . Such a model offers the advantage over the class-specific model of Section (4.2) that evidence from all eruptions can be used in generating forecasts for each volcano, even those whose composition class is rare (or absent) in the DomeHaz database. Parameter estimates for this model are , , , and , again showing that the generalized Pareto parameters depend on composition (because and are several SEs from zero). Because and are both positive, both the shape and scale parameters increase with increasing silica, by about and by about for each additional percent silica.
4.4 Which model is best?
The three models presented in Sections 4.1–4.3 have different degrees of complexity, with two free parameters for the Aggregate model, six for the Grouped model, and four for the Regression model. Two traditional approaches to model comparison are the Akaike information criterion, or “AIC” (Akaike 1974), and the Bayesian information criterion, or “BIC” (Schwarz 1978). Each favors models that fit the data better on a log-likelihood scale, and each penalizes models for complexity. The Grouped and Regression models were comparable using the AIC criterion (Grouped AIC, Regression AIC), and each out-performed significantly the Aggregate model (AIC). The BIC criterion, whose complexity penalties are more severe, favors the Aggregate model for its simplicity (Aggregate BIC, Regression BIC, Grouped BIC).
5 Forecasting: How much longer for Soufrière Hills and Sinabung?
In this section we present forecasts for the remaining length of two ongoing eruptions, the -year-long eruption at Soufrière Hills, Montserrat and the more recent one at Sinabung, Indonesia.
Under the generalized Pareto model , the th quantile of the remaining period of activity for an eruption already active for years is
| (3) |
The eruption at Soufrière Hills Volcano commenced in 1995 and had lasted days, about years, as of 15 March 2015, while that at Sinabung began in 2013 and had then lasted days. From Eqn (3) forecasts can be made for the median () and quartiles () of the distributions for their continued eruption durations, using and years and suitable values for the uncertain parameters , for these eruptions, based on the historical record of observed eruption durations of all volcanoes.
5.1 Maximum Likelihood Estimates
Table 2 presents MLEs for the quartiles and median remaining active time for the Soufrière Hills and Sinabung Volcanoes as of 15 March 2015, often called “plug-in” estimates because they are taken from (3) with replaced by their MLEs . Results are presented for three variations on our generalized Pareto model: one from the aggregate model of Section (4.1) with no compositional dependence, one for the grouped model of Section (4.2) basing each forecast on only the eruptions with similar composition, and one based on the four-parameter regression model of Section (4.3) with log-linear silica dependence. Data included both the completed eruptions (whose entire duration length is known) and the ongoing eruptions (for which only a lower bound on the duration length is known). Omitting long-lasting ongoing eruptions would distort the evidence by introducing a strong downward bias for estimates based only on completed eruptions.
| Soufrière Hills | Sinabung | |||||
|---|---|---|---|---|---|---|
| Model | ||||||
| MLE Aggregate: | 11.36 | 38.91 | 152.18 | 1.23 | 4.20 | 16.42 |
| MLE Grouped: | 13.10 | 47.10 | 203.68 | 1.35 | 4.87 | 21.06 |
| MLE Log Linear: | 10.54 | 35.21 | 131.02 | 1.18 | 3.94 | 14.65 |
| Bayes Log Linear: | 10.29 | 35.01 | 138.56 | 1.21 | 4.19 | 16.70 |
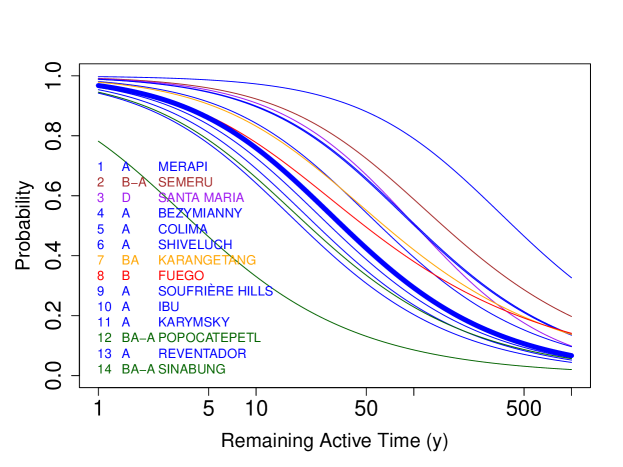
Projected remaining duration of all fourteen currently-active dome forming volcanoes, color-coded by composition, are given in Figure 3. Estimates are based on the regression model of Section (4.3), using the MLEs for the four model parameters.
5.2 Bayesian Posterior & Predictive Distributions
Plug-in forecasts based only on point estimates of the marginal probability that a new volcanic eruption will last longer than years or the conditional probability that an -year old volcanic eruption will continue at least more years, may be distorted because they ignore uncertainty about the parameters and . A Bayesian approach is more satisfactory here because it reflects fully both epistemic uncertainty about model parameter values and aleatoric uncertainty from the natural variability of the geologic processes. Our objective Bayes approach, using reference prior distributions (Bernardo 1979, Berger et al. 2009) rather than subjective priors, is described in Appendix A.4.
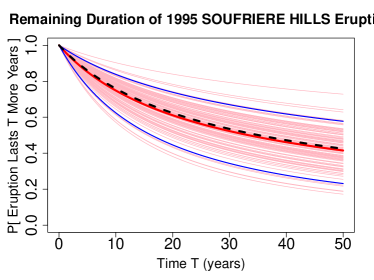
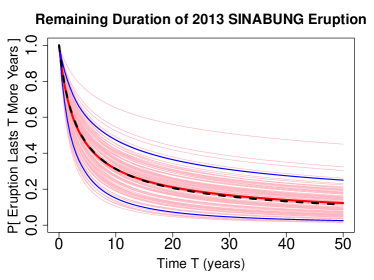
Objective Bayesian posterior quartiles for the remaining duration of eruptions at Soufrière Hills Volcano and Sinabung are presented in the bottom row of Table 2. Posterior predictive probabilities that these eruptions will continue for at least additional years are shown in Figure 4, for yr. The solid red line indicates overall posterior probability of continuing more years, while the width of the prediction interval (blue lines) indicates how uncertain that forecast is on the basis of available evidence. The plug-in estimate, shown as a dashed black line, is close to the mean but obscures the uncertainty.
Forecast probability that remaining duration at Sinabung exceeds ten years has a mean of 33.7%, with a wide 90% range of 17.8%–49.8%, while forecast probability that remaining duration at Soufrière Hills Volcano exceeds ten years has a mean of 75.5%, with a narrower 90% range of 64.8%–84.2%. The difference in width is attributable principally to the longer duration of the current eruption at Soufriére Hills.
The median projected remaining durations are years for Soufrière Hills Volcano and years for Sinabung. Thus, there is a 50:50 chance that each of these eruptions continue more (or less) than those respective spans. These forecasts may include extended quiescent periods of up to two years or more (see Section 2 for the criteria) and, in the case of Soufrière Hills Volcano, it is stressed that the forecast is conditional on the current (2015) quiescence being a pause and not already the onset of prolonged dormancy.
 |
 |
| (a) | (b) |
6 Discussion: Implications for physical eruptive processes
Although the statistical analysis undertaken here cannot provide direct indication of specific eruptive processes, the association found between composition and longevity can aid in constraining some aspects of those processes or indicating which kind of processes may be most important.
The relative contributions of shallow, conduit-level, processes versus deeper, magma chamber level, processes in the regulation of both extrusion periodicity and eruption duration for lava dome eruptions is tied to time-scales. Short time-scale patterns have been modeled as functions of shallow nonlinear conduit dynamics (Costa et al. 2007, Denlinger and Hoblitt 1999) whereas long time-scale patterns and eruption overall durations have generally been regarded as relating to magma rheology and deeper magma chamber conditions (Barmin et al. 2002, Melnik and Sparks 2005).
This study is focused on taking a longer-term view of eruptions, our definition of which may include non-extrusive phases where unrest continues. Consistent with earlier work (Sparks and Aspinall 2004) on individual dome extrusions, we find that eruption durations are heavy-tailed, with substantial drop-off in duration between 1–5 years. Sparks and Aspinall (2004) suggested that five years may be sufficient for the majority of conduits to mature and stabilize, and that conduit dynamics may control dome eruption longevity rather than gradual freezing of shallow magma. For short-term eruptions, their results and ours are comparable and thus we concur with their suggestion that conduit dynamics may control longevity for these. The longer duration eruptions we study, including unrest periods without extrusion, reflect longer-term system dynamics that are more likely regulated by the deeper magmatic system.
Further, this work demonstrates that eruption durations also vary by system composition— and, by extension, the combined effects of magma rheology, temperature, crystal content, etc. Figure 2 (c,d) shows that dome-forming eruptions predominantly occur at andesitic systems, and of those 76% do not continue for more than years (black squares). Evolved systems show an abrupt drop-off in eruption duration after years (red diamonds) whereas more mafic systems show earlier-onset decays, but slower duration drop-off rates (blue triangles). For evolved systems, this may reflect that these dome eruptions are modulated by shallow-level, conduit, processes but may also, importantly, reflect the fact that in some of these cases these evolved domes represent residual volatile-depleted melts as late-stage squeeze-ups following major explosive eruptions (Ogburn et al. 2015). In essence, many evolved lava domes are associated with already-depleted magma chambers— conditions which are less likely to be drivers of prolonged activity. The long-lived Santa María domes are an interesting exception to this, however. It has been suggested that the 1902 explosive eruption (compositionally related to the dome lavas) may have been shut down prematurely by collapse of edifice material into the vent region (Andrews 2014). The subsequent long-lived dome episodes are therefore not sourced from a depleted reservoir as is often the case with other evolved dome eruptions.
The slower decay of eruption duration for intermediate to mafic systems could reflect that more of these eruptions are modulated by deeper processes, a combination of deep and shallow processes, or that there is more variability within these systems.
Forecasting of likely remaining eruption durations is extremely valuable for hazard mitigation and risk management, especially for evacuation and longer term land-use planning. The present analysis has already allowed the USGS Volcano Disaster Assistant Program (VDAP) to provide information to the Indonesian Geological Agency that the Sinabung eruption would most likely continue for several more years, and thus has played a role in supporting decisions regarding long term management of evacuations (Pallister 2015).
7 Conclusions
Lava dome eruptions show continuous but heavy-tailed distributions that vary with composition. Eruption duration drivers may be dominantly modulated by the shallow processes (conduit) for evolved systems, whereas intermediate to mafic systems may have both shallow and deeper (chamber) signatures to them. The methodology developed here allows for comparison of survival curves for different ongoing eruptions as well as projected probability distributions for remaining durations for ongoing eruptions. The projections are based on evidence provided from a suite of 177 dome eruptions and synthesized in an objective Bayesian statistical model. This analysis illustrates the uncertainties, which are high but, most importantly, quantifiable. This work provides, for the first time, quantitative and transferable methods and rationale on which to base long-term planning decisions for lava dome forming volcanoes.
Appendix A Appendix: Generalized Pareto Model Calculations
This Appendix includes derivation of the likelihood functions for all three variations of the Bayesian generalized Pareto statistical model presented in Section 3, along with a description of our objective Bayesian prior distributions and a proof that the corresponding posterior distributions are proper. Also included as Table 3 is an ordered list of all dome-building volcanic eruptions in the DomeHaz database (Ogburn et al. 2012, v2.2) with duration five years or longer.
Under the generalized Pareto distribution , the survival function for the eruption duration of a new volcano is
| (4a) | |||||
| depending on two parameters: the dimensionless “shape” parameter , and the “scale” parameter , measured in years. The mean is if , or infinity if ; the median is for any . The remaining duration of a volcanic eruption that has already been in progress for years also has a generalized Pareto distribution, | |||||
| (4b) |
with the same shape parameter but an updated scale parameter: .
A.1 Likelihood I: No Compositional Dependence
The likelihood function for upon observing the exact (uncensored) eruption durations of some number of completed eruptions, and also the right-censored observations of the form “” from some number of eruptions that were still continuing at the time of data collection, is
where and are sets indexing the censored and non-censored eruptions, respectively. The negative log likelihood is
| (5) |
where for uncensored and for censored observations, and where is the number of uncensored observations and is the total number of observations.
A.2 Likelihood II: Grouped Compositional Dependence
A.3 Likelihood III: Regression Modeling of Compositional Dependence
The negative log likelihood function for the model of Eqn (2) in Section (4.3), in which the generalized Pareto parameters , are each log-linear functions of silica content for each eruption, can be expressed as:
| (6) |
where again is zero for censored and one for uncensored observations, and where and are the composition-specific parameters governing the duration of the th eruption, with silica content . The MLEs can now be found with a four-dimensional search over and or by a three-dimensional search over using the conditional MLE
where is the number of uncensored observations.
A.4 Objective Bayesian Estimates and Forecasts
Objective Bayesian independent reference prior distributions (Bernardo 1979, Berger et al. 2009) and were used for the model parameters, both improper scale-invariant distributions on . Posterior distributions are proper and have finite means and variances so long as (see below). Results were insensitive to these choices.
Bayesian posterior estimates of parameter values and duration forecasts based on this prior and the negative log likelihoods of Eqns (5, 6) are evaluated using the Metropolis-Hastings variation (Hastings 1970, Metropolis et al. 1953) of the Markov chain Monte Carlo simulation-based computational method (Besag et al. 1995, Gelfand and Smith 1990, Gilks et al. 1996, Tierney 1994). After an initial burn-in period of steps a further MCMC iterations were performed. MCMC samples were thinned at rate to eliminate measurable autocorrelation, leaving a sample of essentially independent and identically-distributed (iid) observations from the joint posterior distribution. Sample quantiles and moments from this sample are used to find interval and point estimates for the parameters, while evaluating Eqn (3) and Eqns(4a, 4b) along the MCMC sample gives the forecasts used to generate Figure (4) and the bottom row of Table 2.
Proof of Posterior Propriety
Fix and let and have independent Gamma prior distributions. Set and , each a function of . If the data include at least one uncensored observation (i.e., ) then and . As , and ; as , and .
The joint posterior probability distribution for has a density proportional to
Integrating wrt over gives the marginal posterior for :
Asymptotically this is
so posterior propriety will follow if either or , for integrability near , and either or , for integrability near . Posterior means and variances are finite if in addition or . In our application , so posteriors are proper and have finite means and variances even for our reference priors with .
| Duration | Start | Volcano | Duration | Start | Volcano |
|---|---|---|---|---|---|
| (years) | Year | Name | (years) | Year | Name |
| 5.0 | 1310 | OKATAINA | 16.2 | 1998 | IBU∗ |
| 5.4 | 1970 | KARANGETANG [API SIAU] | 18.5 | 1913 | COLIMA |
| 5.4 | 1870 | CEBORUCO, VOLCAN | 19.7 | 1995 | SOUFRIÈRE HILLS∗ |
| 5.4 | 1991 | SOPUTAN | 23.0 | 1972 | BAGANA |
| 5.4 | 1944 | SHIVELUCH | 23.7 | 1991 | KARANGETANG [API SIAU]∗ |
| 5.5 | 1951 | LAMINGTON | 27.0 | 1883 | BOGOSLOF |
| 6.0 | 1872 | SINARKA | 27.1 | 1796 | BOGOSLOF |
| 6.6 | 1980 | ST. HELENS | 27.6 | 1973 | LANGILA |
| 7.1 | 1994 | ETNA | 34.6 | 1980 | SHIVELUCH∗ |
| 8.6 | 1984 | LASCAR | 40.0 | 1869 | COLIMA |
| 8.7 | 1897 | DONA JUANA | 42.5 | 1968 | ARENAL |
| 10.2 | 2005 | POPOCATEPETL∗ | 45.0 | 1890 | VICTORY |
| 10.3 | 2004 | REVENTADOR∗ | 57.8 | 1957 | COLIMA∗ |
| 11.3 | 2000 | SOPUTAN | 59.4 | 1955 | BEZYMIANNY∗ |
| 12.4 | 1970 | KARYMSKY | 68.4 | 1946 | SEMERU∗ |
| 13.0 | 1973 | CHILLAN, NEVADOS DE | 78.8 | 1934 | SANGAY |
| 13.2 | 2002 | FUEGO∗ | 92.7 | 1922 | SANTA MARIA [SANTIAGUITO]∗ |
| 13.3 | 2001 | KARYMSKY∗ | 187.7 | 1728 | SANGAY |
| 15.4 | 1999 | MAYON | 246.6 | 1768 | MERAPI∗ |
Acknowledgments
All data used for this analysis were taken from the DomeHaz database (Ogburn et al. 2012). The authors would like to thank R. S. J. Sparks and W. P. Aspinall for helpful conversations, the staff of the Montserrat Volcano Observatory for hospitality and encouragement, and two anonymous reviewers for helpful suggestions. This work was supported in part by US National Science Foundation grants DMS–1228317, DMS–1228217, and EAR–0809543.
References
- Akaike (1974) Akaike, H. (1974), A new look at the statistical model identification, IEEE Transactions on Automatic Control, 19(6), 716–723, doi:10.1109/TAC.1974.1100705.
- Andrews (2014) Andrews, B. J. (2014), Magmatic storage conditions, decompression rate, and incipient caldera collapse of the 1902 eruption of Santa María Volcano, Guatemala, Journal of Volcanology and Geothermal Research, 282, 201–114, doi:10.1016/j.jvolgeores.2014.06.009.
- Barmin et al. (2002) Barmin, A., O. E. Melnik, and R. S. J. Sparks (2002), Periodic behaviour in lava dome eruptions, Earth and Planetary Science Letters, 199(1–2), 173–184, doi:10.1016/S0012-821X(02)00557-5.
- Bebbington (2007) Bebbington, M. S. (2007), Identifying volcanic regimes using hidden Markov models, Geophysical Journal International, 171(2), 921–942, doi:10.1111/j.1365-246X.2007.03559.x.
- Berger et al. (2009) Berger, J. O., J. M. Bernardo, and D. Sun (2009), The formal definition of reference priors, Ann. Stat., 37(2), 905–938, doi:10.1214/07-AOS587.
- Bernardo (1979) Bernardo, J. M. (1979), Reference posterior distributions for Bayesian inference (with discussion), J. Roy. Stat. Soc. B, 41(2), 113–147.
- Besag et al. (1995) Besag, J., P. J. Green, D. Higdon, and K. Mengersen (1995), Bayesian computation and stochastic systems (with discussion), Stat. Sci., 10(1), 3–66, doi:10.1214/ss/1177010123.
- Casella and Berger (1990) Casella, G., and R. L. Berger (1990), Statistical Inference, Duxbury Press, Belmont, CA.
- Coles (2001) Coles, S. G. (2001), An Introduction to Statistical Modeling of Extreme Values, Springer-Verlag, New York, NY.
- Costa et al. (2007) Costa, A., O. E. Melnik, R. S. J. Sparks, and B. Voight (2007), Control of magma flow in dykes on cyclic lava dome extrusion, Geophysical Research Letters, 34(L02303), 1–5, doi:10.1029/2006GL027466.
- Crosweller et al. (2012) Crosweller, H. S., B. Arora, S. K. Brown, E. Cottrell, N. I. Deligne, N. O. Guerrero, L. Hobbs, K. Kiyosugi, S. C. Loughlin, J. Lowndes, M. Nayembil, L. Siebert, R. S. J. Sparks, S. Takarada, and E. Venzke (2012), Global database on large magnitude explosive volcanic eruptions (LaMEVE), Journal of Applied Volcanology, 1(1), doi:10.1186/2191-5040-1-4, on-line at http://dx.doi.org/10.1186/2191-5040-1-4.
- Denlinger and Hoblitt (1999) Denlinger, R. P., and R. P. Hoblitt (1999), Cyclic eruptive behavior of silicic volcanoes, Geology, 27(5), 459–462, doi:10.1130/0091-7613.
- Gelfand and Smith (1990) Gelfand, A. E., and A. F. M. Smith (1990), Sampling-based approaches to calculating marginal densities, J. Am. Stat. Assoc., 85(410), 398–409, doi:10.2307/2289776.
- Gilks et al. (1996) Gilks, W. R., S. Richardson, and D. J. Spiegelhalter (Eds.) (1996), Markov Chain Monte Carlo in Practice, Chapman & Hall, New York, NY.
- Global Volcanism Program (2013) Global Volcanism Program (2013), Volcanoes of the World, vol. 4.4.1, Venzke, E. (ed.). Smithsonian Institution, doi:10.5479/si.GVP.VOTW4-2013.
- Gunn et al. (2014) Gunn, L. S., S. Blake, M. C. Jones, and H. Rymer (2014), Forecasting the duration of volcanic eruptions: an empirical probabilistic model, Bulletin of Volcanology, 76(780), 1–18, doi:10.1007/s00445-013-0780-8.
- Hastings (1970) Hastings, W. K. (1970), Monte Carlo sampling methods using Markov chains and their applications, Bometrika, 57(1), 97–109, doi:10.2307/2334940.
- Mastin et al. (2009) Mastin, L. G., M. Guffanti, R. Servranckx, P. Webley, S. Barsotti, K. Dean, A. Durant, J. W. Ewert, A. Neri, W. I. Rose, D. Schneider, L. Siebert, B. Stunder, G. Swanson, A. Tupper, A. Volentik, and C. F. Waythomas (2009), A multidisciplinary effort to assign realistic source parameters to models of volcanic ash-cloud transport and dispersion during eruptions, Journal of Volcanology and Geothermal Research, 186(1-2), 10–21, doi:10.1016/j.jvolgeores.2009.01.008.
- Melnik and Sparks (2005) Melnik, O. E., and R. S. J. Sparks (2005), Controls on conduit magma flow dynamics during lava dome building eruptions, Journal of Geophysical Research: Solid Earth, 110(B2), 1–21, doi:10.1029/2004JB003183.
- Metropolis et al. (1953) Metropolis, N. C., A. W. Rosenbluth, M. N. Rosenbluth, A. H. Teller, and E. Teller (1953), Equations of state calculations by fast computing machines, Journal of Chemical Physics, 21(6), 1087–1091, doi:10.1063/1.1699114.
- Newhall and Melson (1983) Newhall, C. G., and W. G. Melson (1983), Explosive activity associated with the growth of volcanic domes, Journal of Volcanology and Geothermal Research, 17(1-4), 111–131, doi:10.1016/0377-0273(83)90064-1.
- Ogburn et al. (2012) Ogburn, S. E., S. C. Loughlin, and E. S. Calder (2012), DomeHaz: Dome-forming eruptions database, on-line at https://vhub.org/resources/1742.
- Ogburn et al. (2015) Ogburn, S. E., S. C. Loughlin, and E. S. Calder (2015), The association of lava dome-growth with major explosive activity : DomeHaz, a global dataset, Bulletin of Volcanology, 77(40), doi:10.1007/s00445-015-0919-x.
- Pallister (2015) Pallister, J. S. (2015), personal communication.
- Rodado et al. (2011) Rodado, A., M. S. Bebbington, A. Noble, S. Cronin, and G. Jolly (2011), On selection of analog volcanoes, Mathematical Geosciences, 43(5), 505–519, doi:10.1007/s11004-011-9345-6.
- Schwarz (1978) Schwarz, G. E. (1978), Estimating the dimension of a model, Ann. Stat., 6(2), 461–464, doi:10.1214/aos/1176344136.
- Simkin (1993) Simkin, T. (1993), Terrestrial volcanism in space and time, Annual Reviews of Earth and Planetary Science, 21, 427–452, doi:10.1146/annurev.ea.21.050193.002235.
- Simkin and Siebert (1994) Simkin, T., and L. Siebert (1994), Volcanoes of the World: a Regional Directory, Gazetteer, and Chronology of Volcanism During the Last 10,000 Years, 2nd ed., Geoscience Press, Tucson, AZ.
- Simkin et al. (1981) Simkin, T., L. Siebert, L. McClelland, and D. Bridge (1981), Volcanoes of the World: a Regional Directory, Gazetteer, and Chronology of Volcanism During the Last 10,000 Years, 1st ed., Hutchison Ross, Stroudsburg, PA, USA.
- Sparks and Aspinall (2004) Sparks, R. S. J., and W. P. Aspinall (2004), Volcanic activity: Frontiers and challenges in forecasting, prediction and risk assessment, in The State of the Planet: Frontiers and Challenges in Geophysics, IUGG Monograph, vol. 19, edited by R. S. J. Sparks and C. J. Hawkesworth, pp. 359–373, AGU, New York, NY, doi:10.1029/150GM28, geophysical Monograph 150.
- Tierney (1994) Tierney, L. (1994), Markov chains for exploring posterior distributions (with discussion), Ann. Stat., 22(4), 1701–1762, doi:10.1214/aos/1176325750.
- Venzke et al. (2002) Venzke, E., R. W. Wunderman, L. McClelland, T. Simkin, J. F. Luhr, L. Siebert, G. Mayberry, and S. K. Sennert (Eds.) (2002), Global Volcanism, 1968 to the Present, Smithsonian Institute, Global Volcanism Program, global Volcanism Program Digital Information Series, GVP-4, on-line at http://www.volcano.si.edu/reports/.