A Fast Recommendation Algorithm for Social Tagging Systems : A Delicious Case
Abstract
The tripartite graph is one of the commonest topological structures in social tagging systems such as Delicious, which has three types of nodes (i.e., users, URLs and tags). Traditional recommender systems developed based on collaborative filtering for the social tagging systems bring very high demands on CPU time cost. In this paper, to overcome this drawback, we propose a novel approach that extracts non-overlapping user clusters and corresponding overlapping item clusters simultaneously through coarse clustering to accelerate the user-based collaborative filtering and develop a fast recommendation algorithm for the social tagging systems. The experimental results show that the proposed approach is able to dramatically reduce the processing time cost greater than and relatively enhance the accuracy in comparison with the ordinary user-based collaborative filtering algorithm.
keywords:
Recommender System , Social Tagging System , Tripartite Graph , Time Performance , Collaborative Filtering1 Introduction
How users interact with the Internet has evolved from the birth of Web 2.0. The convenience of storing, publishing and sharing contents results in an information overload for users when getting information which they are interested in. The recommender system, with the purposes of improving user experiences and helping users to get information suited to their interests, is one of the commonest modules in the web application. An increasingly influential set of websites such as Delicious, Flickr, Youtube and LinkedIn provide the users with the service to tag the items such as URL links, movies, photos, etc. The information given by tags reveals users’ interests, depicts the items more precisely and provides more opportunities and resources for data analysis and knowledge discovery. It is wisdom for us to exploit the abundant information of tags to recommend interesting items to the users in the social tagging applications.
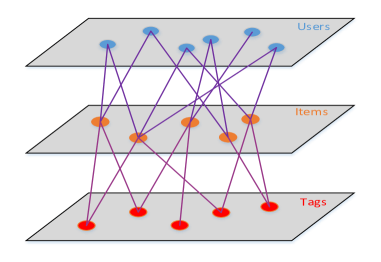
Although different applications of social tagging systems have different items, they all allow people to store and share the interesting contents and can be modeled as tripartite graphs. Thus, the tripartite graph is one of the commonest topological structures in the social tagging systems which have three types of nodes. In the social tagging applications, the nodes stand for users, items and tags, and users are interested in some kinds of items which are attached with different tags. Figure 1 illustrates the modeled topological structure of the social tagging systems.
The recommender systems have been well studied in the previous research in [1, 2, 3, 4, 5, 6, 7]. At the same time, much effort has been made in the studies of social tagging systems in both structure domain and algorithm domain in [8, 9, 10, 11]. The main challenges of constructing a personalized recommender system for the social tagging applications are as follows:
-
1.
Large volume of data. In the online social tagging systems, there are enormous amount of users, items and tags. To analyse the data with the purpose of developing a recommender system to improve the user experiences brings high requirements on computational capabilities, and the time performance of the algorithm need to be outstanding.
-
2.
Diversity and novelty of items and tags. There are various types of items and tags in the social tagging systems such as Delicious and Youtube. It is rarely easy to get the semantics of the items and tags. The challenges to understand the semantics may bring about noisy and inaccuracy models [12, 13].
-
3.
Timeliness. The online applications produce enormous amount of data continuously. It is necessary to construct models which are fast enough to avoid being overwhelmed with tremendous new information. If the processing time of a model is too long, the results of the model can not be used because of the timeliness problem.
-
4.
Data sparseness. In the real-world social tagging applications, there are users who have few store actions and share actions, moreover, many items are just be concerned few times. Considering this kind of data into the user modeling methods can result in inaccuracy models and slow down the algorithm [13, 14].
- 5.
In this paper, we address some of the above challenges (e.g., timeliness and data sparseness) by proposing a fast collaborative user model (FCUM) which accelerates the ordinary user-based collaborative filtering (UCF) without accuracy loss. And we demonstrate the performance of FCUM by an experimental evaluation on one real-world dataset which is crawled from the famous Delicious. In the following paragraphs, we introduce the FCUM and acceleration method briefly, more details are in the following sections.
Fast Collaborative User Model. The items stored, tagged and shared by users can provide rich information of the users’ interests, moreover, the tags can also reveal the interests of the users. In the FCUM, we exploit the information from both the items and the tags. Actually, if we conduct the recommendation procedure by using the information from all users, the UCF model will be noisy and will bring about high requirements on computational capabilities. Therefore, we extract non-overlapping user clusters and corresponding overlapping item clusters simultaneously and construct the FCUM. In the experiment, we first get the scores of the items which stand for how much the users like the items according to the behaviors of other users in the same cluster. Then a rank procedure is conducted, and we recommend the items to users in each cluster according to the ranklist. Finally, we evaluate the FCUM in the aspects of accuracy and time performance. Moreover, the conducted contrastive experiments will be depicted later.
Acceleration Method. As mentioned above, we extract non-overlapping user clusters and corresponding overlapping item clusters simultaneously to construct the FCUM for recommending items to users. In this way, we just need to conduct the UCF in the clusters separately that accelerates this ordinary algorithm. During this procedure, we use a K-means-like approach to extract these clusters. First, the users are averagely and randomly distributed to clusters. Then, we update the centroid of each cluster and redistribute the users in each cluster to clusters in terms of the similarities of users and the centroids of clusters. We just iterate this procedure less times and will not wait for the convergence. Finally, the non-overlapping user clusters and corresponding overlapping item clusters are obtained respectively. This coarse clustering procedure separates the useful information from the noise (i.e., redundant information) in the FCUM and accelerates the following UCF.
The rest of the paper is organized as follows: Section 2 gives out the details of the FCUM which is the foundation of the fast recommendation algorithm. And, section 3 presents the design of our experiments on the Delicious dataset. Then, section 4 shows the results of the experiments and the evaluation indicators of the FCUM from many aspects. Finally, in Sec. 5, we conclude our findings and give out what we will do in the future.
2 Fast Collaborative User Model
Collaborative filtering has successfully been applied in recommender systems in [1, 3, 4]. In this subsection, we will comprehensively introduce the FCUM derived from collaborative filtering, which is an important module of the recommender system for a social tagging application.
A social tagging system has various of users, items and tags. The behaviors of the users, including resource usages and annotation actions in the applications, can be represented as the user-item-tag triple form. The recommender systems for the social tagging applications have been studied in [18, 19, 20]. The main idea of this paper is to construct a FCUM that is fast and accurate enough for the recommendations in social tagging applications. In the following paragraphs, we will give out the basic notations used in this paper.
As shown in Fig. 1, the social tagging system is denoted as a tripartite graph,
| (1) |
where , , stand for the finite sets of users, items and tags, and , and (which is projected straightforward from the original graph) describe the finite sets of the edges between users and items, items and tags, users and tags. In the real-world online social tagging systems, the graphs are very sparse.
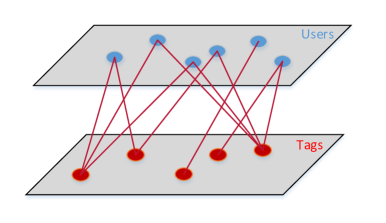
In the aspect of the users, the tripartite graph can be projected into two bipartite graphs, which can be denoted as the user-item bipartite graph and the user-tag bipartite graph:
| (2) |
| (3) |
Thus, the users can be characterized by the resource usage information (e.g. items) and the annotation action information (e.g. tags). The projected bipartite graphs are illustrated in Fig.2(a) and Fig.2(b), respectively.

In other words, the interests of a user can be represented as two vectors: the user-item vector and the user-tag vector. The user-item vector can be denoted as:
| (4) |
where represents the characteristic of user in the aspect of the items, represents the total number of the items and the is as follow:
| (5) |
Similarly, the user-tag vector can be denoted as:
| (6) |
where represents the characteristic of user in the aspect of the tags, represents the total number of the tags and the is as follow:
| (7) |
The item nodes and the tag nodes can be modeled in the same way above. Although the FCUM is general purpose for arbitrary tripartite graphs, in this paper, we just concentrate on the characteristics of the users and recommend the items to the users. This model can be easily extended and the framework of the fast recommendation algorithm for social tagging systems is illustrated in Fig.3.

2.1 Similarity
Memory-based collaborative filtering techniques (e.g. UCF) and clustering algorithms rely on the notion of similarity between pairs of users [1, 3, 21]. The similarity between user and user can be represented through many kinds of similarity measures, such as Pearson correlation coefficient [1], cosine similarity [1, 3, 21] and Euclidean distance [21]. In [21, 22], the influence of the high dimensional and sparse data to the Euclidean distances has been studied. They found that when the data is high dimensional and sparse, its Euclidean distances seem to concentrate and all the Euclidean distances between pairs of data elements seem to be very similar. Moreover, the Pearson correlation coefficient is more suitable for scoring systems rather than tagging systems. Herein, the cosine similarity is used and described as:
| (8) |
Both the resource usages and annotation actions can reveal the interests of the users in the social tagging systems. In this paper, we jointly take into account the resource usages and annotation actions to calculate the similarity of two users. It is computed as:
| (9) |
where is a parameter ranging from 0 to 1. Therefore, we evaluate the similarity of two users by means of improved cosine similarity in Eq.(9). In the FCUM, the value of is set as 0.5 due to the fact that these two types of cosine similarities follow a similar distribution in the Delicious dataset.
2.2 Cluster Extraction
The most crucial part of the FCUM is cluster extraction. In order to accelerate the following UCF, we need to extract useful information from massive data in the social tagging applications. In this subsection, we will introduce the extracting procedure in details and give out its pseudo-code.
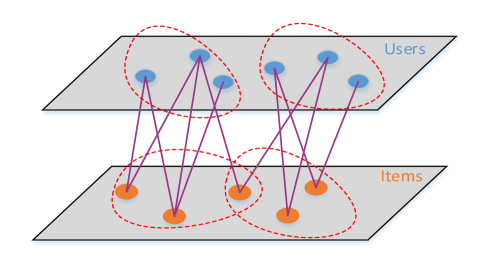
Clustering algorithms are involved in many different domains, which are used to detect the clusters in social tagging systems in [10, 14], to handle image segmentation in [23], to extract the social dimension in [24], etc. In the FCUM, a coarse clustering algorithm, whose similarity measure is based on Eq.(9), is used to extract useful information to accelerate the recommendation procedure without accuracy loss. It partitions the users in the social tagging applications into non-overlapping clusters, consecutively, the items are also divided into corresponding overlapping clusters. Figure 4 illustrates a visual view of the result.
For the coarse clustering algorithm, its steps are similar to those in the K-means approach. The purpose of the cluster extraction procedure is not to obtain convergent user/item clusters of the social tagging systems but to extract only part of the user/item information for accelerating the following UCF. Therefore, it is unnecessary to make the algorithm iterate to convergence. More concretely, look back into the K-means approach [25, 26, 27], the first step is that distributing the nodes to arbitrary clusters, and the second one, which will be iterated many times to a convergent result, is to calculate the centroid of each cluster and redistribute each node to a new cluster based on the similarity of the node and the centroid. In the present work, for the second step, it only needs to set a low iteration times to coarsely cluster these users and items. The experimental results (more details presented in Sec. 4) show that this operation (even set the iteration times as 2) rarely affect the accuracy evaluation indicators of the recommender system. In this way, we accelerate the procedure of cluster extraction.
To keep our description of K-means-like approach much more self-contained, we show a comprehensive operating process. Let be the number of the user clusters, and represents the user cluster whose index is . It has been known that each user is characterized as two vectors in Eq.(4) and Eq.(6). The centroid of each user cluster includes two parts:
| (10) |
| (11) |
where stands for the number of users in the user cluster . Then, the similarity between the user and corresponding centroid is computed as:
| (12) |
where is a parameter ranging from 0 to 1. Due to the fact that the and the follow similar distributions, is set as 0.5. On this basis, we extract the non-overlapping user clusters and corresponding overlapping item clusters (i.e., each item cluster is constrained by the user-item bipartite graph, which brings that some of items overlaps in different clusters).
Algorithm 1 illustrates the pseudo-code. It is necessary to point out that the time complexity of Algorithm 1 is where stands for the number of iteration times, represents the number of user clusters, and , , are the number of users, items and tags. In the following, the procedure of UCF is only conducted to recommend items in (item cluster) to the associated users in (user cluster), which extremely accelerate the recommendation process.
2.3 User Based Collaborative Filtering
The UCF has been used to recommend movies, songs, jobs, books and other products in the e-commercial systems, online social systems and other types of online applications [1, 2, 3]. In this procedure, each user obtains an item ranklist, in which he likely tends to store, tag and share the top items. To rank the items, the score function is denoted as follows:
| (13) |
| (14) |
After the calculation, we sort the scores and get the ranklist for every user. Because a higher score represents that a user is more likely to store, tag and share the item, we recommend the item with a higher user specific score to the user.
In addition, the time complexity of the UCF is , where , , and represent the number of users, items and tags, respectively. However, In the FCUM, the time cost can be represented as , where stands for the number of users in the th user cluster, denotes the number of items in the th item cluster, and is the number of tags which are associated with the users in the th user cluster. Obviously, due to the fact that , the time cost of the proposed algorithm is less than that of the ordinary one even including the time cost of the coarse clustering procedure.
2.4 Extending model
In this paper, we propose the foundation of the FCUM that only uses the information from resource usages and annotation actions to construct the model. However, in the real-world social tagging applications, we can get information from user profiles, explicit user relationships, as well as implicit relationships among the users and items such as the situations that two users both click one link but do not tag it or the IP addresses of two users are located in the same city. These features are able to be represented in the vector forms like Eq.(4) and Eq.(6), then add them to the FCUM. Thus, the similarities among users can be extended as:
| (15) |
| (16) |
where is the number of feature vectors, is the -th feature vector of user , and is the parameter ranging from 0 to 1. Similarly, in the cluster extraction procedure introduced in Sec. , the centroid of each cluster can be represented as vectors. Thus, it is able to construct a hybrid FCUM[28].
3 Experimental Design
3.1 Evaluation Indicators
To evaluate whether the recommended items meet the users’ interests based on the FCUM, we divide the available dataset into training and testing subsets according to the timestamps. And, three common evaluation indicators, recall, precision and F1-score, are described respectively [3]:
| (17) |
| (18) |
| (19) |
where is the ranklist (i.e., recommendation list) length, is the finite set of items recommended to user , is the test set for user . The recall describes the true positive rate, the precision is referred to the positive predictive value, and F1-score combines the recall and the precision into the harmonic mean.
3.2 Dataset and Platform
In the real-world social tagging systems, the tripartite graphs are usually sparse. It suggests that many users have only few resource usages and annotation actions, and many items are stored, tagged and shared only few times. Thus, the accuracy and time performance will be obviously influenced. Before conducting experiment, a pre-process is done for the original dataset.
The original dataset is crawled from a real-world social tagging system, Delicious. It contains 1867 users, 69226 URLs (items), 53388 tags, and 437595 user-URL-tag triples. In the pre-process, we filter out the user nodes, resource nodes, tag nodes, whose degrees are lower than a threshold by iteratively removing these nodes and edges from the graph. For example, when the threshold equals to 5, there are 1617 users, 21983 URLs, 5301 tags and 236659 user-URL-tag triples in the filtered graph. Note that we also consider other thresholds in the following experiments. After that, according to the timestamp, the filtered dataset is divided into 80 training subset and 20 testing subset in terms of the user-URL-tag triples. Moreover, in this procedure, we make sure that every user is in the testing subset. Table 1 is characterized by the number of users, URLs, tags and user-URL-tag triples in the training set, in the testing set as well as in total.
The experimental platform is a notebook computer with 4 AMD A10-4600M APU cores and 4GB DRAM. Its operating system is ArchLinux with a linux kernel of 4.1.5. We use g++ 5.2.0 with compiler optimization level.
| users | URLs | tags | user-URL-tag triples | |
| training set | 1617 | 20338 | 5299 | 188671 |
| testing set | 1617 | 8055 | 4758 | 47988 |
| total | 1617 | 21983 | 5301 | 236659 |
| indicators | UCF | |||||
|---|---|---|---|---|---|---|
| 0.11916 | 0.11676 | 0.11197 | 0.11324 | 0.11524 | 0.11146 | |
| 0.05244 | 0.05071 | 0.04799 | 0.04836 | 0.05022 | 0.0491 | |
| 0.07283 | 0.07071 | 0.06718 | 0.06778 | 0.06995 | 0.06817 | |
| 0.14772 | 0.14536 | 0.14341 | 0.14367 | 0.14441 | 0.14268 | |
| 0.03822 | 0.03643 | 0.0363 | 0.03618 | 0.03643 | 0.03599 | |
| 0.06073 | 0.05825 | 0.05794 | 0.0578 | 0.05818 | 0.05748 | |
| 0.16099 | 0.16033 | 0.15899 | 0.15825 | 0.15863 | 0.158 | |
| 0.03051 | 0.03039 | 0.02985 | 0.02964 | 0.02997 | 0.02956 | |
| 0.0513 | 0.05109 | 0.05026 | 0.04993 | 0.05042 | 0.0498 | |
| 0.16829 | 0.16751 | 0.16709 | 0.16673 | 0.1667 | 0.1676 | |
| 0.02557 | 0.02548 | 0.02514 | 0.02523 | 0.02536 | 0.02566 | |
| 0.0444 | 0.04423 | 0.0437 | 0.04383 | 0.04402 | 0.04451 |
4 Results and Discussion
In order to achieve the extraction of non-overlapping user clusters and corresponding overlapping item clusters during a relatively short time, the iteration times is set no more than 10. Moreover, the degree threshold mentioned in Sec. equals to 5 in terms of the sparseness of the graph. Firstly, we explore the influence of the iteration time on the the evaluation indicators of the recommender system. In the cluster extraction procedure, the average number of users in each cluster is 90, which roughly fixes initial 18 clusters. Note that the initially random allocation of users to each cluster is insensitive to the experimental results (see in Fig.6). For iteration number from n=2 to n=10 (step length 2), three evaluation indicators of the recommender system are computed restricted to ranklist length and in the comparison of UCF, which are illustrated in Tab. 2 and in Fig.5.
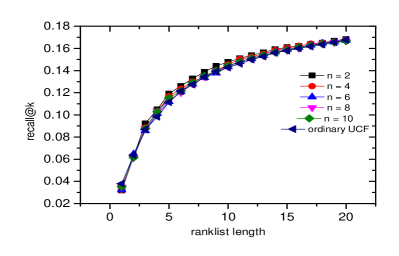
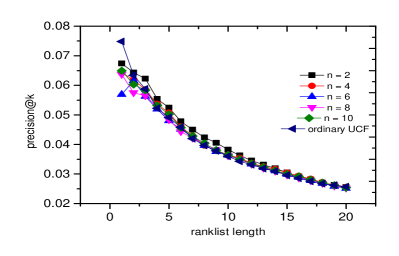
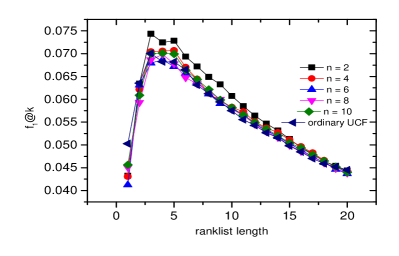
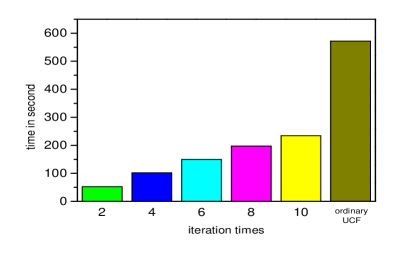
More concretely, in Tab. 2, it can be found that these evaluation indicators are insensitive to the iteration time , suggested by their similar values in restricted to the ranklist length, and our model doesn’t weaken the accuracy of the recommendation system in a comparison of the UCF (more details shown in Fig.5). More importantly, when the iteration time equals to 2, the statistical averages of these evaluation indicators show that the FCUM have a relatively better accuracy (see in Fig.5(a)-(c)) when the ranklist length ranges from 3 to 19, and the time performance is significantly better than the UCF (see in Fig.5(d)), that is, the time cost is reduced greater than 90. Furthermore, the comprehensive analysis of these evaluation indicators in Fig.5 shows that the recall increases and precision decreases as a function of the ranklist length, which makes the F1-score be optimal when the ranklist length is 3.
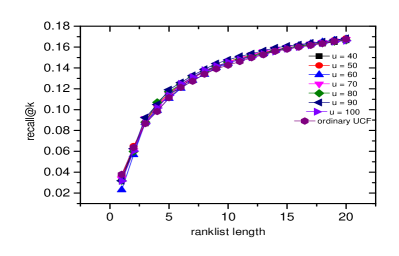
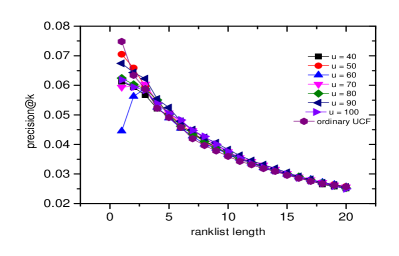
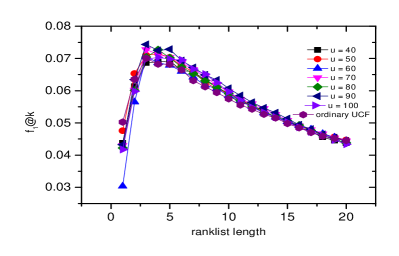
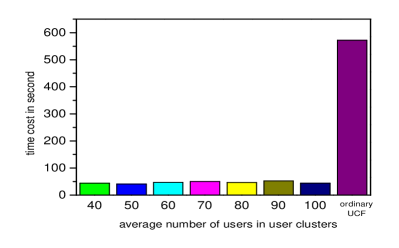
As mentioned in above analysis, we set the average number of users in each cluster to 90 and obtain the initial number of clusters. It is well known that the initial number of clusters to some extent affect the final result when cluster procedure converges. Actually, it is unnecessary to make clustering procedure finally converge in the FCUM, thus we don’t care about its convergent result, but only concentrate on the performance of the recommender system. Nevertheless, to keep the study self-contained, we still perform experiments that whether the average number of users in each cluster finally affect these evaluation indicators. Herein, when the iteration time and degree threshold is 2 and 5 respectively, we adjust the average number of users in each cluster from 40 to 100 with the step equalling 10 and independently conduct each experiment. Figure 6 shows that the average number of users in each cluster is also a trivial factor affecting these evaluation indicators which are suggested by their similar values in restricted to the ranklist length, as well as the lower time cost in a comparison of the UCF. Through these experiments, we demonstrate that the FCUM not only strongly enhances the efficiency, but also relatively improves the accuracy of the recommender system.
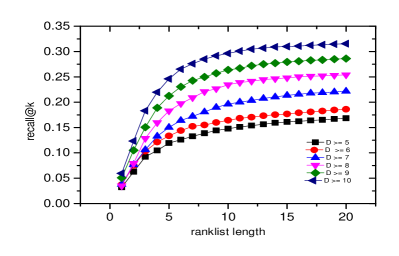
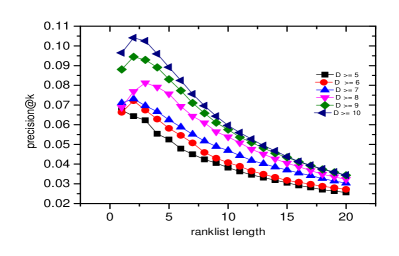
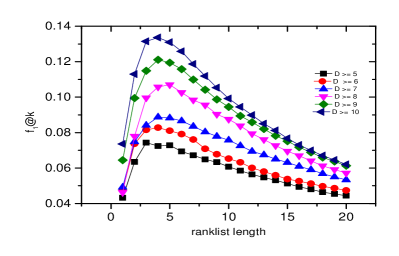
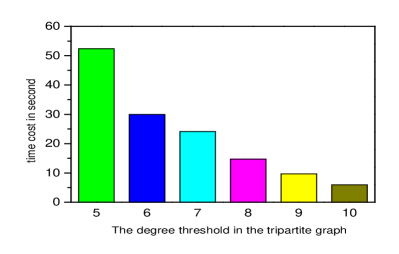
In addition, in the preprocess procedure, we take account of the data sparseness of the social tagging system (or tripartite graph) and the degree threshold of each node. Thus, It is worthy to discuss whether the different degree thresholds change the result in the FCUM. We further increase the degree threshold from 6 to 10, and obtain these filtered tripartite graphs. According to the initial condition setting and , a number of contrastive experiments are performed based these filtered tripartite graphs, whose results are shown in Fig.7. It can be found that with the increment of the degree threshold, the evaluation indicators of the recommendation algorithm become better. However, in these situations, only the high degree nodes are considered and it aggravates the cold start problem. In a real-world recommender system, we need to make a trade-off among the cold start problem, the accuracy of the model and the time complexity, it’s application dependent, we just give out a hint and the discussion of these issues is far beyond this paper.
5 Conclusion
In this paper, we propose a fast and elegant collaborative user model based on cluster extraction to recommend items to users in social tagging systems. And the cluster extraction is insensitive to the parameters such as the iteration time and initial number of clusters. The extensive experiments demonstrate that the recommendation algorithm based on this model behaves much more efficiently due to the fact that the time cost is dramatically reduced greater than 90, and relatively accurately in the comparison of UCF. Moreover, it exploits both the information of the resource usages and annotation actions, and can be extended to use more information which can be represented as vectors extracted from the social tagging applications. As relevant issues for future work, we plan to characterize each user in the social tagging systems not only by the information of resource usages and annotation actions, but also explore the explicit or implicit relationships between users such as their personal attributes, friend relationships, follow relationships, which help for improving the performance of recommender system.
Acknowledge
This work is partially supported by the National Natural Science Foundation of China (Grant Nos. 61370150 and 61433014) and Special Project of Sichuan Youth Science and Technology Innovation Research Team (Grant No. 2013TD0006).
References
References
- [1] G. Adomavicius and A. Tuzhilin. Toward the Next Generation of Recommender Systems: A Survey of the State-of-the-Art and Possible Extensions. IEEE Transactions on Knowledge and Data Engineering, 17(6), 734-749, 2005.
- [2] F. Aiolli. Efficient Top-N Recommendation for Very Large Scale Binary Rated Datasets. In RecSys’13, 2013, Hong Kong, China.
- [3] D. Bernardes, M. Diaby, et al. A Social Formalism and Survey for Recommender Systems. ACM SIGKDD Explorations, 16(2), 20-37, 2015.
- [4] Y. Shi, M. Larson, et al. Collaborative Filtering beyond the User-Item Matrix: A Survey of the State of the Art and Future Challenges. ACM Computing Surveys, 47(1), 3:1-3:45, 2014.
- [5] J. Bobadilla, F. Ortega, et al. Recommender Systems Survey. Knowledge-Based Systems. 46, 109-132, 2013.
- [6] Y. Guan, S. M. Cai, et al. Rcommendation Algorithm Based on Item Quality and User Rating Preferences. Frontier of Computer Science, 8(2), 289-297, 2014.
- [7] W. Zeng, A. Zeng, et al. Uncovering the Information Core in Recommender Systems, Scientific Reports, 4, 6140, 2014.
- [8] R. Schenkel, T. Crecelius, et al. Efficient Top-k Querying over Social-Tagging Networks. In SIGIR’08, 2008, Singapore.
- [9] N. Ifada and R. Nayak. Tensor-based Item Recommendation using Probabilistic Ranking in Social Tagging Systems. In WWW’14 Companion, 2014, Seoul, Korea.
- [10] D. Ramage and P. Heymann. Clustering the Tagged Web. In WSDM’09, 2009, Barcelona, Spain.
- [11] C. L. Huang, P. H. Yeh, et al. Utilizing User Tag-based Interests in Recommender Systems for Social Resource Sharing Websites. Knowledge-Based Systems, 56, 86-96, 2014.
- [12] T. Zhou, Z. Kuscsik, et al. Solving the Apparent Diverity-Accurary Dilemma of Recommender Systems, Proceedings of the National Academy of Science USA, 107(10), 4511-4515, 2010.
- [13] J. Vosecky, K. W. Leung, et al. Collaborative Personalized Twitter Search with Topic-Language Models. In SIGIR’14, 2014, Gold Coast, Queensland, Australia.
- [14] C. Lu, X. Chen, et al. Exploit the Tripartite Network of Social Tagging for Web Clustering. In CIKM’09, 2009, Hong Kong, China.
- [15] E. Martins, F. Belém, et al. Measuring and Addressing the Impact of Cold Start on Associative Tag Recommenders. In WebMedia’13, 2013, Salvador, Brazil.
- [16] A. I. Schein, A. Popescul, et al. Methods and Metrics for Cold-Start Recommendations. In SIGIR’02, 2002, Tampere, Finland.
- [17] N. Mirbakhsh and C. X. Ling. Improving Top-N Recommendation for Cold-Start Users via Cross-Domain Information. ACM Transactions on Knowledge Discovery from Data, 9(4), 33:1-33:19, 2015.
- [18] C. Chelmis and V. K. Prasanna. Exploring Generative Models of Tripartite Graphs for Recommendation in Social Media. In MSM’13, 2013, Paris, France.
- [19] J. Peng, D. Zeng, et al. Collaborative Filtering in Social Tagging Systems Based on Joint Item-Tag Recommendations. In CIKM’10, 2010, Toronto, Ontario, Canada.
- [20] Z. K. Zhang, T. Zhou, et al. Personalized Recommendation via Integrate Diffusion on User-Item-Tag Tripartite Graphs. Physica A, 389(1), 179-186, 2010.
- [21] A. Nanopoulos, M. Radovanović, et al. How Does High Dimensionality Affect Collaborative Filtering? In RecSys’09, 2009, New York, USA.
- [22] D. François and V. Wertz. The Concentration of Fractional Distances. IEEE Transactions on Knowledge and Data Engineering, 19(7), 873-885, 2007.
- [23] N. A. M. Isa, S. A. Salamah, et al. Adaptive Fuzzy Moving K-means Clustering Algorithm for Image Segmentation. IEEE Transactions on Consumer Electronics, 55(4), 2145-2153, 2009.
- [24] L. Tang and H. Liu. Toward Predicting Collective Behavior via Social Dimension Extraction. IEEE Intelligent Systems 25(4), 19-25, 2010.
- [25] A. K. Jain, M. N. Murty, et al. Data Clustering: A Review. ACM Computing Surveys, 31(3), 264-323, 1999.
- [26] T. Kanungo, D. M. Mount, et al. An Efficient k-Means Clustering Algorithm: Analysis and Implementation. IEEE Transactions on Pattern Analysis and Machine Intelligence. 24(7), 881-892, 2002.
- [27] H. Kriegel, P. Kröger, et al. Clustering High-Dimensional Data: A Survey on Subspace Clustering, Pattern-Based Clustering, and Correlation Clustering. ACM Transactions on Knowledge Discovery from Data, 3(1), 1:1-1:58, 2009.
- [28] X. Jin, C. Wang, et al. LikeMiner: A System for Mining the Power of ’Like’ in Social Media Networks. In ACM SIGKDD’11, 2011, San Diego, California, USA.