Many flavor approach to study the critical point in finite density QCD
Abstract:
We discuss the QCD critical point at finite density through the study of many flavor QCD, in which two light flavors and massive flavors exist. Performing simulations of QCD with two flavors of improved Wilson fermions, we calculate the probability distribution function of a generalized plaquette in many flavor QCD at finite temperature and density. The dynamical effects of massive flavors and the chemical potential are incorporated using the reweighting technique. From the shape of the distribution functions, we determine the critical surface separating the first order transition and crossover regions in the parameter space of the light and massive quark masses and the chemical potentials. It is found that the critical massive quark mass becomes larger as the chemical potential increases in the flavor QCD. The indication to the (2+1) flavor QCD is then discussed.
1 Introduction
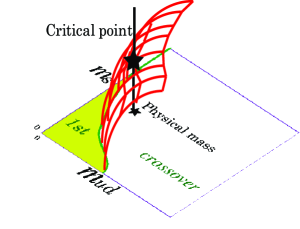
One of the most interesting topics among the study of QCD is to find the critical point at finite temperature and density. While the chiral phase transition at the physical quark masses is considered to be crossover at low density, it is expected to change into a first order transition at the critical density. Since the study in the high density region is difficult because of the sign problem, it will be important to investigate the boundary of the first order transition at low density in the quark mass parameter space of (2+1) flavor QCD, using the property that the nature of the transition changes also with the quark mass. From the information about the boundary of the first order region, it may be possible to extrapolate the boundary to the high density region for the determination of the critical point in the real world. The standard expectation of the critical surface is illustrated in the left panel of Fig. 1 as a function of the light quark mass , the strange quark mass and the chemical potential . The critical surface is indicated by the red curves. The light quark side is the first order region and the heavy quark side is the crossover region. The black line represents physical quark mass. Recent lattice QCD studies suggest that the first order region near the massless limit is very small at zero density. Hence, the determination of the critical surface may be difficult.
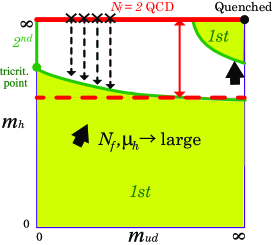
In this paper, we study a system in which two light quarks and heavy quarks exist. Performing simulations of QCD with two flavors of improved Wilson fermions, we determine the boundary of the first order region in many flavor QCD at finite temperature and density. The reweighting technique is used together with a hopping parameter expansion to incorporate the dynamical effects of massive flavors and the chemical potential. To use the hopping parameter expansion, the hopping parameter, i.e. the inverse quark mass, must be small. In Ref. [1], the critical heavy quark mass is found to increase as increases and the endpoint of the first order transition can be investigated in the heavy quark region, where the hopping parameter expansion works well, for large . We illustrate the quark mass dependence of the nature of phase transitions in Fig. 1 (middle) for (2+) flavor QCD, where and are the masses of light flavors and flavors. The yellow regions are the first order regions and the green curves are the second order critical lines. Moreover, we will show in this paper that the critical increases as increases. This suggests that we may deal with the critical curve even for (2+1) flavor in the case that the critical mass is heavy at large . Through the study of flavor QCD, we discuss the QCD critical point at finite density.
In the next section, we explain a histogram method to identify the nature of the phase transitions. We then show our numerical results about the boundary of the first order phase transition at finite density in Sec. 3. The conclusions are given in Sec. 4.
2 Histogram method
We study the system where two light flavors and degenerate heavy flavors. The hopping parameter and the quark chemical potential are , for the light flavor and , for the heavy flavor, respectively. To investigate the nature of phase transitions, we consider the probability distribution function of the average plaquette,
| (1) |
where is the quark matrix, is the number of sites, and is the coupling constant. is defined from the gauge action as and is called the generalized plaquette. is the delta function, which constrains the operator to . We use the delta function approximated by , where is adopted in this study. For convenience, we define the effective potential as . It is rewritten as
| (2) |
with the potential of two flavor at , , and
| (3) |
where . means the ensemble average over two flavor configurations generated at , and vanishing . may differ from .
We evaluate the quark determinant of flavors in with the leading order of the hopping parameter expansion for the standard Wilson action [2].
| (4) |
where and are the real and imaginary parts of the Polyakov loop. This approximation is valid when is small or the quark is heavy. Note that no expansion in terms of is performed. On the other hand, the quark determinant of light flavors is computed by a Taylor expansion in terms of [3, 4, 5], i.e.
| (5) |
Because the sign problem is serious for the calculation of at high density, the method discussed in Ref. [4, 5] is used to avoid the sign problem,
| (6) |
where and is the complex phase of . In this analysis, we assume that the distribution of is well approximated by a Gaussian function and the higher order cumulants can be neglected.
The first term of Eq. (4) that is proportional to can be absorbed into the gauge action by shifting . The reweighting factor is written as for , for example, with
| (7) |
where . depends on the parameters only through , and . The second term is the complex phase of the reweighting factor, which is proportional to . Because is smaller than one, the dependence can be easily controlled [2].
We then find the critical , at which the first order transition terminates, instead of the critical . At a first order transition point, shows a double-well shape as a function of , and equivalently the curvature of the potential is negative around the center of the double-well potential. Moreover, the curvature is independent of , since appears only in the linear term of in the right hand side of Eq. (3). Although must be adjusted to the first order transition point to observe the double-well potential, the fine tuning is not necessary if we investigate the curvature [4]. Hence, we investigate the curvature of the potential and find the boundary of the first order phase transition. The curvature is given by
| (8) |
The curvature of the two flavor effective potential can be estimated from the relation between the plaquette susceptibility and the curvature of the potential,
| (9) |
assuming the Gaussian distribution. Because the finite temperature transition is crossover for two flavor QCD with finite quark mass, the distribution function is expected to be Gaussian. The second derivative is computed by fitting the data of to a sixth degree function. After finding the critical for each , and , we determine the critical from the equation .
3 Chemical potential dependence of the critical mass in flavor QCD
We have performed simulations of QCD with degenerate two flavor -improved Wilson quark and RG-improved Iwasaki gauge actions at zero density in Ref. [6]. The lattice size is . We adopt four hopping parameters of light quarks and 25 to 32 values at each , which cover the pseudo-critical , and 10,000 to 40,000 trajectories have been accumulated at each simulation point. The details of the simulation parameter are shown in Ref. [6]. Among the configurations, the finite density analysis is carried out with and . We use 500 configurations taken every 10 trajectories at each simulation point. The light quark determinant is evaluated up to , i.e. in Eq. (5). We have carried out the zero temperature simulations on lattices to determine the pseudo-scalar and vector meson mass ratio and the quark mass () at the psuedo-critical point. These two values of correspond to and , respectively.
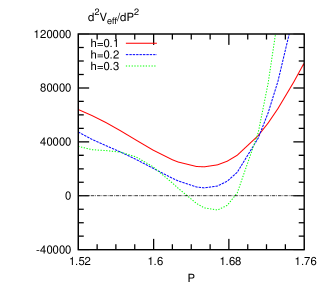
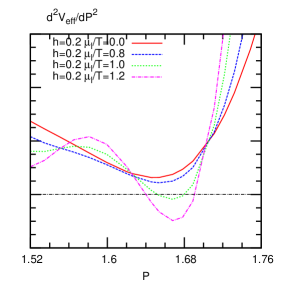
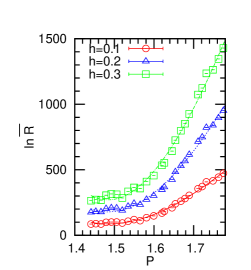
The right panel of Fig. 1 shows the results of at and for and . increases rapidly around and the gradient becomes lager as increases. The second derivatives is calculated by fitting the data of to a sextic polynomial of and is computed from as explained in Sec. 2. The results of are plotted in the left panel of Fig. 2 for and at and . This figure shows that is positive for all at small , while becomes negative in a range of at . This indicates that the phase transition changes from crossover to first order between and .
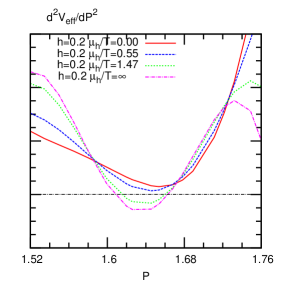
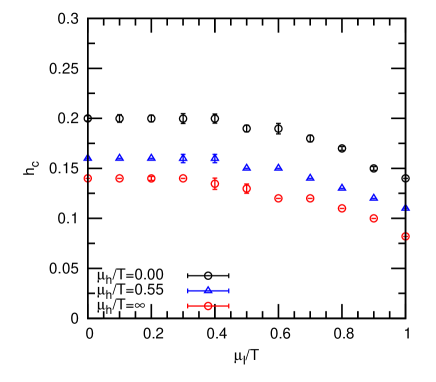
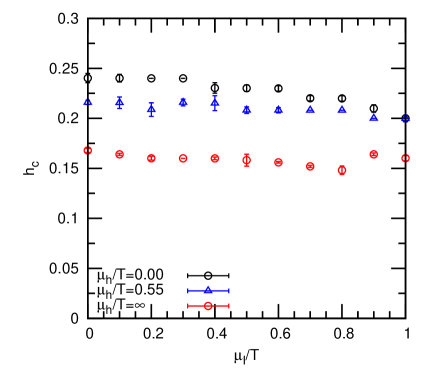
On the other hand, the first order transition arises also at large and even when is small. The middle and right panels of Fig. 2 show the and dependence of the curvature of with and . The curvature becomes negative in a range of at large or . We determine the critical value of , , at which the negative curvature appears. The preliminary results of are shown in the left and right panels of Fig. 3 as functions of for and , respectively. The shape of effective potential is double well in the first order region above . The systematic error which arise in this analysis has not been estimated yet. The error bar represents the statistical error only.
Because we have used the approximation by Taylor expansion up to , the analysis is valid only in the region where is small. On the other hand, the dependence is easy to investigate, since is smaller than one. The results of “” mean those of . It is found that the first order region becomes wider as and increase. The qualitative behavior, i.e. decreases as increases, is consistent with the previous results obtained by an improved staggered fermion action [1]. However, the difference from the result of by the staggered fermion is not small quantitatively. Although the systematic error is not yet estimated, the discretization error of our result by the lattice may be large.
Another interesting point is that the critical value is less dependent on . The difference between the results of and is only about . This situation is similar to the case of the critical surface in the heavy quark region [2]. Although the change of is small, the critical changes as increases, of course. Rewriting as
| (10) |
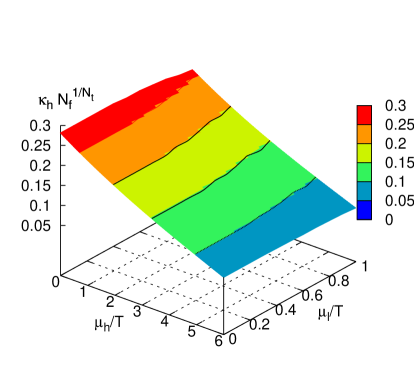
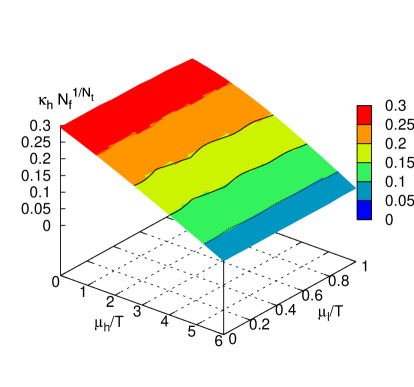
one finds that the critical decreases exponentially as for large when dependence of is small. We then plot the critical value of in Fig. 4 as a function of and translating Fig. 3.
Because the approximation of is used, must be small in this analysis, whereas, the critical points are determined for , i.e. . Then, the critical value of decreases with exponentially. This result derives an important consequence. To apply the hopping parameter expansion, we assume to be small. This condition is always valid for large even if the critical is large. However, for large , is not needed to be large because is no longer large. This means the analysis based on the hopping parameter expansion can be applied for small . If we assume that the hopping parameter expansion is valid when the critical is smaller than 0.1, for example, one can investigate the critical value of at in QCD, i.e. . Thus, the critical surface of flavor QCD can be studied when the density of strange quark is very large in our approach. This suggests that the extrapolation from the high strange quark density region may be a possible way to determine the QCD critical point.
4 Conclusions
We studied the phase structure of the many flavor system, in which two light flavors and massive flavors exist, performing simulations of two flavor QCD with improved Wilson fermions and using the hopping parameter expansion of the heavy quarks. Through the shape of the distribution functions, we determined the critical surface separating the first order transition and crossover regions. It is found that the critical mass of the massive quarks becomes larger as the chemical potential increases. Because we approximate the light quark determinant by a Taylor expansion in terms of the light quark chemical potential , the application range of is limited to a small region. On the other hand, the heavy quark chemical potential can be controlled in a wide range, and it is found that the critical decreases exponentially with at large . Since the critical is sufficiently small at large , the hopping parameter expansion is applicable even for flavor. This conclusion about the critical at large is valid for flavor QCD.
Acknowledgments
This work is in part supported by JSPS KAKENHI Grant-inAid for Scientific Research (Nos. 15H03669, 26287040, 26400244) and by the Large Scale Simulation Program of High Energy Accelerator Research Organization (KEK) No. 14/15-23.
References
- [1] S. Ejiri and N. Yamada, Phys. Rev. Lett. 110, 172001 (2013).
- [2] H. Saito, S. Ejiri, S. Aoki, K. Kanaya, Y. Nakagawa, H. Ohno, K. Okuno, and T. Umeda (WHOT-QCD Collabolation), Phys. Rev. D 89, 034507 (2013).
- [3] C.R. Allton, S. Ejiri, S.J. Hands, O. Kaczmarek, F. Karsch, E. Laermann, Ch. Schmidt, and L. Scorzato, Phys. Rev. D 66 074507 (2002).
- [4] S. Ejiri, Phys. Rev. D 77, 014508 (2008).
- [5] S. Ejiri, Y. Maezawa, N. Ukita, S. Aoki, T. Hatsuda, N. Ishii, K. Kanaya, and T. Umeda (WHOT-QCD Collaboration), Phys. Rev. D 82 014508 (2010).
- [6] S. Ejiri, R. Iwami, N. Yamada, arXiv:1511.06126.