Design Principles of Pancreatic Islets: Glucose-dependent Coordination of Hormone Pulses
Danh-Tai Hoang1,2, Manami Hara3, Junghyo Jo1,4,*
1 Asia Pacific Center for Theoretical Physics, Pohang, Gyeongbuk 36763, Korea
2 Department of Science, Quang Binh University, Dong Hoi, Quang Binh 510000, Vietnam
3 Department of Medicine, The University of Chicago, Chicago, IL 60637, United States of America
4 Department of Physics, Pohang University of Science and Technology, Pohang, Gyeongbuk 36763, Korea
* jojunghyo@apctp.org
Abstract
Pancreatic islets are functional units involved in glucose homeostasis. The multicellular system comprises three main cell types; and cells reciprocally decrease and increase blood glucose by producing insulin and glucagon pulses, while the role of cells is less clear. Although their spatial organization and the paracrine/autocrine interactions between them have been extensively studied, the functional implications of the design principles are still lacking. In this study, we formulated a mathematical model that integrates the pulsatility of hormone secretion and the interactions and organization of islet cells and examined the effects of different cellular compositions and organizations in mouse and human islets. A common feature of both species was that islet cells produced synchronous hormone pulses under low- and high-glucose conditions, while they produced asynchronous hormone pulses under normal glucose conditions. However, the synchronous coordination of insulin and glucagon pulses at low glucose was more pronounced in human islets that had more cells. When cells were selectively removed to mimic diabetic conditions, the anti-synchronicity of insulin and glucagon pulses was deteriorated at high glucose, but it could be partially recovered when the re-aggregation of remaining cells was considered. Finally, the third cell type, cells, which introduced additional complexity in the multicellular system, prevented the excessive synchronization of hormone pulses. Our computational study suggests that controllable synchronization is a design principle of pancreatic islets.
Author Summary
Understanding the design principles of living systems and their functional implications is one of the most fundamental issues in biology. The islets of Langerhans can be a good system with which to explore design principles of multicellular systems because their cellular components, interactions, and organizations have been largely quantified with diabetes research. In this study, we integrate this information using a mathematical model and predict the potential benefits of different designs of pancreatic islets. We found that pancreatic islets have a special design for controlling the synchronization of hormone pulses: islet cells are highly synchronized to concentrate hormone pulses under low-/high-glucose conditions, while they are desynchronized to suppress unnecessary hormone actions under normal glucose conditions. The flexibility of responses to external stimuli is an essential feature of living systems, and the controllability of hormone responses can provide a new perspective on the malfunction of diabetic islets.
Introduction
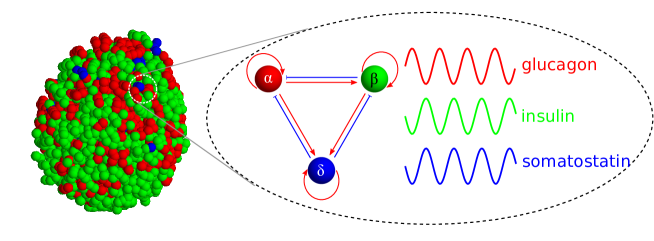
Living systems have structural designs for their functional demands, which has been referred to as symmorphosis [1]. The islets of Langerhans in the pancreas also have unique architecture, which helps them to accomplish their functional goal maintaining constant blood glucose. The multicellular system is composed mainly of three cell types: insulin-secreting cells, glucagon-secreting cells, and somatostatin-secreting cells. Insulin and glucagon are reciprocal hormones that decrease and increase blood glucose, respectively. Interestingly, different species have different islet architectures [2, 3, 4, 5]. Mouse islets have a shell-core structure in which cells are located in the core, while non- cells are located in the periphery, surrounding the core. However, large human islets, which contain a lower fraction of cells, have a mixing structure in which non- cells are not only distributed throughout the islet periphery but also scattered within the islets. Recently, we have found that the spatial organization of islet cells follows a conserved rule in which homotypic cell-cell contacts have a slightly stronger attraction than heterotypic contacts [6].
Insulin, glucagon, and somatostatin secretions are pulsatile, like other endocrine hormones. The three pulses are not independent, but coordinated: the approximate out-of-phase coordination of insulin and glucagon pulses has been observed in the blood of normal humans but not in the blood of diabetic patients [7, 8]. Perifused islets have also shown out-of-phase coordination as well as the in-phase coordination of insulin and somatostatin at high glucose [9, 10]. Phase coordination implies that there is communication between islet cells. Indeed, this communication has been extensively studied in the form of paracrine/autocrine interactions via hormones and neurotransmitters [11].
Considering the mechanism of cellular communication, the spatial organization of islet cells should have functional implications. Clustered cells secrete insulin more robustly than single cells [12, 13]. Recent studies have demonstrated the effectiveness of -cell clustering by systematically controlling the size of -cell aggregates [14, 15]. However, to understand the organization of , , and cells beyond -cell clustering, we await technical innovations that allow the identification of different cell types within islets and the recording of their activities at a high resolution. Nevertheless, we know (i) how single , , and cells produce hormone pulses [16], (ii) how the hormone pulses are affected by other hormone pulses [16], and (iii) how those cells are spatially distributed within islets [6]. We were motivated to integrate the model and the data (Fig. 1), and we computationally inferred the functional implications of the islet architecture. In this computational study, we found that the organization of islet cells and their interactions are designed to produce synchronous hormone pulses under low- and high-glucose conditions and asynchronous hormone pulses under normal glucose conditions. We also observed that the controllable synchronization was deteriorated in diabetic islets.
Islet model
We formulated an islet model on the basis of two observations:
-
(i)
Islet cells are intrinsic oscillators that produce pulses of endocrine hormones.
-
(ii)
Islet cells interact with neighboring cells via paracrine/autocrine signaling.
First, insulin pulses have been widely observed in blood samples obtained from live animals [17] as well as perfused pancreata [18] and islets [9]. Pulsatility is an intrinsic property of cells because isolated cells can still generate oscillations of intracellular calcium concentration [19, 20], a trigger of insulin secretion. Isolated cells [21] and cells [22] can also generate calcium oscillations. Second, islet cells secrete hormones and/or neurotransmitters, and the signaling molecules affect the hormone secretions of neighboring cells. The paracrine/autocrine interactions between , , and cells are summarized in Table I.
To obtain a robust conclusion independent of the details of the model, we generated a minimal model that incorporates the two basic observations. The dynamics of coupled oscillators have been extensively studied using the prototypic model, the Kuramoto model [23]. Thus, we adopted an oscillator model:
| (1) |
where and are the phase and type of the th cell among cells within an islet. The phase represents the degree of hormone secretion: given amplitude, and represent minimal and maximal secretion, respectively. Each cell produces oscillatory hormone secretion with an intrinsic frequency . In this study, we focused on the oscillation with a period of minutes. For simplicity, we assumed that every cell had an identical frequency ; this assumption was relaxed later.
The second term in Eq. (1) represents the interactions of the nearest neighboring th cells. The neighborhood set of the th cell was predetermined from the data of the islet structures. The strength of the interaction from the th cell to the th cell is
| (2) |
where defines the sign of the interaction (Table 1) and and represent the relative activities of the receiver and affecter cells. Positive/negative interactions () lead the th cell to have in-phase/out-of-phase oscillations with the th cell.
| Symbol | Interaction | Sign | Reference |
|---|---|---|---|
| [24, 25, 26, 27] | |||
| [28, 29, 30, 31] | |||
| [32, 33, 34] | |||
| [35, 36, 37, 38, 39, 40, 41, 42] | |||
| [43, 44, 45, 46] | |||
| [47, 48, 49] | |||
| [50, 51, 35, 52] | |||
| [50, 51, 35, 52, 53] | |||
The interactions are mediated by signaling molecules secreted from , , and cells. Thus, the interaction strengths should be dependent on the activities of cells that are governed by glucose level. One can consider those activities as average hormone secretions at different glucose concentrations [54, 55]. In general, cells are active at low glucose, while and cells are active at high glucose. Here we included the glucose conditions implicitly in the activities of islet cells, and simply defined low (), normal (), and high glucose conditions (). Thus is a proxy parameter for glucose conditions of which scale can be different from real glucose concentrations. The current considers the activities of both affecter and receiver cells; the pair of a strong affecter and a weak receiver exhibits maximal coupling. We considered an alternative activity-dependent interaction, , which ignores the activity of receiver cells. Because these two cases did not show significant differences, we focused on the former definition in Eq. (2). This setting helps to reduce the number of parameters from nine to three . Next, we have a constraint, , and this implies that every autocrine interaction has a unity of strength, .
Results
Islet cells generate the glucose-dependent coordination of insulin and glucagon pulses
We started by considering simple islets that had only and cells, two major cell populations (). Considering the antagonistic roles of the two cell types for glucose homeostasis, they are likely to inhibit each other. Unexpectedly, however, they showed an asymmetric interaction rather than mutual inhibition: cells indeed suppressed cells (), but cells stimulated cells (). We examined how the asymmetric interaction affected the coordination of hormone pulses within islets.
First, we simulated the dynamics of and cells in Eq. (1) with a prototypic organization of core cells and peripheral cells. The multicellular system had three equilibrium states, depending on the glucose conditions:
-
(i)
In-phase synchronous state. When cells were active () at low glucose, they secreted neurotransmitters, which sensitized cells to secrete insulin [31]. Here the positive interaction () from to cells dominated the negative interaction () from to cells. In addition, the positive autocrine interactions () helped homotypic cells synchronize with each other. Given these conditions, synchronous cells were coordinated in phase with synchronous cells (Fig. 2A and Video S1A). This state represented the in-phase coordination of glucagon and insulin pulses.
-
(ii)
Asynchronous state. When and cells were equally active () at normal glucose, the asymmetric interaction had the same strength (=1). The cells were “confused” about whether to be active because neighboring cells activated them but neighboring cells equally suppressed them. This incongruous condition ultimately resulted in both and cells becoming asynchronous, although local homotypic clusters temporally showed synchronous behaviors (Fig. 2B and Video S1B). Local synchronization has been observed in a recent experimental study [56].
-
(iii)
Out-of-phase synchronous state. When cells were active () at high glucose, they secreted insulin and neurotransmitters, which suppressed cells from secreting glucagon. Unlike the low-glucose condition, the negative interaction () from to cells dominated the positive interaction () from to cells. Thus, the synchronous cells were coordinated out of phase with the synchronous cells (Fig. 2C and Video S1C). This state represented the out-of-phase coordination of glucagon and insulin pulses, which has been repeatedly reported [7, 8, 9, 10].
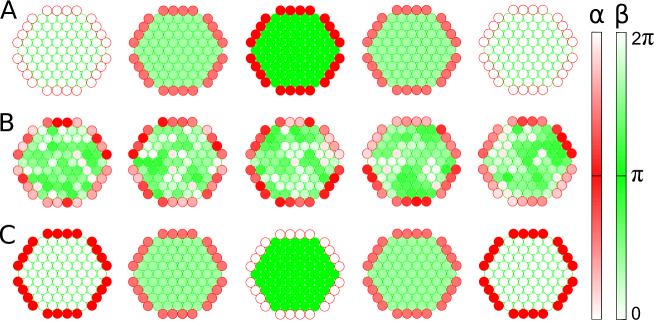
The three states were not sharply divided but smoothly altered with glucose conditions (). Thus, we introduced order parameters and that measured the degree of synchronization between cells and cells, respectively (See Materials and Methods): and represent perfect synchronization and desynchronization between cells, respectively. The same is true for . In addition, we measured the phase difference between average -cell phase and -cell phase : and represent perfect in-phase and out-of-phase states, respectively.
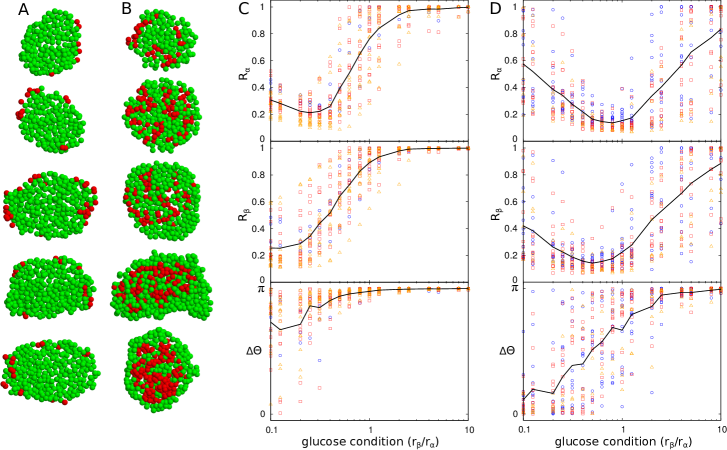
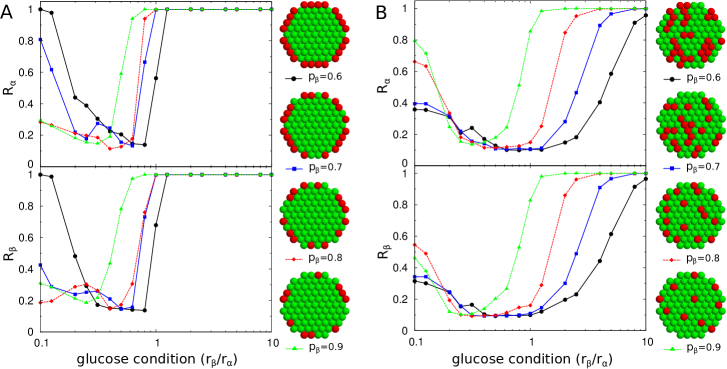
Using these order parameters, we examined the dynamics of and cells that interacted given the spatial distributions in mouse and human islets (Figs. 3A and 3B). We observed the above three states frequently in the two species. However, the out-of-phase synchronous state was more pronounced in mouse islets that had more cells (Fig. 3C), while the in-phase synchronous state was more pronounced in human islets that had more cells (Fig. 3D). Different sizes of islets showed similar dynamics in both mouse and human islets. The size independence is of particular interest in human islets that have different cellular compositions according to their size. Interestingly, cells and cells were partially synchronous ( and ), except under very high-glucose conditions. In particular, the in-phase synchronous state at low glucose was largely suppressed in mouse islets. Asynchronous oscillation of cells at low glucose has been experimentally observed [57].
Pancreatic islets contain other cell types. Although cells compose a minor portion of the population (), they can affect the cellular dynamics because they interact with and cells (Table 1), as cells suppress both and cells, but are activated by both and cells. To probe the role of cells, we compared the cellular dynamics in the presence and absence of cells within islets (Fig. S1). The complex interactions between , , and cells disrupted the synchronizations of and cells. In general, the existence of cells decreased the degree of synchronization, but the minor population did not dramatically modify the above results that ignored cells. Thus, for simplicity, we do not consider cells hereafter.
The organizations and interactions of islet cells are designed for smooth transitions between synchronous and asynchronous hormone pulses
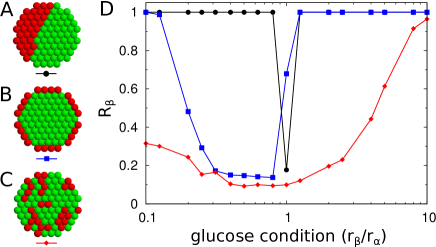
To systematically investigate the design principles of natural islets, we considered artificial islets that had different organizations of islet cells or different interactions between them. As a backbone for the three-dimensional arrangement of islet cells, we adopted hexagonal-close-packed lattices [6, 58] and controlled the spatial distributions and compositions of and cells, ( and , respectively). We generated different islet structures by tuning the relative adhesions between cell types (See Materials and Methods). Three distinct structures were (i) the complete sorting structure, in which homogeneous cell clusters were divided into left and right hemispheres; (ii) the shell-core sorting structure, in which cells were clustered in the core and cells were in the periphery; and (iii) the mixing structure, in which and cells were intermingled with each other. For a fixed cellular composition (), the three structures showed different patterns of synchronization (Fig. 4). Unlike the shell-core and mixing structures, the complete sorting structure always generated perfect synchronization between cells except under a very narrow glucose condition (). The lack of partial synchronization resulted in abrupt transitions between the synchronous and asynchronous states.
Next, we controlled cellular compositions given a total cell number (). Mouse islets have a shell-core structure with a high fraction of cells (). If the -cell fraction was decreased in mouse islets, then the multi-cellular dynamics showed an enhancement of the in-phase synchronous state and sharper slopes of and with respect to the glucose conditions (Fig. 5A). However, human islets have the mixing structure with a smaller fraction of cells (). If the -cell fraction was increased in human islets like the fraction in mouse islets, then the modified human islets had the enhanced in-phase synchronization and sharper slopes of and (Fig. 5B). Therefore, the large -cell fraction in mouse islets and small -cell fraction in human islets are effective in suppressing the in-phase synchronization between insulin and glucagon pulses, and in preventing sharp transitions between the synchronous and asynchronous hormone pulses as glucose conditions change. These conclusions were the same for different sizes of islets (Fig. S2).
The opposite dependence of -cell fractions for mouse and human islets was related to the number and size inhomogeneity of -cell clusters. The number of cells was not sufficient to form a large cluster in the shell-core structure, so several clusters of cells that varied in size existed. However, as the number of cells increased in the mixing structure, clusters of cells of various sizes started to appear. The separate clusters of cells contributed to the diminishing of the synchronization of cells.
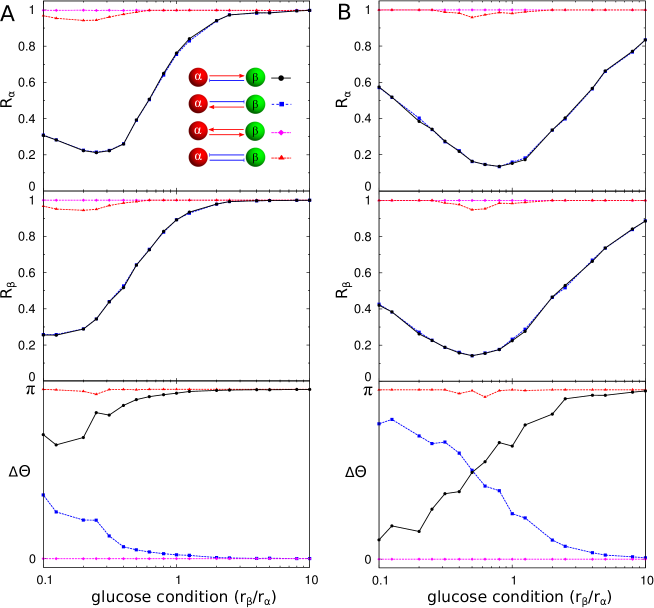
Next, we modified the interactions between and cells by considering every possibility in regard to their mutual interaction. In natural islets, cells sensitize cells, while cells suppress cells. Unlike the asymmetric interaction, when the two cells symmetrically activated or inhibited each other, they always generated synchronous hormone pulses that were independent of the glucose conditions (Fig. 6). However, the mutual activation model always showed in-phase coordination of insulin and glucagon pulses, while the mutual inhibition model always showed out-of-phase coordination of the pulses. When the asymmetric interaction was reversed, the controllability of the synchronization was intact, but the phase coordination of insulin and glucagon pulses was reversed for the glucose conditions. If cells inhibited cells and cells activated cells, then they could generate the in-phase coordination of insulin and glucagon pulses under high-glucose conditions.
Diabetic islets fail to produce coordinated pulses of insulin and glucagon
We simulated diabetic islets by removing cells (Fig. 7A). The random removal of cells attenuated the synchronization of islet cells under high-glucose conditions (Fig. 7B). In particular, a drastic change was found when approximately 50% of the cells were moved. A loss of out-of-phase coordination of insulin and glucagon pulses has been observed in diabetic patients [7]. Furthermore, cells became relatively abundant due to the selective loss of cells. This change strengthened the positive interactions from cells, which then enhanced the synchronization of islet cells under low-glucose conditions.
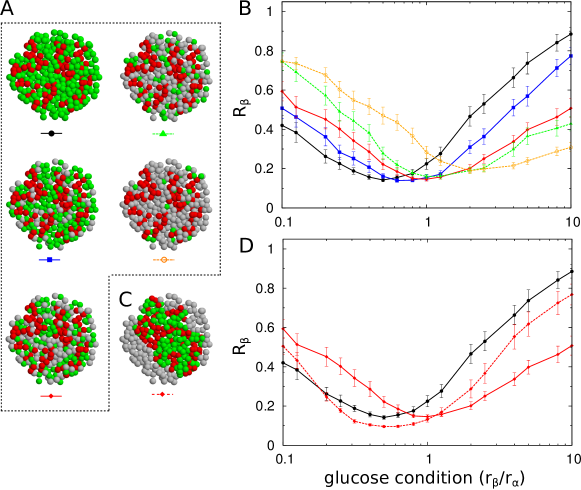
To more realistically simulate the diabetic islets, the re-aggregation of remaining cells should be considered (Fig. 7C), because the sites of removed cells could not physically remain as an empty space. One interesting question is whether the space-filling is just a passive process or whether it can be an active process used to escape the deteriorated condition. When we considered re-aggregation (See Materials and Methods), the enhanced synchronization at low glucose and suppressed synchronization at high glucose were partially recovered to original patterns for normal islets (Fig. 7D). This finding suggested that the re-organization of islet cells under diabetic conditions could actively contribute to recovery.
Discussion
We computationally studied the design principles of pancreatic islets by integrating their structure and function in a model. Our model incorporated the pulsatility of hormone secretions, paracrine/autocrine interactions, and spatial organization of pancreatic , , and cells. We found that the multicellular system functions not only to produce synchronous hormone pulses at low/high glucose but also to produce asynchronous hormone pulses under normal glucose conditions. The controllable synchronization effectively enhanced and suppressed hormone actions, depending on the glucose conditions. Thus, we proposed that the defective controllability of hormone pulses could contribute to metabolic diseases, such as diabetes.
We predicted the glucose-dependent coordination of hormone pulses. Regarding the phase coordination of insulin and glucagon pulses, previous studies have reported out-of-phase [7, 9], in-phase [59, 60], and no [61, 18] relationships between the two pulses. Controversies could originate from variations in animal species, islet preparation, and/or experiment conductors. Our finding, however, implies that the different phase coordinations could be partially explained by the different glucose conditions in the studies.
We adopted a minimal model with essential ingredients to reduce unnecessary complexities and obtain robust conclusions. Indeed, we confirmed that some possible modifications did not change our conclusion about controllable synchronization. First, we used an alternative form of paracrine/autocrine interactions () that ignored the activity of receiver cells (Fig. S3A). Second, we relaxed the assumption that every cell had the same intrinsic frequencies by introducing some variations of (Fig. S3B). Third, we applied a stronger interaction () between cells as the simplest way to consider their gap-junctional coupling in addition to their autocrine interaction (Fig. S3C). Finally, we ignored the autocrine interaction of cells (), because this interaction has not been observed yet; its contribution is expected to be negligible because contact between cells is very rare (Fig. S3D).
Nevertheless, the minimal model was limited to incorporating all of the observed complexities of the system. In the phase-oscillator model, we simplified the shape of hormone pulses as a sine wave, although their ridge and valley durations could depend on the glucose conditions. Next, we reduced the number of parameters that described the strengths of the paracrine/autocrine interactions by assuming that they were governed by the activities of the cells. The reduced degrees of freedom may have constrained the multicellular system from generating richer dynamics. Thus we cannot rule out the possibility that cells play a crucial role in the multicellular system. For example, the out-of-phase coordination of glucagon and insulin pulses at high glucose may be predominantly led by the inhibitory interaction from somatostatin rather than insulin [62, 63]. Third, the paracrine interactions may depend on external glucose stimuli as well as the activities of cells. The stimulatory interaction from cells to cells via glucagon functions in the presence of glucose stimuli [64]. Forth, the sign of the interactions may not be fixed. Indeed, the sign of the autocrine interaction of cells remains controversial [65]. Finally, although we focused on the short-range interactions of islet cells with no time delay, they may have long-range interactions via blood vessels and nerves densely innervated in islets. However, current experimental data are not comprehensive enough to probe the relevance of these complexities to the controllability of a multicellular system.
In living systems, desynchronization is as important as synchronization [66, 67]. Pancreatic islets showed one possible design for controllable synchronization. The design principle can be applied to other multicellular systems such as neural networks that have both excitatory and inhibitory connections.
Materials and methods
Quantification of synchronization
The degree of synchronization between cells in the same population is characterized by a generalized order parameter [68]:
| (3) |
where the amplitude measures the phase coherence of cells, and the phase represents the average phase of cells. Here the Kronecker delta function, , represents that the th cell contributes with only when its type is , otherwise . Notably, we used a multiplication factor of 2 for the order parameters because the multicellular dynamics showed that cells in the same population were sometimes divided into two groups with a phase difference (See Text S1). The usual order parameter without the multiplication factor could not distinguish this ordered condition from a completely disordered one.
Structure of mouse and human islets
We used the structural information of mouse and human islets from our previous study [6]. Briefly, isolated mouse () and human () islets were stained with glucagon and insulin antibodies, and the three-dimensional coordinations of individual cells within single islets were identified using a confocal microscope. Then, the neighborhood of each cell was identified by calculating the cell-to-cell distances. In six samples of human islets, cells stained with the somatostatin antibody were identified as well as and cells.
Simulation of islet organization and reorganization
To examine design principles of the natural organization of islet cells, we generated their artificial organization. We used hexagonal close-packed (HCP) lattices as a backbone structure for the artificial islet organization [6]. The spatial organization of islet cells was determined by minimizing the total cell-to-cell adhesion energy,
| (4) |
where represents the adhesion energy for the contact of th cell and th cell with their corresponding cell types, and ; and denotes the set of nearest neighboring cells of the th cell. The adhesion model could generate various structures, depending on the parameter set : complete sorting structure (, , ), shell-core sorting structure (, , ), and mixing structure (, , ), given a total cells [6]. Briefly, we (i) randomly distributed the numbers of and cells on HCP lattices; (ii) randomly chose two cells to swap, and calculated the total adhesion energies, and , before and after exchanging their positions; (iii) accepted the exchange with the probability, , following the Metropolis algorithm [69], where the parameter controls the fluctuation of cellular organizations; and (iv) repeated these procedures in several million Monte-Carlo steps per cell to obtain an equilibrium structure.
We applied the adhesion model to simulate the re-aggregation of the remaining cells in diabetic islets. We considered empty sites of removed cells as cells. Then, the adhesion parameters , , and could simulate the re-aggregation in diabetic islets because cells prefer contacting with cells to contacting with empty sites (See Video S2).
Numerical integration
To integrate Eq. (1), we used the Euler method [70] with a sufficiently-small time step . The intrinsic frequency could be set to for convenience because the multicellular dynamics is invariant under the transformation, . The initial phases were randomly chosen. The quantities of interest, such as the complex order parameters, were measured after a sufficiently long transient was discarded.
Supporting Information
S1 Video
Dynamics of islet-cell activities. (A) Low-glucose condition (), (B) normal glucose condition (), and (C) high-glucose condition (). Activities (or phases) of (red circle) and cells (green circle) change with time. Each cell spontaneously alternates its phase between 0 (light color) and (dark color), and its neighboring cells perturbs the oscillation given cellular interactions. Note that cross-sections of three-dimensional structures are displayed for clarity.
S2 Video
Re-aggregation simulation of islet cells. Under 50% removal of cells (green), the remaining (red) and cells re-aggregate given preferential contacts between cells (See Materials and Methods). Note that this simulation was conducted on a two-dimensional lattice for clarity, but the re-aggregation simulations for Figs. 7C and 7D were conducted on three-dimensional lattices.
S1 Text
Model of four coupled oscillators. We introduce a simple case where cells in the same population can be divided into two groups with a phase difference under multicellular dynamics in Eq. 1.
S1 Fig
Role of cells for islet-cell synchronization. An islet structure in (A) the presence and (B) absence of cells. Note that cross sections of three-dimensional structures are displayed for clarity. (C) Synchronization index of cells is plotted in the presence (black filled circle) and absence (blue empty circle) of cells. The error bars represent standard errors of the mean (n=6). For the simulation, and were used.
S2 Fig
Islet size and synchronization. Synchronization index of cells for three islet sizes with shell-core (left column) and mixing structures (right): (A) and (B) (top row), (C) and (D) (middle), and (E) and (F) (bottom) hexagonal-close-packed lattices. Different cellular compositions are considered as Fig. 5. The fractions of cells are (black circle), 0.7 (blue square), 0.8 (red diamond), and 0.9 (green triangle). The data resulted from averages of five ensembles using different initial conditions for solving Eq. 1.
S3 Fig
Model robustness. Synchronization index of cells was examined under modifications (blue empty circle, dotted line) of the original model (black filled circle, solid line). (A) Strength of cellular interactions, vs. (Fig. 3D). (B) Intrinsic frequency, vs. (Fig. 3D). (C) Stronger interaction between cells, vs. (Fig. 3D). (D) No interaction between cells, vs. (Fig. S1C).
Acknowledgments
We thank A. Tengholm, E. Gylfe, B. Hellman, A. Sherman, and V. Periwal for helpful discussions and critical reading of the manuscript. This research was supported in part by Basic Science Research Program through the National Foundation of Korea funded by the Ministry of Science, ICT & Future Planning (No. 2013R1A1A1006655) and by the Max Planck Society, the Korea Ministry of Education, Science and Technology, Gyeongsangbuk-Do and Pohang City (J.J.), and DK-020595 to the University of Chicago Diabetes Research and Training Center (Animal Models Core), DK-072473, AG-042151, and a gift from the Kovler Family Foundation (M.H.).
References
- 1. Weibel ER, Taylor CR, Hoppeler H. The concept of symmorphosis: a testable hypothesis of structure-function relationship. Proc Natl Acad Sci U S A. 1991 Nov;88(22):10357–61.
- 2. Brissova M, Fowler MJ, Nicholson WE, Chu A, Hirshberg B, Harlan DM, et al. Assessment of human pancreatic islet architecture and composition by laser scanning confocal microscopy. J Histochem Cytochem. 2005;53:1087–1097.
- 3. Cabrera O, Berman DM, Kenyon NS, Ricordi C, Berggren PO, Caicedo A. The unique cytoarchitecture of human pancreatic islets has implications for islet cell function. Proc Natl Acad Sci USA. 2006;103:2334–2339.
- 4. Bosco D, Armanet M, Morel P, Niclauss N, Sgroi A, Muller YD, et al. Unique arrangement of - and -cells in human islets of Langerhans. Diabetes. 2010;59:1202–1210.
- 5. Steiner DJ, Kim A, Miller K, Hara M. Pancreatic islet plasticity: interspecies comparison of islet architecture and composition. Islets. 2010;2(3):135–45.
- 6. Hoang DT, Matsunari H, Nagaya M, Nagashima H, Millis JM, Witkowski P, et al. A conserved rule for pancreatic islet organization. PLoS One. 2014;9(10):e110384.
- 7. Menge BA, Grüber L, Jørgensen SM, Deacon CF, Schmidt WE, Veldhuis JD, et al. Loss of inverse relationship between pulsatile insulin and glucagon secretion in patients with type 2 diabetes. Diabetes. 2011 Aug;60(8):2160–8.
- 8. Rohrer S, Menge BA, Grüber L, Deacon CF, Schmidt WE, Veldhuis JD, et al. Impaired crosstalk between pulsatile insulin and glucagon secretion in prediabetic individuals. J Clin Endocrinol Metab. 2012 May;97(5):E791–5.
- 9. Hellman B, Salehi A, Gylfe E, Dansk H, Grapengiesser E. Glucose generates coincident insulin and somatostatin pulses and antisynchronous glucagon pulses from human pancreatic islets. Endocrinology. 2009 Dec;150(12):5334–40.
- 10. Hellman B, Salehi A, Grapengiesser E, Gylfe E. Isolated mouse islets respond to glucose with an initial peak of glucagon release followed by pulses of insulin and somatostatin in antisynchrony with glucagon. Biochem Biophys Res Commun. 2012 Jan;417(4):1219–23.
- 11. Koh DS, Cho JH, Chen L. Paracrine interactions within islets of Langerhans. J Mol Neurosci. 2012 Oct;48(2):429–40.
- 12. Sherman A, Rinzel J. Model for synchronization of pancreatic beta-cells by gap junction coupling. Biophys J. 1991 Mar;59(3):547–59.
- 13. Jonkers FC, Jonas JC, Gilon P, Henquin JC. Influence of cell number on the characteristics and synchrony of Ca2+ oscillations in clusters of mouse pancreatic islet cells. J Physiol. 1999 Nov;520 Pt 3:839–49.
- 14. Hraha TH, Bernard AB, Nguyen LM, Anseth KS, Benninger RKP. Dimensionality and size scaling of coordinated Ca(2+) dynamics in MIN6 -cell clusters. Biophys J. 2014 Jan;106(1):299–309.
- 15. Hraha TH, Westacott MJ, Pozzoli M, Notary AM, McClatchey PM, Benninger RKP. Phase transitions in the multi-cellular regulatory behavior of pancreatic islet excitability. PLoS Comput Biol. 2014 Sep;10(9):e1003819.
- 16. Hong H, Jo J, Sin SJ. Stable and flexible system for glucose homeostasis. Phys Rev E Stat Nonlin Soft Matter Phys. 2013 Sep;88(3):032711.
- 17. Lang DA, Matthews DR, Peto J, Turner RC. Cyclic oscillations of basal plasma glucose and insulin concentrations in human beings. N Engl J Med. 1979 Nov;301(19):1023–7.
- 18. Stagner JI, Samols E, Weir GC. Sustained oscillations of insulin, glucagon, and somatostatin from the isolated canine pancreas during exposure to a constant glucose concentration. J Clin Invest. 1980 Apr;65(4):939–42.
- 19. Grapengiesser E, Gylfe E, Hellman B. Cyclic AMP as a determinant for glucose induction of fast Ca2+ oscillations in isolated pancreatic beta-cells. J Biol Chem. 1991 Jul;266(19):12207–10.
- 20. Tengholm A, Gylfe E. Oscillatory control of insulin secretion. Mol Cell Endocrinol. 2009 Jan;297(1-2):58–72.
- 21. Berts A, Ball A, Gylfe E, Hellman B. Suppression of Ca2+ oscillations in glucagon-producing alpha 2-cells by insulin/glucose and amino acids. Biochim Biophys Acta. 1996 Feb;1310(2):212–6.
- 22. Berts A, Ball A, Dryselius G, Gylfe E, Hellman B. Glucose stimulation of somatostatin-producing islet cells involves oscillatory Ca2+ signaling. Endocrinology. 1996 Feb;137(2):693–7.
- 23. Acebrón JA, Bonilla LL, Vicente CJP, Ritort F, Spigler R. The Kuramoto model: A simple paradigm for synchronization phenomena. Reviews of Modern Physics. 2005;77(1):137–185.
- 24. Cabrera O, Jacques-Silva MC, Speier S, Yang SN, Köhler M, Fachado A, et al. Glutamate is a positive autocrine signal for glucagon release. Cell Metab. 2008 Jun;7(6):545–54.
- 25. Cho JH, Chen L, Kim MH, Chow RH, Hille B, Koh DS. Characteristics and functions of alpha-amino-3-hydroxy-5-methyl-4-isoxazolepropionate receptors expressed in mouse pancreatic alpha-cells. Endocrinology. 2010 Apr;151(4):1541–50.
- 26. Leibiger B, Moede T, Muhandiramlage TP, Kaiser D, Vaca Sanchez P, Leibiger IB, et al. Glucagon regulates its own synthesis by autocrine signaling. Proc Natl Acad Sci U S A. 2012 Dec;109(51):20925–30.
- 27. Gilon P, Cheng-Xue R, Lai BK, Chae HY, Gómez-Ruiz A. Physiological and Pathophysiological Control of Glucagon Glucagon Secretion by Pancreatic -Cells. In: Islets of Langerhans. Springer; 2015. p. 175–247.
- 28. Samols E, Marri G, Marks V. Promotion of insulin secretion by glucagon. Lancet. 1965 Aug;2(7409):415–6.
- 29. Kawai K, Yokota C, Ohashi S, Watanabe Y, Yamashita K. Evidence that glucagon stimulates insulin secretion through its own receptor in rats. Diabetologia. 1995;38(3):274–276.
- 30. Brereton H, Carvell MJ, Persaud SJ, Jones PM. Islet -cells do not influence insulin secretion from -cells through cell–cell contact. Endocrine. 2007;31(1):61–65.
- 31. Rodriguez-Diaz R, Dando R, Jacques-Silva MC, Fachado A, Molina J, Abdulreda MH, et al. Alpha cells secrete acetylcholine as a non-neuronal paracrine signal priming beta cell function in humans. Nat Med. 2011 Jul;17(7):888–92.
- 32. Patton GS, Dobbs R, Orci L, Vale W, Unger RH. Stimulation of pancreatic immunoreactive somatostatin (IRS) release by glucagon [proceedings]. Metabolism. 1976 Nov;25(11 Suppl 1):1499.
- 33. Weir GC, Samols E, Day JA Jr, Patel YC. Glucose and glucagon stimulate the secretion of somatostatin from the perfused canine pancreas. Metabolism. 1978 Sep;27(9 Suppl 1):1223–6.
- 34. Dolais-Kitabgi J, Kitabgi P, Freychet P. Glucose and glucagon do stimulate somatostatin release from isolated pancreatic islets. Diabetologia. 1981 Sep;21(3):238.
- 35. Cherrington AD, Chiasson JL, Liljenquist JE, Jennings AS, Keller U, Lacy WW. The role of insulin and glucagon in the regulation of basal glucose production in the postabsorptive dog. J Clin Invest. 1976 Dec;58(6):1407–18.
- 36. Samols E, Harrison J. Intraislet negative insulin-glucagon feedback. Metabolism. 1976 Nov;25(11 Suppl 1):1443–7.
- 37. Rorsman P, Berggren PO, Bokvist K, Ericson H, Möhler H, Ostenson CG, et al. Glucose-inhibition of glucagon secretion involves activation of GABAA-receptor chloride channels. Nature. 1989 Sep;341(6239):233–6.
- 38. Ishihara H, Maechler P, Gjinovci A, Herrera PL, Wollheim CB. Islet beta-cell secretion determines glucagon release from neighbouring alpha-cells. Nat Cell Biol. 2003 Apr;5(4):330–5.
- 39. Ravier MA, Rutter GA. Glucose or insulin, but not zinc ions, inhibit glucagon secretion from mouse pancreatic alpha-cells. Diabetes. 2005 Jun;54(6):1789–97.
- 40. Franklin I, Gromada J, Gjinovci A, Theander S, Wollheim CB. Beta-cell secretory products activate alpha-cell ATP-dependent potassium channels to inhibit glucagon release. Diabetes. 2005 Jun;54(6):1808–15.
- 41. Tudurí E, Filiputti E, Carneiro EM, Quesada I. Inhibition of Ca2+ signaling and glucagon secretion in mouse pancreatic alpha-cells by extracellular ATP and purinergic receptors. Am J Physiol Endocrinol Metab. 2008 May;294(5):E952–60.
- 42. Ramracheya R, Ward C, Shigeto M, Walker JN, Amisten S, Zhang Q, et al. Membrane potential-dependent inactivation of voltage-gated ion channels in alpha-cells inhibits glucagon secretion from human islets. Diabetes. 2010 Sep;59(9):2198–208.
- 43. Aspinwall CA, Lakey JR, Kennedy RT. Insulin-stimulated insulin secretion in single pancreatic beta cells. J Biol Chem. 1999 Mar;274(10):6360–5.
- 44. Leibiger IB, Leibiger B, Berggren PO. Insulin feedback action on pancreatic beta-cell function. FEBS Lett. 2002 Dec;532(1-2):1–6.
- 45. Braun M, Ramracheya R, Bengtsson M, Clark A, Walker JN, Johnson PR, et al. Gamma-aminobutyric acid (GABA) is an autocrine excitatory transmitter in human pancreatic beta-cells. Diabetes. 2010 Jul;59(7):1694–701.
- 46. Jacques-Silva MC, Correa-Medina M, Cabrera O, Rodriguez-Diaz R, Makeeva N, Fachado A, et al. ATP-gated P2X3 receptors constitute a positive autocrine signal for insulin release in the human pancreatic beta cell. Proc Natl Acad Sci U S A. 2010 Apr;107(14):6465–70.
- 47. Honey RN, Weir GC. Insulin stimulates somatostatin and inhibits glucagon secretion from the perfused chicken pancreas-duodenum. Life Sci. 1979 May;24(19):1747–50.
- 48. Bertrand G, Gross R, Ribes G, Loubatières-Mariani MM. P2 purinoceptor agonists stimulate somatostatin secretion from dog pancreas. Eur J Pharmacol. 1990 Jul;182(2):369–73.
- 49. van der Meulen T, Donaldson CJ, Cáceres E, Hunter AE, Cowing-Zitron C, Pound LD, et al. Urocortin3 mediates somatostatin-dependent negative feedback control of insulin secretion. Nat Med. 2015 Jul;21(7):769–76.
- 50. Koerker DJ, Ruch W, Chideckel E, Palmer J, Goodner CJ, Ensinck J, et al. Somatostatin: hypothalamic inhibitor of the endocrine pancreas. Science. 1974 Apr;184(4135):482–4.
- 51. Orci L, Unger RH. Functional subdivision of islets of Langerhans and possible role of D cells. Lancet. 1975 Dec;2(7947):1243–4.
- 52. Guillemin R, Gerich JE. Somatostatin: physiological and clinical significance. Annual review of medicine. 1976;27(1):379–388.
- 53. Daunt M, Dale O, Smith PA. Somatostatin inhibits oxidative respiration in pancreatic beta-cells. Endocrinology. 2006 Mar;147(3):1527–35.
- 54. Vieira E, Salehi A, Gylfe E. Glucose inhibits glucagon secretion by a direct effect on mouse pancreatic alpha cells. Diabetologia. 2007 Feb;50(2):370–9.
- 55. Walker JN, Ramracheya R, Zhang Q, Johnson PRV, Braun M, Rorsman P. Regulation of glucagon secretion by glucose: paracrine, intrinsic or both? Diabetes Obes Metab. 2011 Oct;13 Suppl 1:95–105.
- 56. Almaça J, Liang T, Gaisano HY, Nam HG, Berggren PO, Caicedo A. Spatial and temporal coordination of insulin granule exocytosis in intact human pancreatic islets. Diabetologia. 2015 Dec;58(12):2810–8.
- 57. Nadal A, Quesada I, Soria B. Homologous and heterologous asynchronicity between identified alpha-, beta- and delta-cells within intact islets of Langerhans in the mouse. J Physiol. 1999 May;517 ( Pt 1):85–93.
- 58. Nittala A, Ghosh S, Wang X. Investigating the role of islet cytoarchitecture in its oscillation using a new beta-cell cluster model. PLoS One. 2007;2(10):e983.
- 59. Lang DA, Matthews DR, Burnett M, Ward GM, Turner RC. Pulsatile, synchronous basal insulin and glucagon secretion in man. Diabetes. 1982 Jan;31(1):22–6.
- 60. Jaspan JB, Lever E, Polonsky KS, Van Cauter E. In vivo pulsatility of pancreatic islet peptides. Am J Physiol. 1986 Aug;251(2 Pt 1):E215–26.
- 61. Hansen BC, Jen KC, Belbez Pek S, Wolfe RA. Rapid oscillations in plasma insulin, glucagon, and glucose in obese and normal weight humans. J Clin Endocrinol Metab. 1982 Apr;54(4):785–92.
- 62. Gylfe E, Tengholm A. Neurotransmitter control of islet hormone pulsatility. Diabetes Obes Metab. 2014 Sep;16 Suppl 1:102–10.
- 63. Li J, Yu Q, Ahooghalandari P, Gribble FM, Reimann F, Tengholm A, et al. Submembrane ATP and Ca2+ kinetics in -cells: unexpected signaling for glucagon secretion. FASEB J. 2015 Aug;29(8):3379–88.
- 64. Liu YJ, Grapengiesser E, Gylfe E, Hellman B. Crosstalk between the cAMP and inositol trisphosphate-signalling pathways in pancreatic beta-cells. Arch Biochem Biophys. 1996 Oct;334(2):295–302.
- 65. Braun M, Ramracheya R, Rorsman P. Autocrine regulation of insulin secretion. Diabetes Obes Metab. 2012 Oct;14 Suppl 3:143–51.
- 66. Glass L. Synchronization and rhythmic processes in physiology. Nature. 2001 Mar;410(6825):277–84.
- 67. Louzada VHP, Araújo NAM, Andrade JS Jr, Herrmann HJ. How to suppress undesired synchronization. Sci Rep. 2012;2:658.
- 68. Pikovsky A, Rosenblum M, Kurths J. Synchronization: a universal concept in nonlinear sciences. vol. 12. Cambridge: Cambridge University Press; 2001. Available from: http://www.loc.gov/catdir/description/cam021/2001018104.html.
- 69. Metropolis N, Ulam S. The Monte Carlo method. J Am Statist Assoc. 1949;44:335–341.
- 70. Press WH. Numerical recipes in C. 2nd ed. Cambridge University Press; 1992.
Text S1
Model of four coupled oscillators
We considered a simple setup to demonstrate the importance of network structure on multicellular dynamics. Suppose we put two types of cells on a one-dimensional array with four sites. Here, individual cells generate intrinsic oscillations and affect the oscillations of their nearest neighboring cells. The phase dynamics of the interacting cells on the four sites is described by
| (A.5) | |||||
| (A.6) | |||||
| (A.7) | |||||
| (A.8) |
where is their intrinsic frequency, is the cell type on the th site, and represents the interaction from the th cell to the th cell which depends on their cell types. Because we are interested in the relative phases between cells, we define them: , , and . Then, we obtain the equations of motion for the relative phases from the four phase equations:
| (A.9) | |||||
| (A.10) | |||||
| (A.11) |
Here, are stationary solutions of Eqs. (A.9)-(A.11). To examine their stabilities, we can linearize around the solutions , where for , and for . The same is true for and . Defining a vector , we obtained a linear equation with
| (A.12) |
Next, we confirmed the stabilities of the eight stationary solutions, , by examining the sign of the eigenvalues of the matrix . We have two cells and two cells with different arrangements (Fig. A.1). The strength of cellular interactions is governed by the activities and of affecter and receiver cells: . The signs of the interactions are encoded in , , and . Given the activities and , different cell arrangements have different stable stationary states (Fig. A.1).
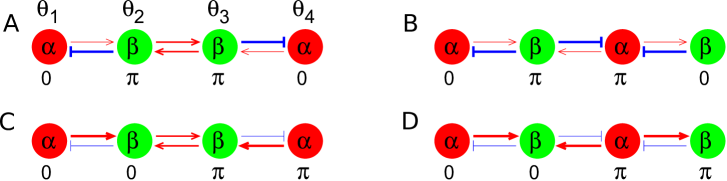
Fig. S1
![[Uncaptioned image]](/html/1512.08305/assets/x9.png)
Fig. S2
![[Uncaptioned image]](/html/1512.08305/assets/x10.png)
Fig. S3
![[Uncaptioned image]](/html/1512.08305/assets/x11.png)