1\Yearpublication2015\Yearsubmission2015\Month0\Volume999\Issue0\DOIasna.201400000
XXXX
Seismic indices – a deep look inside evolved stars
Abstract
Independent of stellar modelling, global seismic parameters of red giants provide unique information on the individual stellar properties as well as on stellar evolution. They allow us to measure key stellar parameters, such as the stellar mass and radius, or to derive the distance of field stars. Furthermore, oscillations with a mixed character directly probe the physical conditions in the stellar core. Here, we explain how very precise seismic indices are obtained, and how they can be used for monitoring stellar evolution and performing Galactic archeology.
keywords:
Stars: oscillations - Stars: interiors - Stars: evolution1 Introduction
Red giant seismology is one of the exquisite surprise provided by the space missions CoRoT and Kepler. From, the analysis of long, continuous, ultra-precise photometric light curves, seismic indices can be derived from calibrated global seismic parameters that describe the oscillation pattern. They measure the properties of both the stellar envelope and the core. In this review, we focus on ensemble asteroseismology results that provide a wealth of global information. The analysis and modelling of individual stars have started for a handful of targets (e.g., di Mauro et al. 2011; Jiang et al. 2011; Baudin et al. 2012; Lillo-Box et al. 2014; Di Mauro et al. 2015) but are not presented here, despite the fact they are crucial for the deep understanding of the stellar interior structure and of the physical input to be considered, such as the measurement of the location of the helium second-ionization region (Miglio et al. 2010), or the measurement of differential rotation (Beck et al. 2012; Deheuvels et al. 2012). The global properties of the low-degree oscillation spectra used to derive relevant estimates of the stellar masses and radii are presented in Section 2. In Section 3, I show the rich information provided by the identification of mixed modes. They result from the coupling of gravity waves propagating in the radiative core region, with pressure waves mainly propagating in the stellar envelope, and directly reveal information from the stellar core (Bedding et al. 2011). A few results permitted by ensemble asteroseismic measurements are presented in Section 4.
2 Solar-like oscillations
Two seismic indices, the frequency of maximum oscillation signal and the frequency separation between radial modes, can be easily defined from the structure of the low-degree oscillation pressure pattern. In this Section, we intend to show how they can be precisely determined.
2.1 Gravity and convection
The empirical definition of is clear. However, measuring it is more difficult, partly because depends on the observable (intensity or velocity measurements provide two different values of since the translation of relative photometric amplitude to Doppler velocity depends on frequency). In fact, we lack a precise and non-empirical definition of . In practice, the maximum of oscillation signal comes from the minimum of the product , where is the damping rate and the inertia of the modes. (e.g., Balmforth 1992; Belkacem et al. 2012). This occurs when oscillation periods are equivalent to the thermal and convective time scales.
Observations show that provides a highly-precise measurement of the stellar gravity (e.g., Morel & Miglio 2012; Morel et al. 2014; Pinsonneault et al. 2014) since it scales as the acoustic cutoff frequency (Brown et al. 1991; Belkacem et al. 2011), hence as the ratio . This is verified for most of stars, except in some cases, as Procyon, where the oscillation excess power shows two humps (Arentoft et al. 2008). In the general case, from we get a reliable and precise proxy of .
2.2 Homology and universal pattern
The low-degree oscillation spectrum of red giant pressure modes follows, as for other stars, the asymptotic expansion (Tassoul 1980):
| (1) |
where is the radial order and is the angular degree. The asymptotic large separation measures the stellar acoustic radius. The asymptotic value of is 1/4. The second-order coefficients have a more complicate form.
CoRoT observations have evidenced a unique property of the red giant oscillation pattern: following the interior structure homology, the pattern can also be defined as homologous. The concept of universal red giant oscillation pattern was introduced by Mosser et al. (2011), as an alternative form to the usual asymptotic expansion (Tassoul 1980), with the observed large separation as the only free parameter. The second-order asymptotic expansion expresses as
| (2) |
where all the parameters depend either on or on the dimensionless parameter (Mosser et al. 2013c): the radial offset helps to locate the radial ridge; the non-radial offsets express the shifts of the different degrees compared to the radial modes (e.g., Corsaro et al. 2012); the term accounts for the second-order asymptotic expansion.
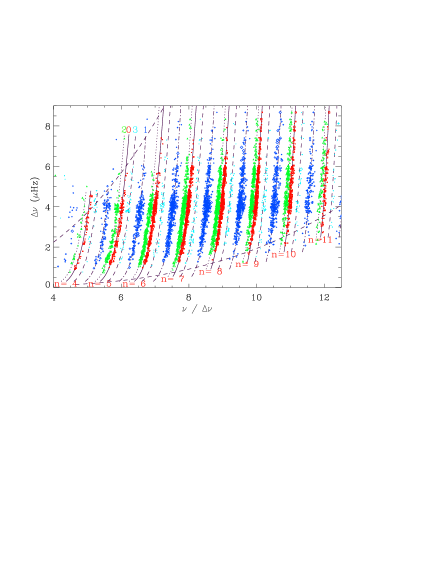
The signature of homology of red giants is illustrated in Fig. 1, where CoRoT red giant oscillation spectra sorted by increasing large separation values are plotted on the same graph, with a dimensionless frequency in abscissa. The alignment of the ridges, each one corresponding to a given radial order and angular degree , demonstrates the validity of Eq. (2). Contrarily, oscillation patterns in main-sequence stars could not be superposed.
Equation (2) accounts for the measurement of around . The asymptotic large separation corresponds to the frequency spacing at very high frequency, hence it cannot be measured. Its theoretical value is slightly larger than the observed value; the relationship between the observed and asymptotic parameters is studied in Mosser et al. (2013c). The high accuracy level reached by Eq. (2) has been shown in previous comparison work (e.g., Verner et al. 2011b; Hekker et al. 2012); the accuracy of the measurement of is better than Hz for all evolutionary stages (Mosser et al. 2013a).
The measurement of is however perturbed by a modulation due to the rapid local variation of the sound speed in the stellar interior, related to the density contrast at the core boundary or to the local depression of the sound speed that occurs in the helium second-ionization region (Miglio et al. 2010). The main signature of the glitch induces a modulation of the spectrum. Ensemble analysis of this glitch has shown how it can be modelled, depending on stellar evolution (Vrard et al. 2015a). This means that we can derive glitch-free measurement of the large separation. As a result, with the large separation measured in a broad frequency range, accounting for the second-order correction of the asymptotic correction, and corrected for glitch perturbation, the measurement of the large separation provides a reliable proxy of the square root of the mean density .
2.3 Scaling relations
Seismic relations with and can be used to provide proxies of the stellar masses and radii. The scaling relations write
| (3) |
| (4) |
where the calibrated references Hz and Hz are derived from the comparison with modelling (Mosser et al. 2013c), in contrast to many works that use the solar case as a reference (e.g., Verner et al. 2011a; Silva Aguirre et al. 2011; Stello et al. 2013). Large efforts are undertaken for calibrating Eqs. (3) and (4), since solar reference values provide biases in the red giant regime (e.g., White et al. 2011; Miglio et al. 2012; Epstein et al. 2014), as made clear since CoRoT observations (Kallinger et al. 2010; Mosser et al. 2010). Following Belkacem et al. (2013), we note that, for performing the calibration, it is necessary to avoid confusion between the large separation measured from radial modes observed around , the asymptotic large separation , and the dynamical frequency that scales with .
3 Dipole mixed modes
Mixed modes allow us to detect the gravity modes that probe the stellar core in a much more efficient way compared to the Sun (e.g., Belkacem et al. 2009).
3.1 Asymptotic expansion
Shibahashi (1979) and Unno et al. (1989) derived an implicit asymptotic relation for mixed modes in case of weak coupling, which expresses as
| (5) |
The phases and refer, respectively, to the pressure- and gravity-wave contributions, and is the coupling factor between them. Mosser et al. (2015) write them
| (6) |
where and are the asymptotic frequencies of pure pressure and gravity modes, respectively, is the frequency difference between two consecutive pure pressure radial modes (the subscript means that small variations of the large separation with the radial order can be accounted for), and is the asymptotic period spacing of gravity modes. Equation (6) can be used at any order of the asymptotic expansions for the pure pressure and gravity contributions. For instance, these expressions may include the signature of acoustic or buoyancy glitches (Mosser et al. 2015).
3.2 Period spacing and rotational splitting
The derivation of the implicit asymptotic expansion provides an analytical form of the period spacing between two consecutive mixed modes, which writes , with
| (7) |
Interestingly, this expression matches the first-order asymptotic expansion derived by Deheuvels et al. (2015) for expressing the mixed-mode rotational splitting. Following Goupil et al. (2013) and Deheuvels et al. (2015), the rotational splitting of mixed modes expresses
| (8) |
where and are the rotational splittings related to pure gravity or pure pressure modes. The measurement of rotational splittings and the derivation of the mean core rotation are discussed in Mosser et al. (2012b). Specific cases are discussed in Beck et al. (2012), Deheuvels et al. (2012), and Deheuvels et al. (2014).
3.3 Asymptotic period spacing
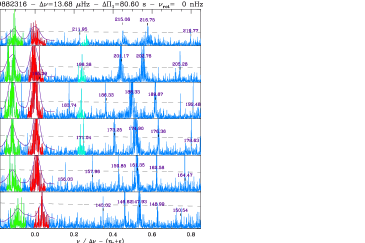
The previous developments provide the theoretical basis for the thorough understanding of the mixed modes. Following Mosser et al. (2015), the function is used to turn the frequencies into periods , with . From the integration of this change of variable we derive corrected periods of mixed modes, called stretched periods. Échelle diagrams based on show the structure of the gravity modes contributing to the mixed modes (Fig. 2). This allows the most accurate measurement of the asymptotic period spacing even when rotation splittings are important (Vrard et al. 2015b) and emphasizes the signature of the buoyancy glitches, namely rapid variation of the Brunt-Väisälä frequency in the radiative core.
4 Seismic indices
Global seismic parameters can be used as seismic indices for characterizing stars and performing ensemble asteroseimology.
4.1 Stellar evolution up to the AGB
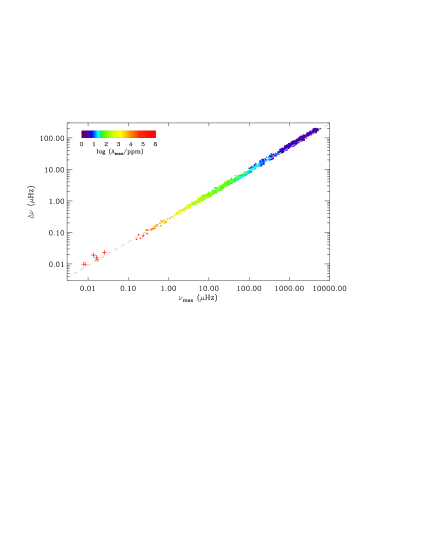
From the scaling relations Eqs. (3) and (4), we derive
| (9) |
On the red and asymptotic giant branches, all low-mass stars are present at all evolutionary stages, so that the mass play no role in this relation. Consequently, scales as (Fig. 3). The validity of Eq. (9) over more than six decades in frequency indicates that the stellar red giant populations observed by CoRoT or Kepler constitute a set of stars homogenous enough to mimic stellar evolution.
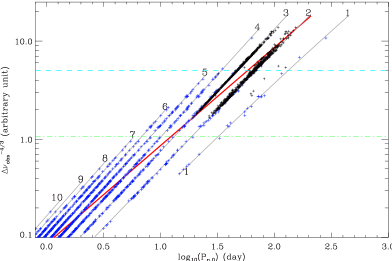
This result extrapolated to very low , with Eq. (2) iteratively adapted to fit the low-frequency oscillation spectra, was used for demonstrating that period-luminosity relations in semi-regular variables are drawn by low-degree low-radial-order solar-like oscillations (Mosser et al. 2013b). When the large separation decreases, the radial orders of the observed modes decrease too, down to (Fig. 4). Interpreting oscillations in semi-regular variables as solar-like oscillations can be used to investigate with a firm physical basis the time series obtained from ground-based microlensing surveys. This will provide improved distance measurements, since an accurate measurement of the stellar radius permits an accurate use of the Stefan-Boltzmann law, and opens the way to extragalactic asteroseismology, with the observations of M giants in the Magellanic Clouds. Mosser et al. (2013b) have also shown that the acceleration of the external layers of red giant with solar-like oscillations is about the same order of magnitude as the surface gravity when the stars reach the tip of the RGB: global oscillations play a role in the mass-loss process.
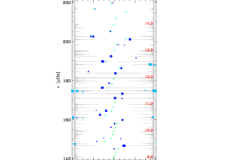
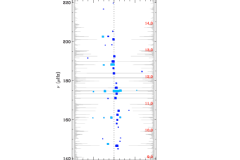
4.2 – diagram
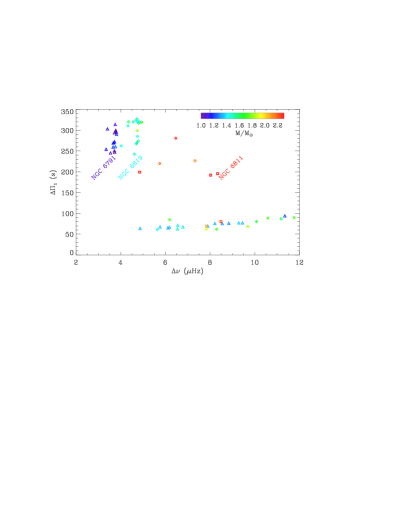
The measurement of provides a unique view on the physical properties in the stellar core (Mosser et al. 2012a) and reveals clear differences between evolutionary stages (Mosser et al. 2014). The analysis, now expanded to large populations by Vrard et al. (2015b) with about 5 000 red giants, shows the influence of the stellar mass and metallicity on the evolution on the RGB in the – diagram. In Fig. 5, we illustrate the mass dependence of the – relation for core-helium burning stars in three open clusters (Stello et al. 2010; Miglio et al. 2012). Evolution tracks largely depend on the mass, with massive stars in NGC 6811 in the secondary clump. Three stars of NGC 6819, much more massive than expected, are confirmed as blue stragglers (Corsaro et al. 2012). The highly precise evolutionary tracks in the – diagram can now be used to constrain stellar evolution modelling (e.g., Bossini et al. 2015; Lagarde et al. 2015).
4.3 Rotation
Rotation also benefitted from ensemble asteroseismology. Mosser et al. (2012b) have shown a significant spin-down of the core rotation with evolution on the RGB. Mechanisms able to efficiently transfer angular momentum from the core to the envelope have been investigated (e.g., Eggenberger et al. 2012); the role of mixed modes for spinning down the core rotation is underlined by Belkacem et al. (2015b, a). This topic, as all others, now benefit from supplementary non-seismic measurements and from theoretical developments, to make the best of seismic indices.
Acknowledgements.
We acknowledge the CoRoT and Kepler teams, whose efforts made these results possible. We acknowledge financial support from the Programme National de Physique Stellaire (CNRS/INSU) and from the ANR program IDEE.References
- Arentoft et al. (2008) Arentoft, T., Kjeldsen, H., Bedding, T. R., et al. 2008, ApJ, 687, 1180
- Balmforth (1992) Balmforth, N. J. 1992, MNRAS, 255, 603
- Baudin et al. (2012) Baudin, F., Barban, C., Goupil, M. J., et al. 2012, A&A, 538, A73
- Beck et al. (2012) Beck, P. G., Montalban, J., Kallinger, T., et al. 2012, Nature, 481, 55
- Bedding et al. (2011) Bedding, T. R., Mosser, B., Huber, D., et al. 2011, Nature, 471, 608
- Belkacem et al. (2012) Belkacem, K., Dupret, M. A., Baudin, F., et al. 2012, A&A, 540, L7
- Belkacem et al. (2011) Belkacem, K., Goupil, M. J., Dupret, M. A., et al. 2011, A&A, 530, A142
- Belkacem et al. (2015a) Belkacem, K., Marques, J. P., Goupil, M. J., et al. 2015a, A&A, 579, A31
- Belkacem et al. (2015b) Belkacem, K., Marques, J. P., Goupil, M. J., et al. 2015b, A&A, 579, A30
- Belkacem et al. (2009) Belkacem, K., Samadi, R., Goupil, M. J., et al. 2009, A&A, 494, 191
- Belkacem et al. (2013) Belkacem, K., Samadi, R., Mosser, B., Goupil, M.-J., & Ludwig, H.-G. 2013, in Astronomical Society of the Pacific Conference Series, Vol. 479, Progress in Physics of the Sun and Stars: A New Era in Helio- and Asteroseismology, ed. H. Shibahashi & A. E. Lynas-Gray, 61
- Bossini et al. (2015) Bossini, D., Miglio, A., Salaris, M., et al. 2015, MNRAS, 453, 2290
- Brown et al. (1991) Brown, T. M., Gilliland, R. L., Noyes, R. W., & Ramsey, L. W. 1991, ApJ, 368, 599
- Corsaro et al. (2012) Corsaro, E., Stello, D., Huber, D., et al. 2012, ApJ, 757, 190
- Deheuvels et al. (2015) Deheuvels, S., Ballot, J., Beck, P. G., et al. 2015, A&A, 580, A96
- Deheuvels et al. (2014) Deheuvels, S., Doğan, G., Goupil, M. J., et al. 2014, A&A, 564, A27
- Deheuvels et al. (2012) Deheuvels, S., García, R. A., Chaplin, W. J., et al. 2012, ApJ, 756, 19
- di Mauro et al. (2011) di Mauro, M. P., Cardini, D., Catanzaro, G., et al. 2011, MNRAS, 415, 3783
- Di Mauro et al. (2015) Di Mauro, M. P., Ventura, R., Cardini, D., et al. 2015, ArXiv e-prints
- Eggenberger et al. (2012) Eggenberger, P., Montalbán, J., & Miglio, A. 2012, A&A, 544, L4
- Epstein et al. (2014) Epstein, C. R., Elsworth, Y. P., Johnson, J. A., et al. 2014, ApJ, 785, L28
- Goupil et al. (2013) Goupil, M. J., Mosser, B., Marques, J. P., et al. 2013, A&A, 549, A75
- Hekker et al. (2012) Hekker, S., Elsworth, Y., Mosser, B., et al. 2012, A&A, 544, A90
- Jiang et al. (2011) Jiang, C., Jiang, B. W., Christensen-Dalsgaard, J., et al. 2011, ApJ, 742, 120
- Kallinger et al. (2010) Kallinger, T., Weiss, W. W., Barban, C., et al. 2010, A&A, 509, A77
- Kiss et al. (2006) Kiss, L. L., Szabó, G. M., & Bedding, T. R. 2006, MNRAS, 372, 1721
- Lagarde et al. (2015) Lagarde, N., Bossini, D., Miglio, A., Vrard, M., & Mosser, B. 2015, ArXiv e-prints
- Lillo-Box et al. (2014) Lillo-Box, J., Barrado, D., Moya, A., et al. 2014, A&A, 562, A109
- Miglio et al. (2012) Miglio, A., Brogaard, K., Stello, D., et al. 2012, MNRAS, 419, 2077
- Miglio et al. (2010) Miglio, A., Montalbán, J., Carrier, F., et al. 2010, A&A, 520, L6
- Morel & Miglio (2012) Morel, T. & Miglio, A. 2012, MNRAS, 419, L34
- Morel et al. (2014) Morel, T., Miglio, A., Lagarde, N., et al. 2014, A&A, 564, A119
- Mosser et al. (2011) Mosser, B., Belkacem, K., Goupil, M., et al. 2011, A&A, 525, L9
- Mosser et al. (2010) Mosser, B., Belkacem, K., Goupil, M., et al. 2010, A&A, 517, A22
- Mosser et al. (2013a) Mosser, B., Belkacem, K., & Vrard, M. 2013a, in EAS Publications Series, Vol. 63, EAS Publications Series, ed. G. Alecian, Y. Lebreton, O. Richard, & G. Vauclair, 137–150
- Mosser et al. (2014) Mosser, B., Benomar, O., Belkacem, K., et al. 2014, A&A, 572, L5
- Mosser et al. (2013b) Mosser, B., Dziembowski, W. A., Belkacem, K., et al. 2013b, A&A, 559, A137
- Mosser et al. (2012a) Mosser, B., Goupil, M. J., Belkacem, K., et al. 2012a, A&A, 540, A143
- Mosser et al. (2012b) Mosser, B., Goupil, M. J., Belkacem, K., et al. 2012b, A&A, 548, A10
- Mosser et al. (2013c) Mosser, B., Michel, E., Belkacem, K., et al. 2013c, A&A, 550, A126
- Mosser et al. (2015) Mosser, B., Vrard, M., Belkacem, K., Deheuvels, S., & Goupil, M. J. 2015, A&A, 584, A50
- Pinsonneault et al. (2014) Pinsonneault, M. H., Elsworth, Y., Epstein, C., et al. 2014, ApJS, 215, 19
- Shibahashi (1979) Shibahashi, H. 1979, PASJ, 31, 87
- Silva Aguirre et al. (2011) Silva Aguirre, V., Chaplin, W. J., Ballot, J., et al. 2011, ApJ, 740, L2
- Stello et al. (2010) Stello, D., Basu, S., Bruntt, H., et al. 2010, ApJ, 713, L182
- Stello et al. (2013) Stello, D., Huber, D., Bedding, T. R., et al. 2013, ApJ, 765, L41
- Tassoul (1980) Tassoul, M. 1980, ApJS, 43, 469
- Unno et al. (1989) Unno, W., Osaki, Y., Ando, H., Saio, H., & Shibahashi, H. 1989, Nonradial oscillations of stars, ed. Unno, W., Osaki, Y., Ando, H., Saio, H., & Shibahashi, H.
- Verner et al. (2011a) Verner, G. A., Chaplin, W. J., Basu, S., et al. 2011a, ApJ, 738, L28
- Verner et al. (2011b) Verner, G. A., Elsworth, Y., Chaplin, W. J., et al. 2011b, MNRAS, 415, 3539
- Vrard et al. (2015a) Vrard, M., Mosser, B., Barban, C., et al. 2015a, A&A, 579, A84
- Vrard et al. (2015b) Vrard, M., Mosser, B., & Samadi, R. 2015b, ArXiv e-prints
- White et al. (2011) White, T. R., Bedding, T. R., Stello, D., et al. 2011, ApJ, 743, 161