Quasi-two-dimensional complex plasma containing spherical particles and their binary agglomerates
Abstract
A new type of quasi-two-dimensional complex plasma system was observed which consisted of monodisperse microspheres and their binary agglomerations (dimers). The particles and their dimers levitated in a plasma sheath at slightly different heights and formed two distinct sublayers. The system did not crystallize and may be characterized as disordered solid. The dimers were identified based on their characteristic appearance in defocused images, i.e., rotating interference fringe patterns. The in-plane and inter-plane particle separations exhibit nonmonotonic dependence on the discharge pressure which agrees well with theoretical predictions.
pacs:
52.27.Lw, 61.20.Ja, 64.70.DvComplex plasma is considered as a unique model system in soft matter physics where solid charged particles (dust) form a suspension in the background of weakly ionized plasma Morfill_RMP ; Morfill:lowen ; Morfill:pop ; Chaudhuri_SM . Typically, the dust particles are large enough (m) to be visualized individually which allow experimental investigations with high temporal and spatial resolution in terms of the appropriate plasma frequency and particle separation. The dynamics of each particle can be tracked precisely after analyzing the image sequences taken by video camera. In the strong coupling regime, complex plasma forms “crystals” which can be arranged in 2D and 3D structures Thomas-Nature-1996 ; Fortov2005PR ; Chu_PRL ; Thomas_PRL . In particular, the 2D crystal has been used extensively to investigate various generic processes associated with strong coupling phenomena such as crystallization Hartmann_PhysRevLett.105.115004 , melting Quinn_PhysRevE.64.051404 ; Nosenko_PhysRevLett.93.155004 ; Nosenko_PhysRevLett.103.015001 ; Feng_PhysRevLett.104.165003 , dislocation dynamics Nosenko_PhysRevLett.99.025002 , recrystallization Knapek_PhysRevLett.98.015004 , Mach cones Samsanov_PhysRevE.61.5557 , dynamical heterogeneity Juan_PhysRevE.64.016402 , transport phenomena such as heat conductivity Nunomura_PhysRevLett.95.025003 , viscosity Nosenko_PhysRevLett.93.155004 , superdiffusion Liu_PhysRevLett.100.055003 , etc. Quasi-2D systems consisting of two different types of monodisperse particles have also been explored ivlev_PhysRevX ; Hyde_PhysRevE . Additionally, kinetics of phase transition such as crystallization front propagation Zuzic:Naturephysics , fluid-solid transition under microgravity Khrapak:PhysRevLett.106.205001 ; Khrapak:PhysRevE.85.066407 , lane formation Du:1367-2630-14-7-073058 , etc have been investigated in 3D plasma crystals.
The goal of this paper is to explore the structural properties of a quasi-2D suspension (a mixture of spherical particles and their binary agglomerates), which can be created at the centre using controlled systematic partial purification method. Defocused imaging technique has been used as a simple but powerful diagnostic to identify binary agglomerates in complex plasmas APL_Manis . Unlike spherical particles, the defocused images of binary agglomerates (two spherical particles together or dimers) contain stationary/spinning interference fringe patterns. This technique has been exploited to create quasi-2D suspension as a binary mixture of normal spherical particles and their binary agglomerates using only one type of particles (of specific size) in a controlled process. In quasi-2D systems, the vertical separation between particles (d) is much less than their in-plane interparticle separation and the top view image should contain all the particles (i.e., there should not be vertical pairing). The static structural properties of both regions have been compared. It is found that the presence of binary agglomerates makes the quasi-2D suspension deformed disordered solid. The deformation (ratio of horizontal and vertical interparticle separations) has been measured over a wide range of neutral gas pressure.
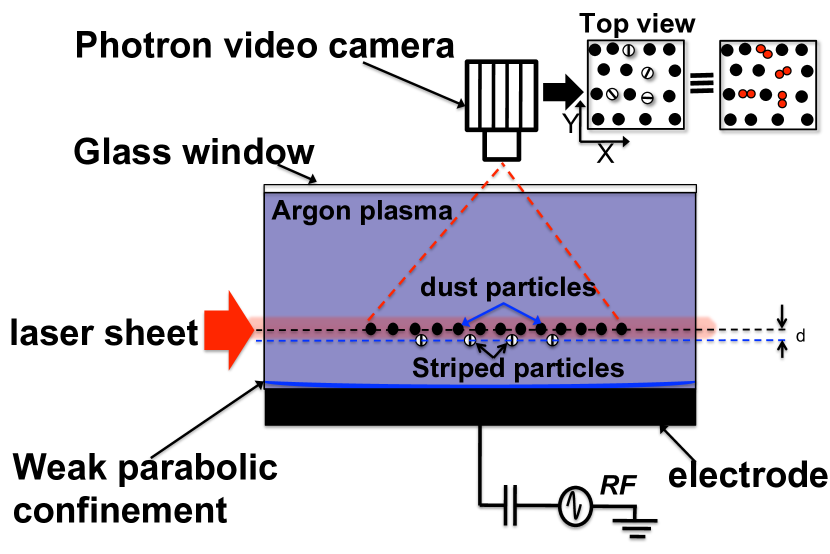
The experiments were performed with a (modified) Gaseous Electronics Conference (GEC) chamber, in a capacitively coupled rf glow discharge at 13.56 MHz (see Fig. 1). The top and side windows of the chamber provide access for the video recording and laser illumination system. In the injection phase, the melamine formaldehyde particles with diameter of 7.1 m have been inserted into the plasma using a dispenser at a neutral gas pressure of 0.66 Pa and rf power of 20 W. In this phase, along with spherical dust particles, the impurities in the form of heavy agglomerates or asymmetric particles are also present. They levitate below the monolayer of monodisperse spherical particles at different heights at the central part of the discharge chamber due to their charge-to-mass ratio. Using defocused imaging technique, it is found that there are mainly three types of particles in the system: monodisperse spherical particles, dimers with dark stationary/rotating interference fringes and much heavier particles without interference fringe patterns. Then neutral gas pressure is increased up to 1.34 Pa and “purification” process is started through which all these bigger/asymmetric particles can be dropped on the lower electrode. In case of “complete” purification, all these heavier particles should drop on the lower electrode and a monolayer of only one type of spherical particles can be formed (2D suspension). But, in case of “partial” purification, only heavier particles are removed and a quasi-2D suspension can be formed as a binary mixture of spherical particles and their binary agglomerates (dimers) as shown in Fig. 1. In this case, the spherical particles form a quasi-monolayer above the central part of the rf electrode, with the striped particles levitating in a layer just below the monolayer with vertical separation, d , the interparticle separation in monolayer. However, the 2D suspension of spherical particles exists at the periphery. The particle suspension was illuminated with a horizontal sheet of red diode laser light (wavelength of 660 nm) and imaged through the top glass window with a Photron FASTCAM 1024 PCI camera operating at a speed of 60 frames/s with a field of view of 1024 x 1024 pixels. Both quasi-2D and 2D suspension have been imaged simultaneously. The camera lens was equipped with a narrow-band interference filter to collect only the illumination laser light scattered by the particles.
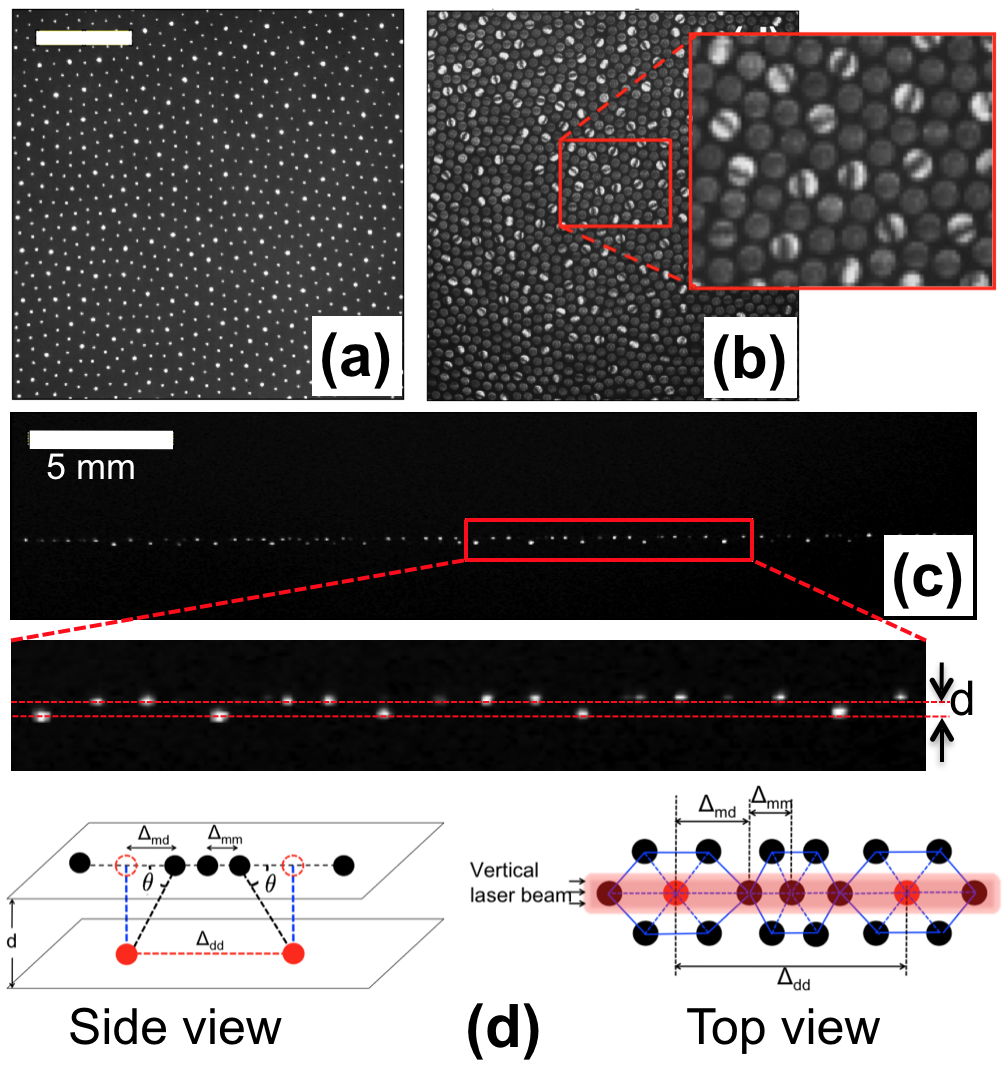
Observation: Unlike spherical particles, the binary agglomerates (dimers) can be identified instantly by looking at their top-view defocused images which contain dark stationary/spinning interference fringe patterns (striped particles). This particular characteristic of the binary agglomerates has been used to create quasi-2D suspension in a controlled manner. After partial purification, the maximum intensity of the laser beam is placed at the plane of binary agglomerates. Then in the focused image, these particles appear brighter compared to the spherical particles. To check whether all these particles are indeed the binary agglomerates, we take defocused images after each purification. When all the brighter particles seem to contain rotating interference fringe patterns on their defocused images, we stop further purification. The defocused top-view images of such brighter particles are shown in Fig. 3. Then we come up with quasi-2D suspension as a binary mixture of spherical particles and their binary agglomerates (dimers) at the central part of the electrode. It is found that the maximum number of dimers are present for 7 micron particles () followed by 8 microns (), 11 microns () and 9 micron particles (). It is found that the vertical separation between monomers and dimers can be estimated with an accuracy . Systematic investigations show that the dimers also influence the melting of crystal in the centre. It is very difficult to sustain quasi-2D suspension at lower pressure (below 1 Pa) when the number density of dimers is high () compared to monomers.
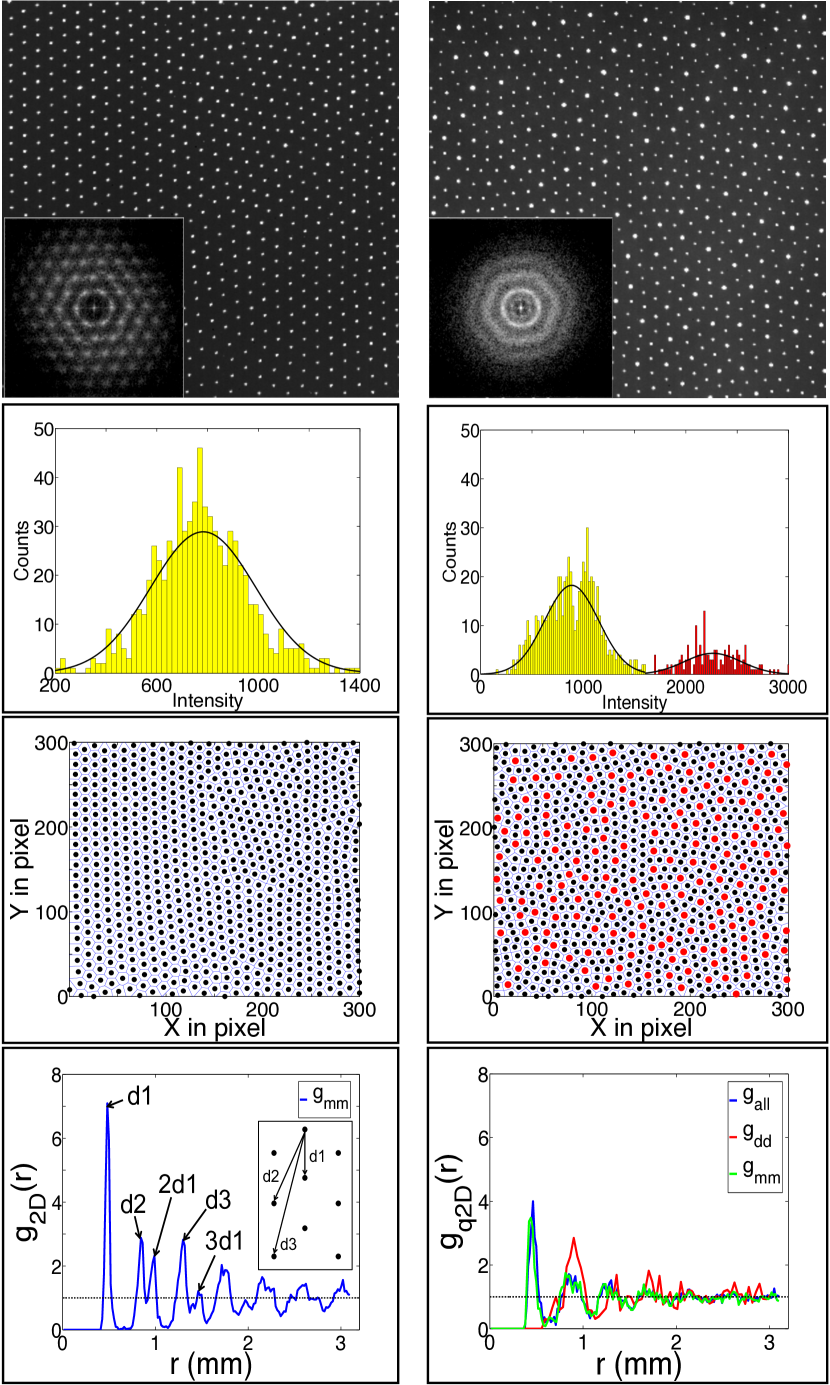
The systematic analysis has been performed after partial purification as shown in Fig. 4. The first task to analyze quasi-2D suspension is to distinguish dimers from monomers. This has been achieved by taking top view image of the quasi-2D crystal where the laser is placed in the plane of dimers with maximum intensity so that dimers appear much brighter than the monomers. This is possible as the vertical separation between monomers and dimers is m which is larger than the laser beam width (). Then we plot the histogram of the intensity profile of such a top-view image which clearly shows two populations of particles with different intensities. Clearly, the less populated brighter particles are dimers and the highly populated but less bright particles are spheres. The two types of particles have been color coded: red particles with higher intensity are dimers and black particles with low intensity are spheres. The voronoi diagram has been made along with positions of particles. In 2D suspension, the voronoi cells are uniform, hexagonally symmetric. In quasi-2D suspension, a large number of defects (five-, seven-, eight-fold) appear along with hexagonal voronoi cells. However, in this case most of the hexagonal voronoi cells are deformed.
The local deformation in the disordered quasi-2D suspension exhibits the caged particle dynamics of dimers surrounded by five-, six-, seven-, eight-, etc. spherical particles with unequal bond lengths. The presence of dimers as caged particles increases with particle diameter. Sometimes the dimers also form hexagonal symmetry along with monomers. In the central part of the crystal, the dimers form islands surrounded by monomers. These are the local deformed structures created by the presence of dimers. The dimers may act as the local source of energy due to their dynamics which can be an alternate mechanism for crystal melting. The higher the number of dimers (more than 15 - 20 %) in quasi-2D suspension, the easier it melts at low pressure (below 1 Pa).
To proceed with structural analysis for both systems, we computed radial distribution function for a single image. The crystalline structure in 2D-crystal is evident from the first sharp peak of which corresponds to the position of nearest neighbors and the area of which gives the coordination number. In our case, the nearest interparticle distance d1 481 m. The characteristic splitting of second peak should correspond to the second (d2 = m) and third (m) neighbor distances in the second coordination shell. In our case, the second and third peaks appear at 840 m and 989 m. The other peaks appear at d3 1.298 m and 3d1 1.461 m. At large distances, the peaks broaden as well as merge with each other and become lost in the continuum background 1. The structural properties of change drastically in quasi-2D suspension. The presence of dimers destroys the crystalline order made by the monomers. The height of the first peak of the decreases by 40%, although the position almost remains the same. The system approaches a fluid state. This can be attributed to the growing number of structural defects with increasing temperature. After distinguishing dimers from spheres, it is possible to compute separately for monomers , for dimers , and for both, . The position of the first peak of is 440 m, which is very close to that of (r) 463 m. The first peak of , which is lower and wider also appears for dimers at 900 m. In this system, 1 much faster than , which implies that quasi-2D suspension (binary mixture of spheres and dimers) is much hotter than the 2D suspension made of monodisperse spheres. This is also evident from the FFT analysis of ROI’s as shown in the Fig. 4.
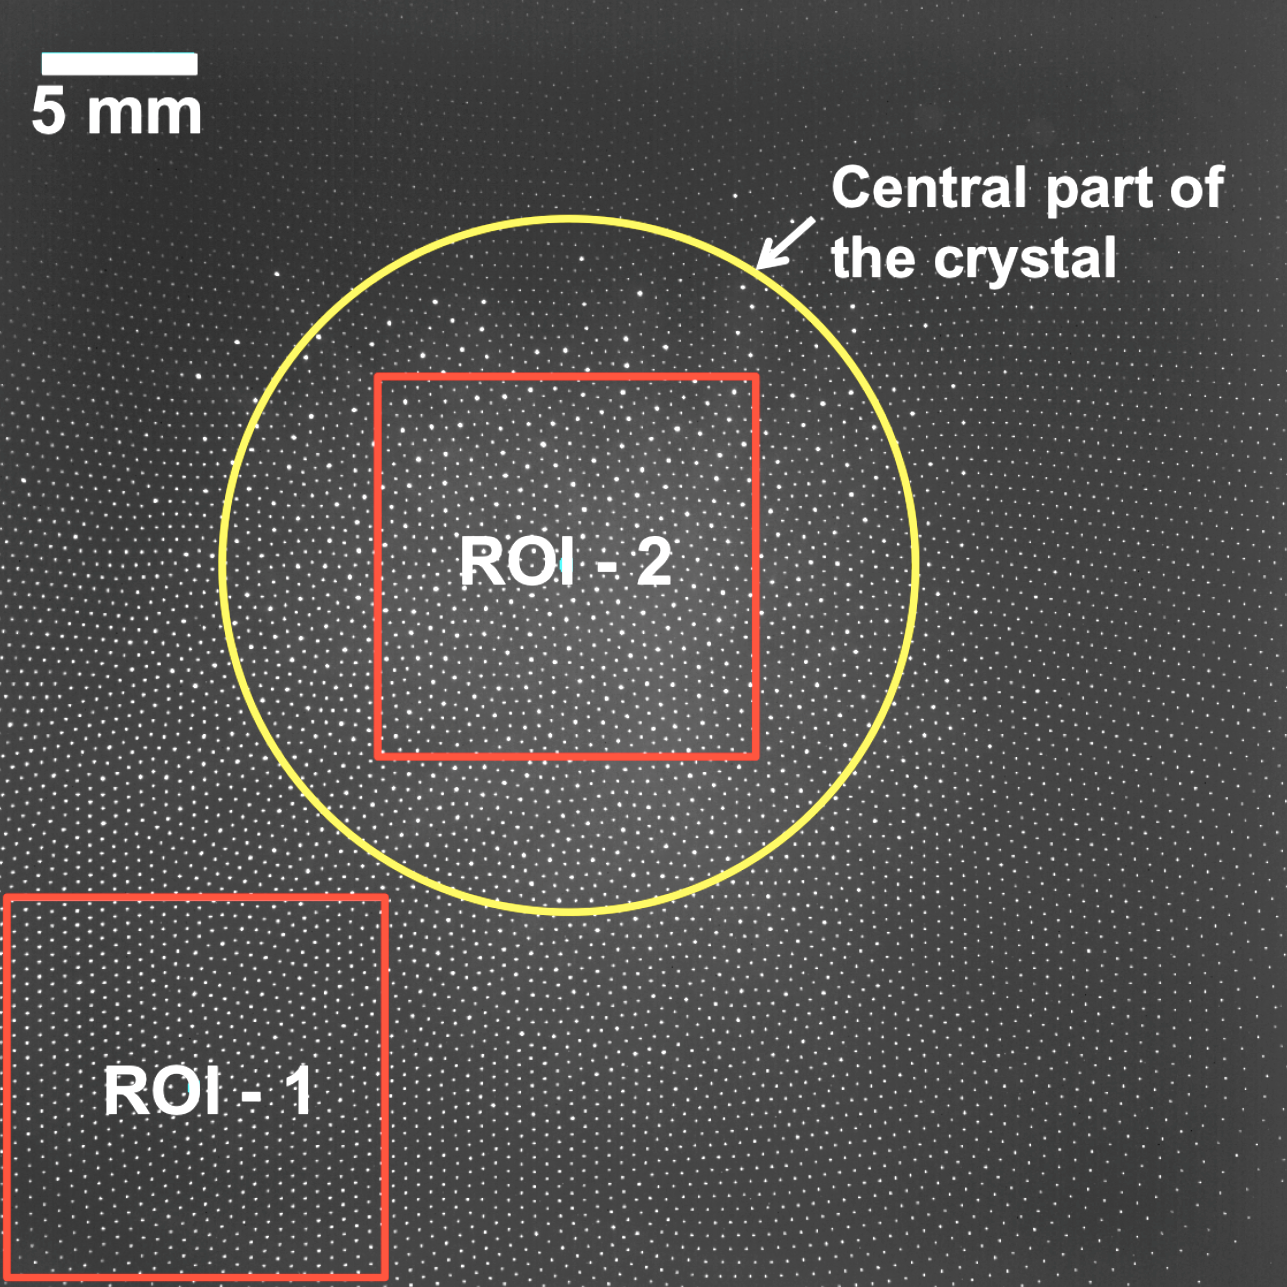
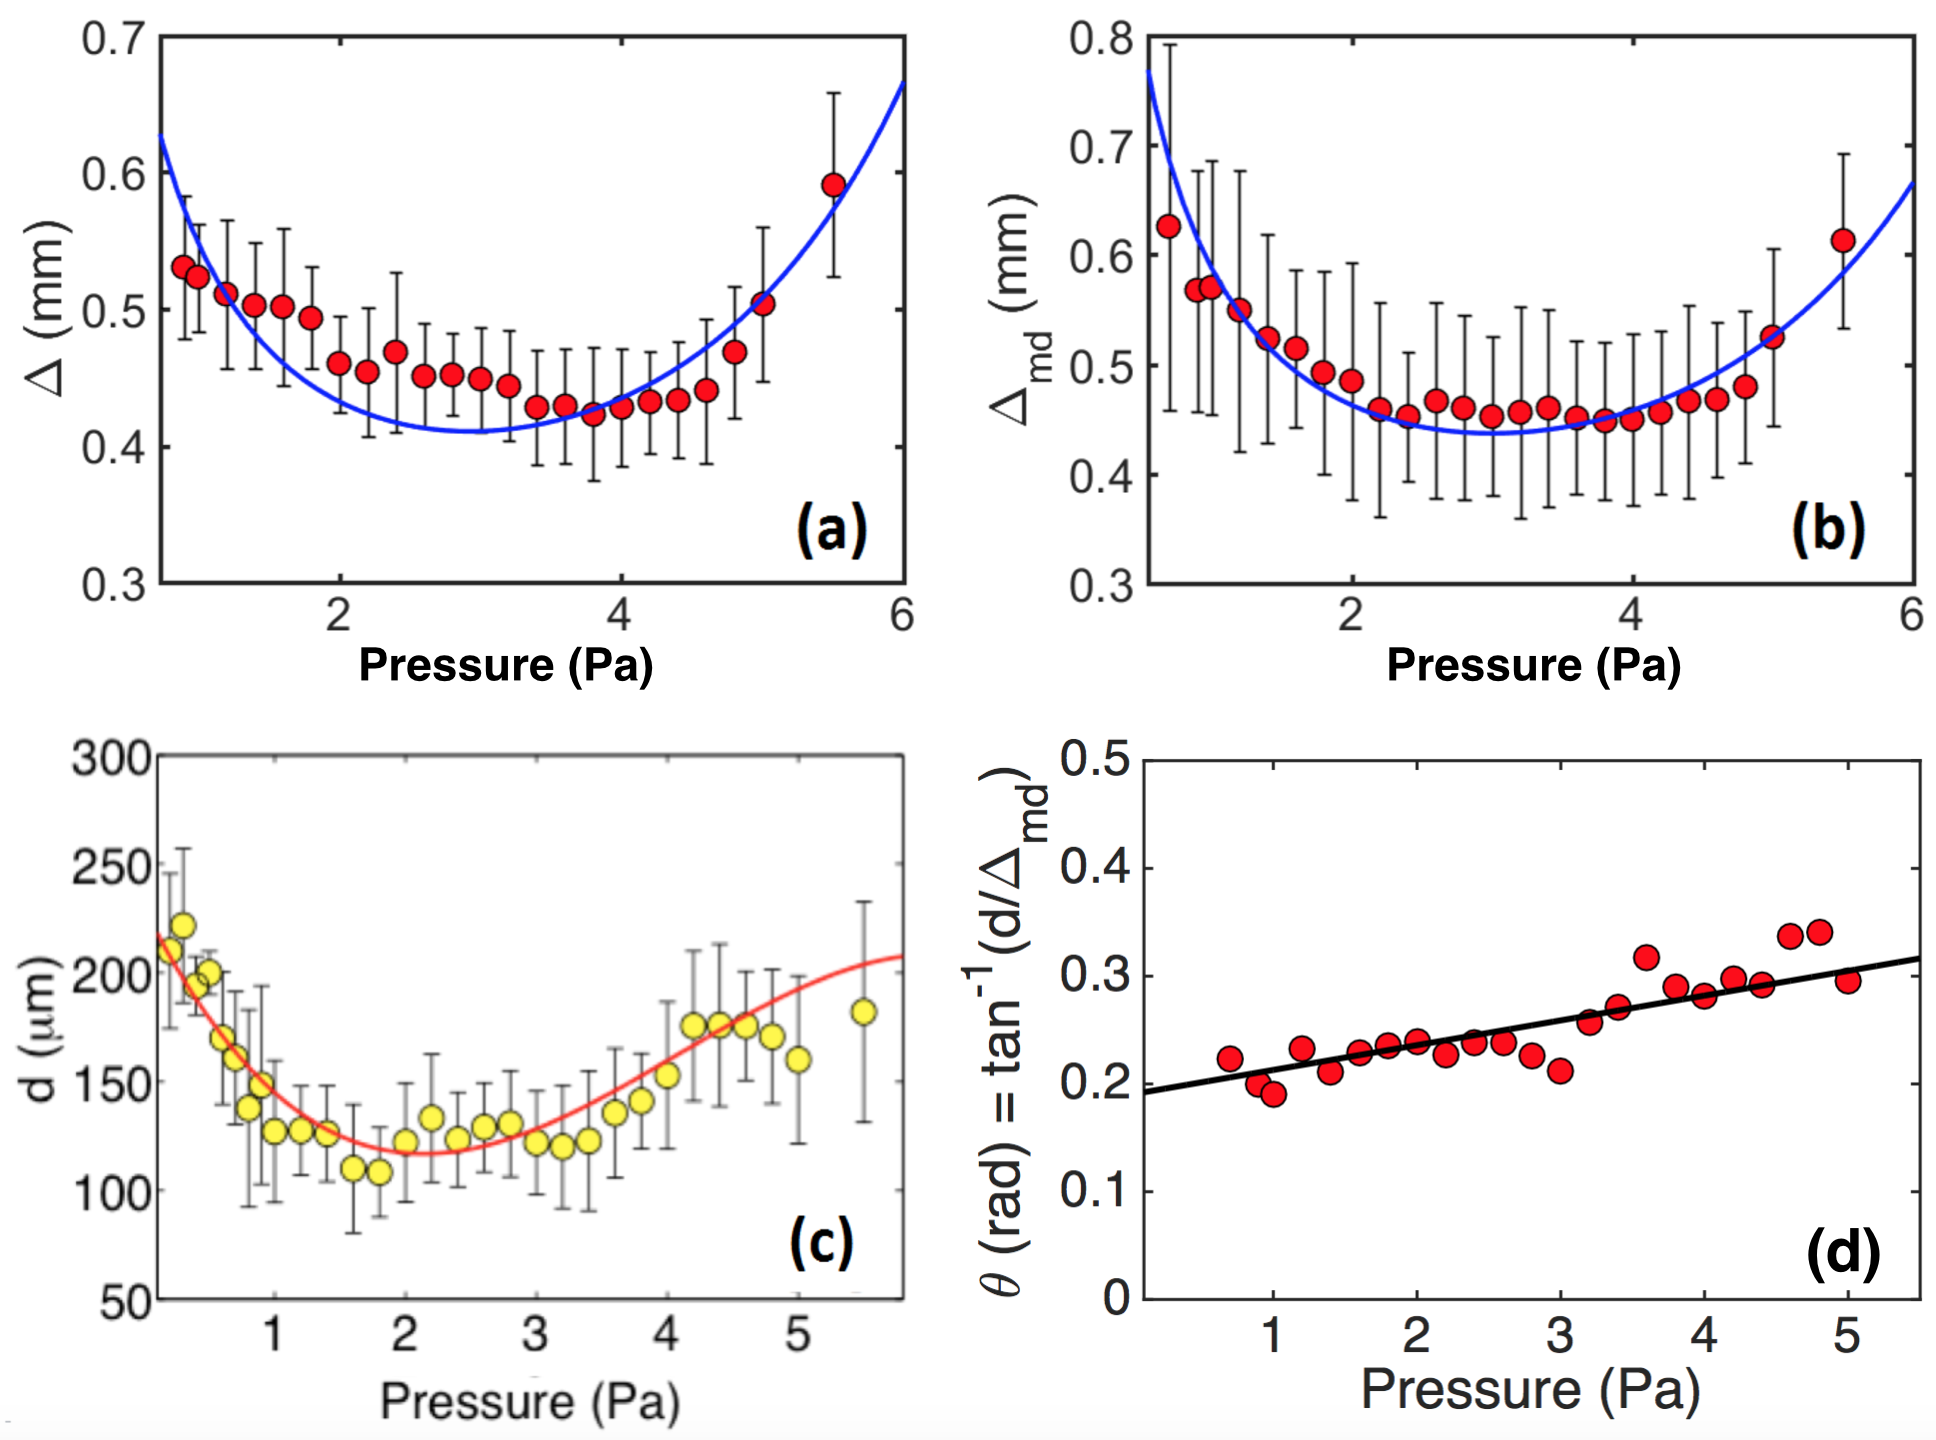
The dependencies of in-plane interparticle separation on neutral gas pressure (ion-neutral collisionality) have been measured in both ROI-1 and ROI-2 by looking at the position of the first peak of pair-correlation function, . The first peak of has been fitted with gaussian distribution and the FWHM gives the errors in measurements. It is found that initially decreases monotonically with pressure in both cases but after reaching a minimum at Pa it increases again. However, it is to be noted that the two types of particles (monomers and dimers) are present in ROI-2 in different vertical planes, i.e., we can measure interparticle separation for spherical particles () and dimers () separately. It is to be noted that the local structure of monomers with at least one dimer is deformed in 3D structure. Since the vertical separation (d) laser width, we can illuminate both planes with maximum laser intensity. The vertical movement of the illumination laser can be monitored through a scale with minimum division of 10 m. To achieve minimum error, each data point corresponds to 20 measurements. Then the average value and standard deviations have been calculated. But if we measure between spherical particles and dimers, then we should be careful as it represents the projection of actual on the plane of dimers. However, this measurement can be used to measure local deformation in ROI-2 if sphere-dimer vertical separation can be measured as well. The deformation in ROI-2 can be quantified in the form of angle . The dependencies of , and on neutral gas pressure are shown in Fig. 5d. It is found that is independent of number of dimers. At low pressure (below 0.7 Pa), it can be measured in presence of very few dimers. In this regime, it is not possible to sustain quasi-2D crystal with significant dimers (more than 10 - 20 %) as it melts. On the other hand, at higher pressure (above 3 Pa) the dimers start to disperse toward periphery. In this regime, and can be measured in presence of few dimers. In the intermediate regime ( 0.7 - 3 Pa), dimer concentration is high in the central part of the electrode and we can measure using .
The experimental results can be interpreted using an estimate based on the theoretical model proposed by Totsuji et al. totsuji2001structure . Namely, let us consider a two-dimensional layer of dust particles which is formed
in a cylindrical discharge. Let us also make the following assumptions: the particles have a negative
charge with absolute value and interact via a Yukawa potential with a screening length ; the particles are distributed uniformly with a constant surface density; the transverse confinement potential can be written as
, where is the distance from the discharge axis of symmetry. According to totsuji2001structure , the
interparticle distance in this case is given by
| (1) |
where is the number of particles and is a dimensionless parameter given by . In typical experimental conditions, the screening length is close to the electron Debye length, i.e., , where and are the electron density and temperature in plasma, respectively. The dust particle charge can be calculated as , where is the particle radius and is the particle surface potential obtained from the orbital motion limited theory.
The confinement stiffness can be estimated using the following considerations. The distribution of the electric potential near the axis of symmetry can be found from the Boltzmann relation
| (2) |
where is the electron concentration on the axis of symmetry. The distribution of near the axis of symmetry can be found from the solution of the drift-diffusion equations. This well-known solution is given by
| (3) |
where is the zero order Bessel function and is the characteristic length defined as
| (4) |
where is the Bohm velocity, is the concentration of neutrals, and are the ionization rate and ion-atom momentum exchange rate, respectively. Here, the Bohm velocity is defined as , where and are the temperature and mass of heavy particles (ions and atoms), respectively. The ionization rate can be evaluated using the corresponding expression for the direct ionization process presented, e.g., in almeida2000simulation . The ion-atom momentum exchange rate is given by
, where is the averaged momentum-transfer cross section. For argon, this cross-section can be evaluated using the results of devoto1973transport .
For typical conditions, the radial size of the layer is several times smaller than . In this case the Bessel function in Eq. (3) can be approximated as
| (5) |
Using Eqs. (2), (3) and (5), one can obtain the following expression for the potential distribution near the axis:
| (6) |
Therefore, the stiffness parameter is given by
| (7) |
Different diagnostics show that the pressure dependence of electron temperature and density can be scaled linearly: and where is in and is in Pa. The values of the coefficients and varies over discharge conditions. For DC discharge plasmas in the weakly collisional regime, Khrapak_PhysRevE.72.016406 and for highly collisional regime, Khrapak_EPL_2012 . For RF discharge plasmas, and Lenaic .
However, it is found that the pressure variations of and in our work are not sensitive to electron density but depends strongly on . No experimental data is available for , but the coefficients , and can be adjusted numerically in such a way that the pressure dependence of the interparticle distance is well described by Eq. (1). As an example, we show in Fig. 5a the comparison between our theoretical estimates and the experimental data obtained for in ROI-1. It can be seen in Fig. 5(a) that our theoretical model is in reasonable agreement with the experimental measurements. It is interesting to note that the pressure dependence of the projection
in ROI-2 is also described reasonably well by Eq. (1) (see Fig. 5b), despite the fact that this equation was originally derived for monomer systems.
In conclusion, the structural analysis of quasi-2D suspension (binary mixture of spheres and dimers) has been presented and compared with 2D suspension made of spherical particles. First, we have used systematic partial purification to create quasi-2D suspension in the centre and 2D suspension at the periphery of the same system of investigation. A defocused imaging technique is used to identify binary agglomerates (dimers) which have a rotating interference fringe pattern on that defocused image, unlike spherical particles. Then, taking advantage of higher vertical separation between monomers and dimers compared to laser sheet thickness, we have identified and separated the dimers at the individual particle level. It is found that the presence of dimers destroys the crystalline order made by the spherical particles by creating defects and the system enters into a disordered solid state as evident from the radial distribution function and structure factor analysis. We have observed nonmonotonic dependences of in-plane interparticle separation, sphere-dimer separations, as well as vertical sphere-dimer separations. The experimental measurements of in-plane interparticle separations agree well with theoretical predictions. However, to explain the dependence of vertical separation on pressure, the wake effect should be taken into account, which is beyond the scope of present paper and left for future work.
Acknowledgement: M.C is supported by Marie-Curie international outgoing fellowship (IOF) under EU 7th framework programme.
References
- (1) G. E. Morfill and A. V. Ivlev, Rev. Mod. Phys. 81, 1353 (2009).
- (2) A. Ivlev, H. Löwen, G. Morfill, and C. P. Royall, Complex plasmas and colloidal dispersions: Particle-resolved studies of classical liquids and solids (World Scientific, Singapore, 2012).
- (3) G. E. Morfill, A. V. Ivlev, and H. M. Thomas, Physics of Plasmas 19, 055402 (2012).
- (4) M. Chaudhuri, A. V. Ivlev, S. A. Khrapak, H. M. Thomas, and G. E. Morfill, Soft Matter 7, 1229 (2011).
- (5) H. M. Thomas and G. E. Morfill, Nature (London) 379, 806 (1996).
- (6) V. E. Fortov, A. V. Ivlev, S. A. Khrapak, A. G. Khrapak, and G. E. Morfill, Phys. Reports 421, 1 (2005).
- (7) J. H. Chu and L. I, Phys. Rev. Lett. 72, 4009 (1994).
- (8) H. Thomas, G. E. Morfill, V. Demmel, J. Goree, B. Feuerbacher,and D.Möhlmann,Phys.Rev.Lett.73,652 (1994).
- (9) P. Hartmann, A. Douglass, J. C. Reyes, L. S. Matthews, T. W. Hyde, A. Kovacs, and Z. Donko, Phys. Rev. Lett. 105, 115004 (2010).
- (10) R. A. Quinn and J. Goree, Phys. Rev. E 64, 051404 (2001).
- (11) V. Nosenko and J. Goree, Phys. Rev. Lett. 93, 155004 (2004).
- (12) V. Nosenko, S. K. Zhdanov, A. V. Ivlev, C. A. Knapek, and G. E. Morfill, Phys. Rev. Lett. 103, 015001 (2009).
- (13) Y. Feng, J. Goree, and B. Liu, Phys. Rev. Lett. 104, 165003 (2010).
- (14) V. Nosenko, S. Zhdanov, and G. Morfill, Phys. Rev. Lett. 99, 025002 (2007).
- (15) C. A. Knapek, D. Samsonov, S. Zhdanov, U. Konopka, and G. E. Morfill, Phys. Rev. Lett. 98, 015004 (2007).
- (16) D. Samsonov, J. Goree, H. M. Thomas, and G. E. Morfill, Phys. Rev. E 61, 5557 (2000).
- (17) W.-T. Juan, M.-H. Chen, and L. I, Phys. Rev. E 64, 016402 (2001).
- (18) S. Nunomura, D. Samsonov, S. Zhdanov, and G. Morfill, Phys. Rev. Lett. 95, 025003 (2005).
- (19) B. Liu and J. Goree, Phys. Rev. Lett. 100, 055003 (2008).
- (20) A. V. Ivlev, J. Bartnick, M. Heinen, C.-R. Du, V.Nosenko,andH.Löwen,Phys.Rev.X5,011035 (2015).
- (21) K. Qiao, J. Kong, J. Carmona-Reyes, L. S. Matthews, and T. W. Hyde, Phys. Rev. E 90, 033109 (2014).
- (22) M. Rubin-Zuzic, G. E. Morfill, A. V. Ivlev, R. Pompl, B. A. Klumov, W. Bunk, H. M. Thomas, H. Rothermel, O. Havnes, and A. Fouquet, Nat Phys 2, 181 (2006).
- (23) S. A. Khrapak, B. A. Klumov, P. Huber, V. I. Molotkov, A. M. Lipaev, V. N. Naumkin, H. M. Thomas, A. V. Ivlev, G. E. Morfill, O. F. Petrov, et al., Phys. Rev. Lett. 106, 205001 (2011).
- (24) S. A. Khrapak, B. A. Klumov, P. Huber, V. I. Molotkov, A. M. Lipaev, V. N. Naumkin, A. V. Ivlev, H. M. Thomas, M. Schwabe, G. E. Morfill, et al., Phys. Rev. E 85, 066407 (2012).
- (25) C.-R. Du, K. R. Sütterlin, K. Jiang, C. Ra?th, A. V. Ivlev, S. Khrapak, M. Schwabe, H. M. Thomas, V. E. Fortov, A. M. Lipaev, et al., New Journal of Physics 14, 073058 (2012).
- (26) M. Chaudhuri, V. Nosenko, C. Knapek, U. Konopka, A. V. Ivlev, H. M. Thomas, and G. E. Morfill, Applied Physics Letters 100, 264101 (2012).
- (27) H. Totsuji, C. Totsuji, and K. Tsuruta, Phys. Rev. E 64, 066402 (2001).
- (28) R. Almeida, M. Benilov, and G. Naidis, J. Phys. D: Appl. Phys. 33, 960 (2000).
- (29) R. Devoto, Physics of Fluids 16, 616 (1973).
- (30) S. A. Khrapak, S. V. Ratynskaia, A. V. Zobnin, A. D. Us- achev, V. V. Yaroshenko, M. H. Thoma, M. Kretschmer, H. Höfner, G. E. Morfill, O. F. Petrov, et al., Phys. Rev. E 72, 016406 (2005).
- (31) S. A. Khrapak, P. Tolias, S. Ratynskaia, M. Chaudhuri, A. Zobnin, A. Usachev, C. Rau, M. H. Thoma, O. F. Petrov, V. E. Fortov, et al., EPL (Europhysics Letters) 97, 35001 (2012).
- (32) L. Couëdel, private communication on microwave inter- ferometric measurements (2015).