Detection of three Gamma-Ray Burst host galaxies at
Abstract
Long-duration Gamma-Ray Bursts (GRBs) allow us to pinpoint and study star-forming galaxies in the early universe, thanks to their orders of magnitude brighter peak luminosities compared to other astrophysical sources, and their association with deaths of massive stars. We present Hubble Space Telescope Wide Field Camera 3 detections of three Swift GRB host galaxies lying at redshifts (GRB 130606A), (GRB 050904), and (GRB 140515A) in the F140W (wide- band, ) filter. The hosts have magnitudes (corrected for Galactic extinction) of and respectively. In all three cases the probability of chance coincidence of lower redshift galaxies is , indicating that the detected galaxies are most likely the GRB hosts. These are the first detections of high redshift () GRB host galaxies in emission. The galaxies have luminosities in the range (with ), and half-light radii in the range . Both their half-light radii and luminosities are consistent with existing samples of Lyman-break galaxies at . Spectroscopic analysis of the GRB afterglows indicate low metallicities () and low dust extinction () along the line of sight. Using stellar population synthesis models, we explore the implications of each galaxy’s luminosity for its possible star formation history, and consider the potential for emission-line metallicity determination with the upcoming James Webb Space Telescope.
Subject headings:
gamma-ray burst: individual (GRB 130606A, GRB 050904, and GRB 140515A) — galaxies: high-redshift — galaxies: luminosity function, mass function — galaxies: star formation1. Introduction
Long-duration Gamma-Ray Bursts (GRBs) are associated with the core collapse of very massive stars. At peak, their optical afterglows can be orders of magnitude brighter than the next most luminous astrophysical sources (e.g., Racusin et al., 2008; Bloom et al., 2009). Spanning the majority of cosmological time, GRBs found by the Swift satellite have been detected from (Pian et al., 2006) to (Tanvir et al., 2009; Salvaterra et al., 2009; Cucchiara et al., 2011) with a median redshift of (Jakobsson et al., 2006; Fynbo et al., 2009; Hjorth et al., 2012). GRBs, then, are cosmological probes, sampling sightlines through individual galaxies (e.g., Jakobsson et al., 2004; de Ugarte Postigo et al., 2012) and giving us insight, via afterglow spectroscopy, into a large array of local (galactic) and intergalactic properties, such as metal abundance (e.g., Cucchiara et al., 2015), temperature and gas densities (e.g., Starling et al., 2013; Campana et al., 2015), dust content (e.g., Zafar et al., 2011; Schady et al., 2012), and also the neutral fractions of the intergalactic medium (IGM) (e.g., Totani et al., 2006; Hartoog et al., 2015).
GRBs are also important because they select star-forming hosts independently of the luminosity of the galaxies themselves. In some cases the hosts are bright enough for further follow-up, allowing comparison of their properties in emission with those in absorption (e.g., Krühler et al., 2015). However, at higher redshifts it becomes increasingly challenging to detect the hosts directly. In fact, this trend can be turned to an advantage since it means that the ratio of undetected to detected hosts in deep imaging provides a measure of the proportion of star formation occurring in very faint galaxies beyond the depths of conventional flux-limited galaxy surveys. Until now, no hosts have been detected in emission beyond (Chary et al., 2007), which is consistent with a steep faint-end slope of the galaxy ultraviolet (UV) luminosity function at high redshifts (Tanvir et al., 2012; Trenti et al., 2012; Basa et al., 2012).
The majority of galaxies known from early cosmic times have been identified via the Lyman-break technique (Steidel et al., 1996), in which high redshift candidates are selected by their presence in images with red (typically near infrared) passbands, along with their absence in images with bluer passbands, taken in (typically optical) “veto” filters, presumed to be shortward of the Ly break in the rest frame. This has resulted in samples of up to Lyman-break galaxies (LBGs) with photometric redshifts around , though there has been recent work in pushing the envelope to (e.g., Oesch et al., 2014). These are primarily found through various Hubble Space Telescope (HST) deep imaging campaigns (e.g., Bouwens et al., 2015; Duncan & Conselice, 2015; Oesch et al., 2015a). Our understanding of the physical properties of these galaxies, however, has largely been limited to what can be learnt from their broad-band colours (e.g., Wilkins et al., 2013), and spectroscopy of a handful of intrinsically very luminous or highly lensed examples (e.g., Oesch et al., 2015b; Stark et al., 2015). The very blue UV continua measured for some faint LBG samples led to suggestions that these galaxies must be both dust free and have very low metallicity (; Bouwens et al., 2010), although subsequent analyses have found rather less extreme colours (Dunlop et al., 2012; Finkelstein et al., 2012). Early Atacama Large Millimetre Array (ALMA) studies of the continuum and [C II] () line emission properties of small samples of LBGs are also consistent with their being low-dust and moderately low-metallicity systems (Capak et al., 2015).
There is now strong evidence that GRBs preferentially occur in low-metallicity, star-forming galaxies (e.g., Levesque et al., 2010; Graham & Fruchter, 2013; Cucchiara et al., 2015; Graham & Fruchter, 2015), although a small fraction are found in high-metallicity environments (e.g., Graham et al., 2015). From this, we would expect that the brightest high- GRB hosts would satisfy the selection criteria of current LBG surveys (e.g., Fynbo et al., 2008), and hence, through the afterglow spectroscopy, potentially provide evidence of the internal conditions in LBGs, which are otherwise poorly constrained.
In this paper we report on the detection and properties of the host galaxies of three GRBs, 130606A, 050904, and 140515A, at spectroscopic afterglow redshifts of , and respectively. These are the three most distant GRB hosts directly detected to date. We first discuss the GRB sample, and their host properties inferred from their afterglows in Section 2. The HST observations, and data analysis methods are discussed in Section 3. In Section 4 we demonstrate that these galaxies are unlikely to be low- interlopers. Assuming they are the hosts, we compare them to LBGs and the lower redshift population of GRB hosts. Finally in Section 5, we briefly discuss the implications of our results, along with the potential of James Webb Space Telescope observations of these galaxies. Details of the relative astrometry procedure are given in Appendix A, which determines the precision with which we can locate the afterglow positions on our HST images. A statistical study of the high redshift GRB host sample, including an updated analysis of the non-detections, will be presented in a future paper. That work will address the implications of the host luminosities for the faint end of the galaxy luminosity function (LF) at , which is of key importance for our understanding of reionization.
2. GRB Sample
2.1. GRB 130606A
GRB 130606A was confirmed as a high-redshift source from optical spectroscopic observations with the Gran Telescopio Canarias telescope, giving (Castro-Tirado et al., 2013). X-shooter observations by Hartoog et al. (2015), using the European Southern Observatory (ESO) Very Large Telescope (VLT), found a neutral hydrogen column density of based on the red damping wing of the Ly absorption line, consistent with results from spectroscopy of the event by other groups (Chornock et al., 2013; Totani et al., 2014). Hartoog et al. (2015) estimated the average metallicity of the host galaxy to be , while multiple intervening absorption lines were detected at redshifts across the range to , with a possible intervening system at . They also found host dust extinction along the line of sight, measured using the X-ray and optical spectral energy distribution (SED), to be consistent with zero and with a upper limit of .
2.2. GRB 050904
GRB 050904 was confirmed as a high-redshift source from optical spectroscopic observations with the Subaru Telescope, giving (Kawai et al., 2006). A detailed analysis was conducted by Totani et al. (2006), who measured a neutral hydrogen column density of from the damped Ly system associated with the host galaxy, and detected an intervening absorber at . Thöne et al. (2013) re-analyzed the Subaru spectrum and estimated a metallicity of , based solely on the S II () line (the other metal lines being saturated and/or blended). Considering the low resolution of the spectrum, this estimate should probably be regarded as a lower limit. Host extinction was determined to be (Zafar et al., 2010).
A previous search for the host galaxy was conducted by Berger et al. (2007), with HST and Spitzer observations. They observed with both HST’s Advanced Camera for Surveys (ACS), and Near Infrared Camera and Multi-Object Spectrometer (NICMOS), and their F850LP and F160W filters respectively. Spitzer observations were carried out with the Infrared Array Camera (IRAC) in all four channels (). The host galaxy was undetected down to upper limits of and (see also Perley et al., 2016). The ACS data were re-reduced (Tanvir et al., 2012), and a upper limit of was estimated, accounting for flux loss from IGM absorption.
2.3. GRB 140515A
GRB 140515A was confirmed as a high-redshift source from optical spectroscopic observations with the Gemini-North Telescope, giving (Chornock et al., 2014). Melandri et al. (2015) presented ESO/VLT X-shooter observations of the afterglow, estimating a neutral hydrogen column density of from the red damping wing of the Ly absorption line. They determined upper limits for host galaxy metallicity, measuring , and . An intervening absorber was detected at , and they also determined host extinction to be . In addition, Melandri et al. (2015) point out that the low hydrogen column would be consistent with GRB 140515A having exploded in a relatively low-density galactic environment.
3. Observations and Results
We observed the GRB positions with HST as part of a program to study the host galaxies of GRBs (GO-13831; PI: Tanvir). Observations were performed with the Wide Field Camera 3 Infrared Channel (WFC3-IR) using the F140W filter. Spanning the conventional - and -bands, this filter has a pivot wavelength of , and bandpass of . The F140W filter was chosen due to its wide bandpass so as to maximise sensitivity in the rest-frame UV, while also avoiding bright nebular emission lines which can otherwise add significant uncertainties to SED modelling (e.g., Schaerer & de Barros, 2009; González et al., 2012, 2014; Oesch et al., 2015b).
A three-point dither was adopted within each orbit with further shifts between orbits to provide an optimal six-point dither pattern, while simultaneously stepping over WFC3-IR detector “blobs”. A log of the observations is summarized in Table 1. We processed the data using AstroDrizzle111http://drizzlepac.stsci.edu/ resulting in a pixel scale of , which is half the native detector pixel size, for all GRB fields.
Relative astrometry, locating the GRBs precisely on the HST/WFC3 images, was achieved by directly comparing the positions of objects (mostly stars) on the HST images with their positions on images showing the afterglows (see Appendix A for greater detail). The precision with which this can be done depends on the number and brightness of the comparison sources and also the of the afterglow detections. In all three cases, the positional uncertainty is .
For GRBs 130606A and 140515A, we fixed the absolute astrometry using the reported radio positions for the afterglows (Laskar et al., 2013, 2014). For GRB 050904 the absolute astrometry was tied to SDSS stars visible in our ground-based comparison images (Pier et al., 2003).
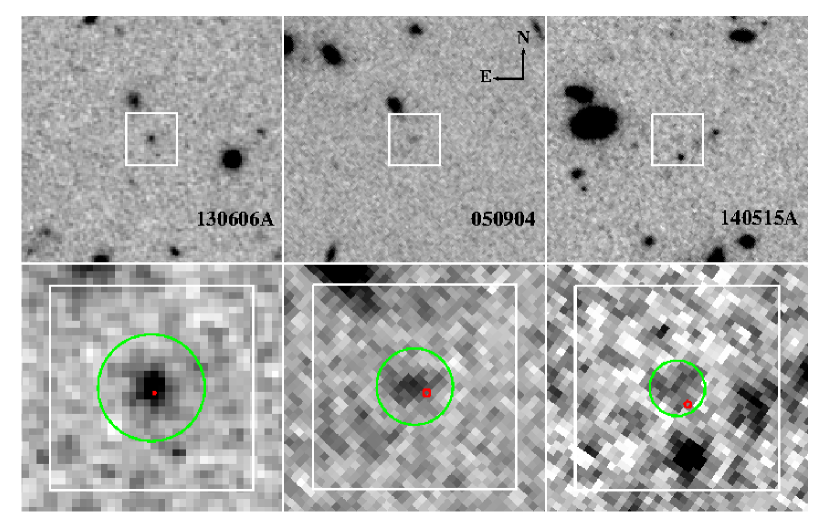
In all three cases, the observations reveal galaxies coincident within the inferred GRB afterglow locations. As discussed in Section 4.1, we find the probability that these galaxies are chance alignments is small and believe they are likely to be the GRB hosts. Indeed, we note that typically GRBs lie on the UV-bright regions of their hosts (Fruchter et al., 2006; Svensson et al., 2010), consistent with what is seen here. Cutouts of the fields are shown in Figure 1, with the GRB positions shown as red circles, and the galaxies within green circles. The galaxy centroid positions (accurate to ) and offsets from GRB afterglow locations are given in Table 2.
| Identifier | 130606A | 050904 | 140515A |
|---|---|---|---|
| Date | 2015 Aug 13 | 2014 Oct 31 | 2015 Feb 01 |
| UT Time | 02:29:36 | 11:15:51 | 15:06:38 |
| 2014 | 1908 | 1900 | |
| Exposure (s) | 10791 | 13488 | 10791 |
| RedshiftaaDetermined from the GRB Afterglow. | 5.913 | 6.295 | 6.327 |
| bbForeground extinction calculated using https://ned.ipac.caltech.edu/forms/calculator.html | 0.015 | 0.037 | 0.014 |
Note. — All observations were conducted with the WFC3-IR instrument and F140W filter.
3.1. Photometry
Photometry of the three galaxies was performed using GAIA222http://star-www.dur.ac.uk/~pdraper/gaia/gaia.html and its Autophotom package. A catalogue of objects from each HST image was built with GAIA’s native SExtractor (Bertin & Arnouts, 1996) support, employing a detection threshold of and requiring three neighbouring pixels above the background, to be considered objects. Identifying the objects located at each of the GRBs positions as the potential host galaxies, their count rates were measured using circular apertures centred on their barycentric catalogue coordinates. Sky background was estimated with circular apertures of identical radii to the galaxy aperture, distributed within of the galaxy aperture, and taking care to avoid other objects detected in the catalogue to minimalise background contamination. Standard deviation of the background aperture count rates was adopted as the photometric error, which is reasonable, as we are in a background-limited regime.
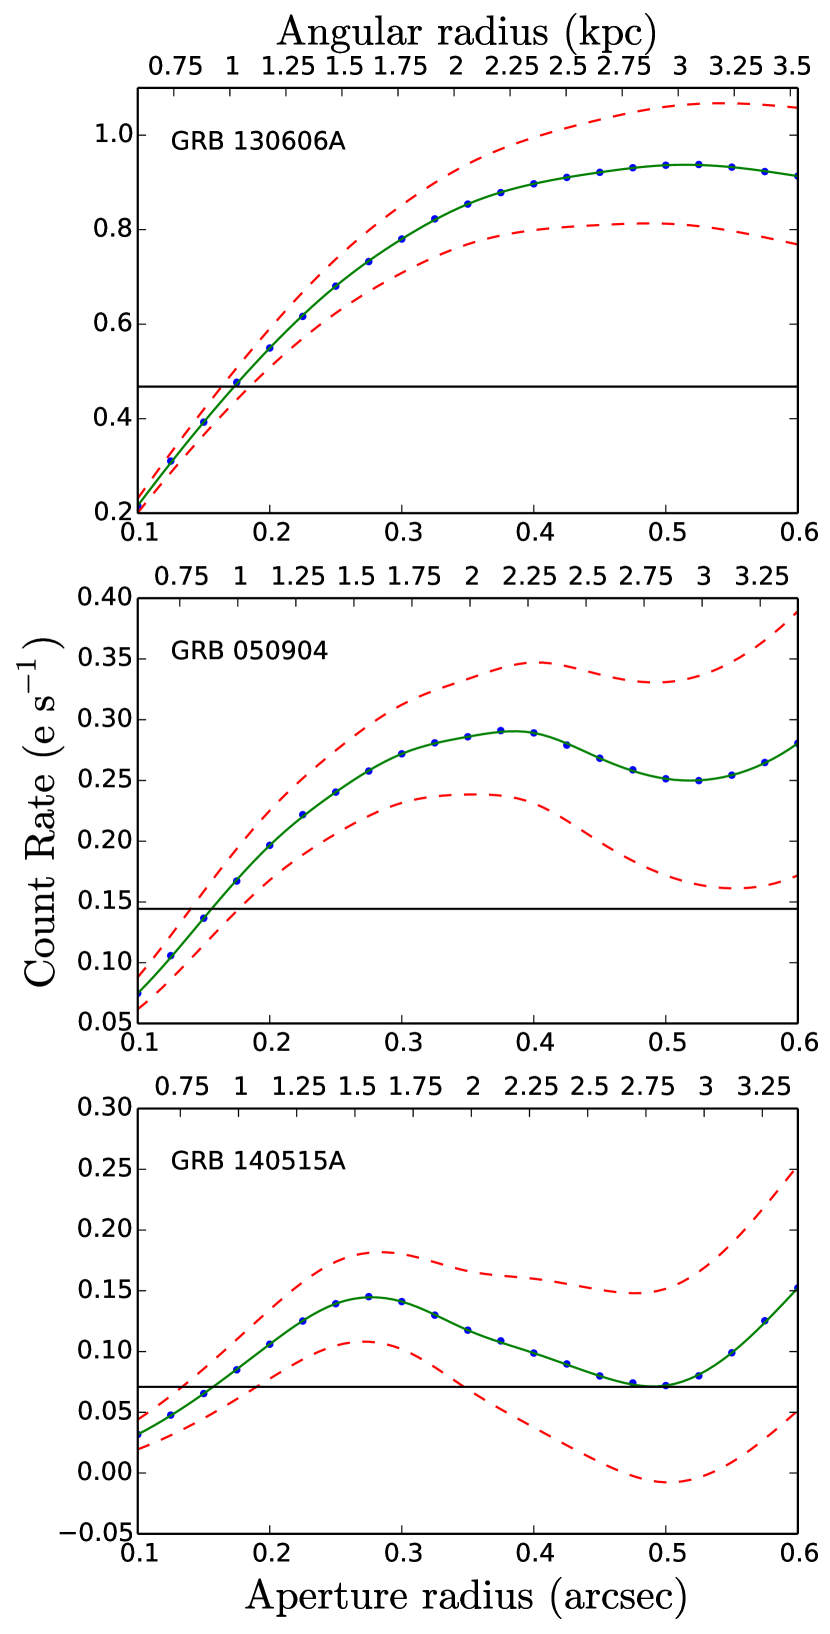
With a small sample, we chose to customize each source aperture radius instead of applying the more typical fixed aperture radius for all sources. Aperture radii were varied incrementally, with the background-subtracted count rates plotted into curves of growth (CoG) for each GRB host galaxy (Figure 2). Cubic spline interpolation was used to estimate values between the measured aperture radii. The total count rate can be estimated from the level at which the CoG plateaus (these peak radii are shown as the green circles in Figure 1). Although taking the peak of the CoG might systematically overestimate brightness, given that at larger radii we begin to be contaminated by neighbouring sources, our approach seems reasonable. As a compromise, we chose to average the three points at the peak of the CoG to represent the point at which the source counts reach the background level. Finally, we extrapolated the count rate using the tabulated encircled energy fraction333http://www.stsci.edu/hst/wfc3/documents/handbooks/currentIHB/c07_ir07.html and adopted the WFC3-IR infinite aperture zero point444http://www.stsci.edu/hst/wfc3/phot_zp_lbn for the F140W filter.
Based on Galactic foreground extinction maps from Schlafly & Finkbeiner (2011), we find for each case that only small corrections need to be applied (see Table 1). At the observed pivot wavelength, we estimate apparent magnitudes of and respectively. For GRB 050904, the new result is consistent with the previous upper limits as discussed in Section 2.2. The most marginal detection is the case of GRB 140515A, but even here the significance is , giving us confidence that it is a real source. Subsequent photometric analysis and results are discussed in Section 4 and given in Table 2.
3.2. Size estimation
Curtis-Lake et al. (2016) recently studied a sample of LBGs from Hubble deep imaging, in the to redshift range for their rest-frame UV sizes. They quantified galaxy size as the circularised half-light radius (), the radius enclosing half the galaxies’ total flux (cf. Section 3.1). Following their methodology, we determine from our CoGs, taking the interpolated aperture radii that intersect the estimated half-maximum count rates. Curtis-Lake et al. (2016) used fixed apertures of radius . We accounted for each field’s point spread function (PSF) by fitting a central Gaussian profile to bright, unsaturated, uncontaminated stars and averaging the results.
We measured for the field of GRB 130606A, and for the fields of GRBs 050904 and 140515A. There is also an additional correction to account for the wings of the PSF which is estimated using the simulations of Curtis-Lake et al. (2016). After the total PSF correction, our half-light radii are determined to be and for GRBs 130606A, 050904, and 140515A respectively.
3.3. Possible afterglow contamination?
Our observations of the field of GRB 140515A were obtained only months after the GRB event, and it is therefore possible, that our photometry could be contaminated by the fading afterglow. A reasonable upper limit to this contamination can be obtained by taking the flux in a small ( radius) aperture at the location of the afterglow, and assuming this is entirely due to a point source. This leads to a maximum contamination of . Alternatively, considering the latest reported infrared photometry, (Melandri et al., 2015), obtained at post-burst, and a typical late-time power-law decay of (see e.g., Tanvir et al. 2016 in prep. Kann et al., 2010), we would expect an afterglow flux density at the time of observation of . We adopt this latter figure as the best compromise correction for afterglow contamination and apply it to our reported photometric results in Table 2, Section 4.3 and Figures 3-5. We note that this correction is below the level of the photometric error, although it does reduce the overall significance of the detetcion to .
The other two fields were observed much longer post-GRB, and indeed the hosts in these cases are brighter, so any afterglow contamination should be negligible.
3.4. Alternative photometric measurements
To verify that the photometric analysis presented here is robust and the results are independent of the specific procedure followed, we carried out an independent analysis of the images using the pipeline developed by the Brightest of Reionizing Galaxies (BoRG) survey, which searched for high- galaxies (see Trenti et al., 2012; Bradley et al., 2012; Schmidt et al., 2014, for a detailed description). In short, we first derived variance (RMS) maps from the weight maps produced by AstroDrizzle, then ran SExtractor in dual-image mode for a preliminary identification of the sources. Finally, we normalized the RMS maps to account for correlated noise by measuring the background in random positions that are not associated to any source, and ran SExtractor with the normalized RMS maps to construct the final catalogue.
For GRB 050904 and GRB 130606A, the procedure yielded results consistent with the optimized measurements of Table 2, within the photometric uncertainty using standard SExtractor parameters for searches of high- faint galaxies. For GRB 140515A, a standard run to identify the host galaxy failed, but setting a lower threshold for detection and aggressive deblending identified the host galaxy at . Since the source is close to the detection limit of the images, and is located near an extended structure, it is not surprising that a general source detection algorithm is not recovering it as efficiently as the primary photometric approach adopted in this paper. Nevertheless, this analysis confirms that there is an excess of flux at the GRB position in all three cases.
4. Analysis and Discussion
| Identifier | 130606A | 050904 | 140515AaaThe values for 140515A are corrected for the possible afterglow contamination (see Section 3.3), with the exception of . |
|---|---|---|---|
| bbOffset is defined as the projected straight-line distance between the GRB and galaxy centroid. Using our adopted cosmology these correspond to and respectively. | |||
| Galaxy RAccJ2000 coordinates of the detected host galaxies. () | 16:37:35.14 | 00:54:50.88 | 12:24:15.51 |
| Galaxy DecccJ2000 coordinates of the detected host galaxies. (°, ′, ″) | +29:47:46.5 | +14:05:09.9 | +15:06:16.8 |
Note. — . for each galaxy is given in Table 1.
4.1. Are they the host galaxies?
It is possible that the three detected objects are not the host galaxies of each GRB, but are instead intervening objects at a lower redshift. Deep imaging blueward of the Ly break is currently not available, and we cannot confirm their drop-out nature. Despite this, we can estimate the probability of chance coincidence () of a lower redshift galaxy, based on galaxy number counts (as has been used for both long- and short-GRB hosts in the past e.g., Fong et al., 2013). Following the method of Bloom et al. (2002):
| (1) |
where is the observed number density of galaxies brighter than magnitude . This is the appropriate formulation when a GRB afterglow is localized within the detectable light of its host galaxy, as is the case here (Figure 1). The projected offsets from the host centres are shown in Table 2, and this small sample is consistent with the roughly fraction of bursts found within the (blue light) half-light radius by Bloom et al. (2002).
Interpolating -band number counts measured by Metcalfe et al. (2006) and using our calculated measurements, we determine values of (see Table 2) for all three objects. This statistic indicates that these are all likely the GRB host galaxies, and that the probability that two or even all three detections are lower redshift interlopers is very low.
An alternative approach to addressing this question is to directly measure the fraction of our images covered by visible galaxies. To do this we ran SExtractor to find all non-stars (using the same parameters discussed in Section 3.1). Summing their total area, we find that only % of each HST image coincides with detectable galaxies, suggesting that the values evaluated above are, if anything, rather conservative for our fields.
As is common in spectroscopy of high redshift continuum sources, absorption lines of intervening systems at lower redshifts are seen in all three GRB afterglows studied here (see Section 2). These absorption systems (in particular C IV at ), are typically associated with galaxies with impact parameters that are tens of kpc (many arcseconds) from the line of sight (Adelberger et al., 2005). Thus, a priori, it would be surprising if the galaxy responsible for absorption happened to coincide spatially with the GRB location. Indeed there is no evidence for particularly strong absorption or dust attenuation that would be suggestive of these GRBs being directly behind a lower redshift galaxy.
4.2. Comparison with Lyman-break Galaxies
Converting our apparent magnitudes from the observed pivot wavelength to literature comparison wavelengths of requires knowledge of the underlying spectrum and its spectral index (), where the UV continuum is typically assumed to be a power-law with . Duncan & Conselice (2015) compare a variety of UV continuum studies and find little difference between and (see their Figure 2) in the parameterization of the UV spectral index,
| (2) |
We assume that this parametrization is applicable to our host galaxies and find values in the range to . We also adopt an intrinsic scatter of , based on the results of Rogers et al. (2014). Magnitudes are converted using the following equation:
| (3) |
We estimate absolute magnitudes () in the range to , a difference of only to from the observed wavelength (absolute) magnitudes. Considering the size of our observational errors, this difference is negligible.
Bouwens et al. (2015) present results for the UV galaxy luminosity function (LF) from to , based on large samples of LBGs with photometric redshifts. The LF is conventionally described using the Schechter function (Schechter, 1976):
| (4) |
where , with being the characteristic luminosity break between the faint-end power-law slope () and the bright-end exponential cut-off, while is a normalization factor. Bouwens et al. (2015) present a parameterization of (the magnitude corresponding to ) using a linear fit as a function of redshift:
| (5) |
From to , varies only by mag, and hence we adopt the value . Converting our GRB host galaxies into comparable ratios gives (see Table 2). This range is consistent with that found in deep LBG samples given the low extinction inferred from the afterglows, these galaxies would likely also satisfy the colour selection criteria for inclusion in these LBG samples (Bouwens et al., 2015).
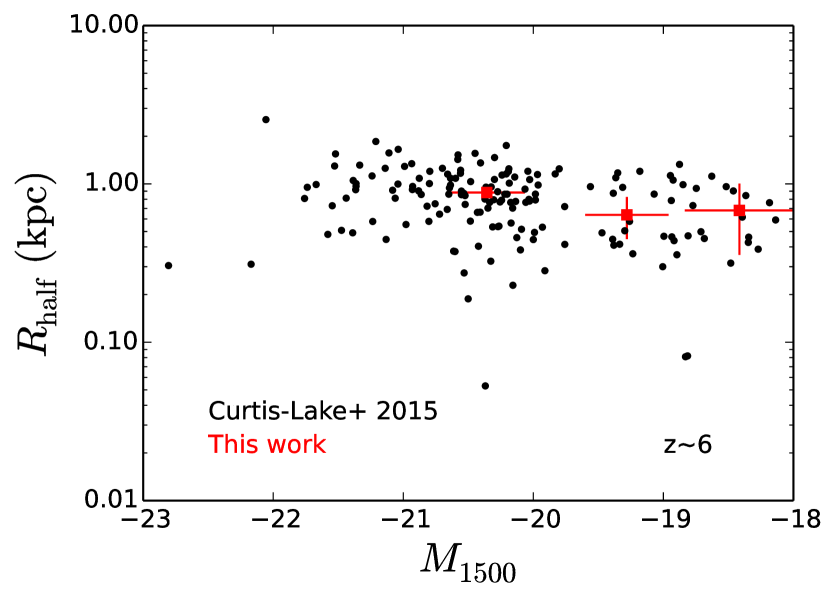
Using our adopted cosmology, we convert our values into kpc, giving the range (see Table 2). We plot these sizes against magnitudes in Figure 3, together with the LBG sample of Curtis-Lake et al. (2016). All three GRB host galaxies have typical for their magnitudes. We also note that our GRB host galaxies have comparable values to those of Ly selected galaxies at (Malhotra et al., 2012).
4.3. Star Formation Histories
The host galaxies were observed in the rest-frame range, where the emission is dominated by the light of young, massive stars. Therefore, our photometry provides constraints on their star formation histories. To investigate this, we employ the BPASS stellar population synthesis models (Eldridge & Stanway, 2009; Stanway et al., 2016), which incorporate prescriptions for binary stellar evolution. We also choose to adopt their preferred broken power-law model for the differential stellar initial mass function (IMF), which has a slope of between and a slope of between . Given the abundance constraints discussed in Section 2, from the GRB afterglow spectra, we use the lowest metallicity (; i.e. ) BPASS models.
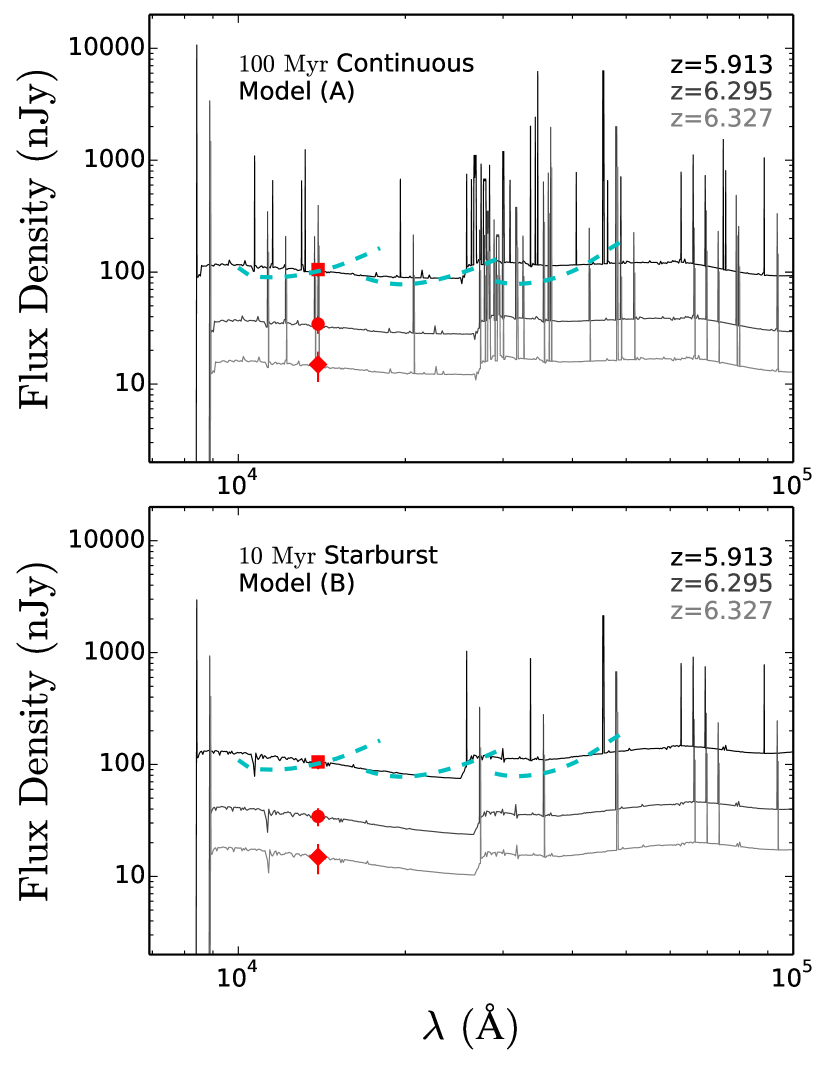
We consider two cases which span a broad range of plausible histories. Model (A) has a continuous star formation rate for , which is reasonable given the age of the universe of at . Our alternative model (B) assumes just a single short-lived burst of star formation prior to the observation epoch, which would be reasonable if the GRB progenitors were born in the same starburst. Their likely high masses we believe they had, would imply a lifetime of this order. It is interesting to note that despite its young age, this model results in significant near-IR emission due to the contribution of red supergiants.
Starting with the spectral energy density (SED) BPASS models555http://www.bpass.org.uk/, we folded these through the radiative transfer program Cloudy666http://www.nublado.org (Ferland et al., 1998), to obtain the underlying nebular continuum and line emission spectrum excited by the BPASS stellar spectra. Next, we scaled the emission lines to an intrinsic spectral resolution of R = 1000. Finally, we transformed these models to the observed redshifts of the bursts, and scaled them to our photometric results. For model (A), our inferred star formation rates, are and , while the total mass of stars formed instantaneously in model (B) are and for the hosts of GRBs 130606A, 050904, and 140515A respectively. These scaled models are shown for each GRB host in Figure 4.
The above estimates implicitly assume negligible dust extinction, as is frequently done for galaxies at these redshifts (although see Wilkins et al., 2013, who argue for modest UV extinctions of based on colours of LBGs). For our cases, the observations of the afterglows support the proposition that the dust content is generally low, with in each case (see Section 2). If we take these afterglow dust estimates as representative of the internal extinction in their hosts, we can find rest-frame extinctions at , as observed. Depending on the adopted extinction law, we find (Pei, 1992; Calzetti et al., 2000). Hence our SFR values could increase by up to if corrected for dust extinction.
4.4. Comparison to other GRB hosts
It is interesting to compare the properties of our detected hosts with the population of GRB hosts at lower redshifts. One problem in doing this is that samples of GRBs and their hosts tend to be inhomogeneous, incomplete, and biased, in particular against GRBs occurring in dusty galaxies for which no optical afterglows were found (e.g., Perley et al., 2013). The Optically Unbiased GRB Host (TOUGH) survey attempted to define a more statistically representative sample of hosts by identifying them using their X-ray localisations, and hence obtaining redshifts directly from the hosts, where an afterglow redshift was unavailable. The net result is a sample of hosts for which have redshifts and all but of the remainder have photometric constraints placing them at (Hjorth et al., 2012; Jakobsson et al., 2012).
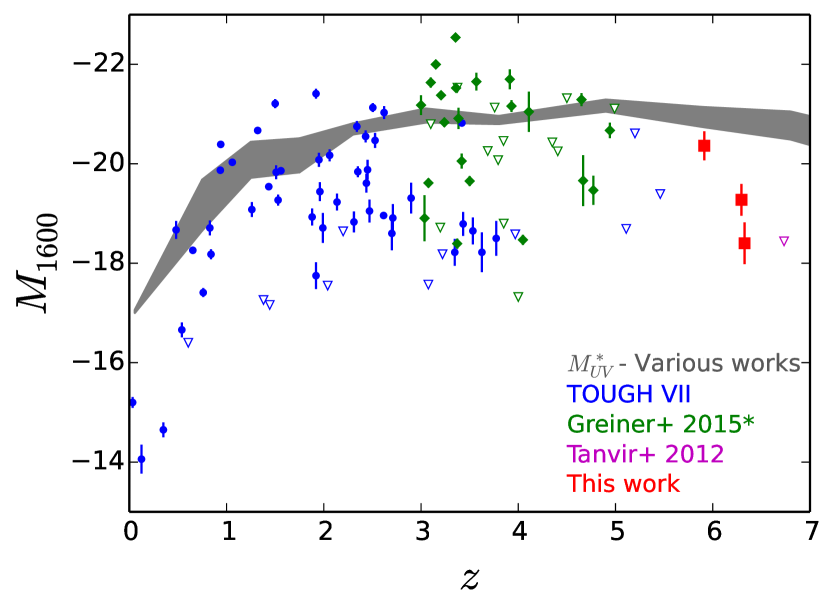
Beyond the TOUGH sample suffers from small number statistics, and we supplement it with additional hosts for which photometry is available in the literature. Although these additional data are more subject to optical selection effects, and include some non-Swift GRBs, the larger sample size likely does provide a fuller picture of the host luminosity distribution at higher redshifts. The UV luminosities of TOUGH VII (Schulze et al., 2015), Greiner et al. (2015) and Tanvir et al. (2012) are plotted in Figure 5 together with our new hosts. To ensure that the samples of TOUGH VII and Greiner et al. (2015) are comparable, we re-analyzed the latter sample using the methodology of TOUGH VII (Schulze et al., 2015). We also plot as a function of redshift. At low redshifts () the bulk of hosts are sub-, as expected if GRBs trace primarily sub-solar metallicity star formation (e.g., Levesque et al., 2010; Graham & Fruchter, 2013; Trenti et al., 2015; Vergani et al., 2015). From to the break of the luminosity function evolves rather little. While some hosts are found with up to , at higher redshifts such bright hosts are absent, consistent with a steepening galaxy luminosity function (c.f., Bouwens et al., 2015), with star formation predominantly occurring in faint galaxies.
5. Conclusions
We have presented deep () HST/F140W observations of the fields of GRBs 130606A, 050904, and 140515A and have identified galaxies coincident with each GRB afterglow location. Based on low () chance of coincidence of low- interlopers, we conclude that these are very likely the GRB host galaxies. At , these are the most distant GRB host galaxies detected to date. It is significant that we are now detecting GRB hosts at the end of the era of reionization (a fuller statistical analysis of the high-z GRB hosts, including non-detections, will be presented in a future paper, in which we will address their implications for the galaxy luminosity function at ).
With rest-frame UV () luminosities in the range of , and half-light radii of , our three host GRB galaxies are consistent with those found from deep HST studies of LBGs in the same redshift range. We find that the GRBs themselves are located within the rest-frame UV light of their hosts, as is usually the case for GRBs at lower redshifts (Fruchter et al., 2006; Svensson et al., 2010).
The power of GRB selection is that spectroscopy of the afterglows can provide detailed information about the gas and dust properties of the hosts. In this instance, it tells us that all three galaxies have low metallicity () and low dust extinction (). These galaxies are considerably brighter than the upper limits for the five hosts (excluding GRB 050904 itself) reported by Tanvir et al. (2012). Of course, these studies remain limited to relatively small samples, but it would have been surprising had our new program not begun to make some detections, given that canonical LFs suggest that of star formation at should be occurring in galaxies brighter than (Tanvir et al., 2012). The small sample size also precludes assessing whether there are any correlations between the properties of the hosts in emission and their properties derived from the afterglows, although it is interesting to note that GRB 140515A, whose afterglow revealed a low foreground gas column, is also the faintest of the three hosts and the one where the burst occurred at the greatest offset from the host centre.
Significantly, as illustrated in Figure 4, we would expect James Webb Space Telescope spectroscopy to provide high signal-to-noise measurements of the rest-frame optical emission lines for potentially all three hosts, especially GRB 130606A. This will allow comparison of emission-line metallicity and extinction diagnostics with the detailed values obtained from the afterglows, which are potentially important for testing the applicability of these diagnostics to this redshift regime.
Appendix A Relative Astrometry
For our analysis it is important to establish the locations at which the GRBs occurred on our HST/WFC3 images, at least well enough to give confidence in the identification of the hosts. To achieve this we made use of observations made shortly after the GRB events, on which the afterglows were detected, and calculated the transformation between these images and the HST frames using a number of field sources. The precision with which this can be achieved depends on a number of factors, in particular the detection significance of the afterglows and the number and brightness of field sources visible on the HST frames and comparison frames. The precision with which the afterglows can be centroided is then estimated by:
| (A1) |
where is the photometric detection significance (here obtained from aperture photometry). The error introduced by the coordinate transformation is best estimated by the object to object scatter (the plate scale, orientation and distortion mapping should be reliable from the pipeline processing of each image, especially over the small HST fields, and we therefore only fit for a zero-point translation). Here we summarise the comparison images and tabulate the error budget in each case (Table 3).
| GRB 130606A | GRB 050904 | GRB 140515A | |||
|---|---|---|---|---|---|
| Identifier | -band | -band | -band | -band | -band |
| Std error in matching coordinate systems | 0.014 | 0.014 | 0.016 | 0.031 | 0.018 |
| Afterglow centroiding error | 0.012 | 0.009 | 0.007 | 0.017 | 0.002 |
| Combined error | 0.018 | 0.016 | 0.018 | 0.035 | 0.018 |
Note. — All three image bands for GRB 050904 were co-added to increase signal-to-noise.
A.1. GRB 130606A
Our primary comparison images were obtained with the United Kingdom Infrared Telescope (UKIRT) Wide Field Camera (WFCAM) in the , and bands. These wide field images are astrometrically calibrated to the Two Micron All-Sky Survey (2MASS) system. We made use of field stars which were well detected in the WFCAM images and visible in the HST fields.
In fact the independent estimates of the afterglow position from the three bands agree to better than this error, so we average them to obtain the final best estimate.
A.2. GRB 050904
In this case our primary astrometric comparison was with several UKIRT/WFCAM images taken in the , and bands, which we co-added to increase the signal-to-noise. A rather higher scatter in the mapping to the HST image was noticed for stars in this field, possibly due to small proper motions during the intervening decade from the burst occurrence. We therefore utilized compact galaxies as well as stars to make the astrometric comparison.
We also analyzed the HST/NICMOS image reported by Berger et al. (2007), finding a consistent location within the errors, although the signal-to-noise of the afterglow was rather low.
A.3. GRB 140515A
We used Gemini-North Gemini Multi-Object Spectrograph (GMOS) imaging as the astrometric comparison, utilising stars that were also on our HST images. The seeing was good on the GMOS image (), and the signal-to-noise ratio high ().
References
- Adelberger et al. (2005) Adelberger, K. L., Shapley, A. E., Steidel, C. C., et al. 2005, ApJ, 629, 636
- Basa et al. (2012) Basa, S., Cuby, J. G., Savaglio, S., et al. 2012, A&A, 542, A103
- Berger et al. (2007) Berger, E., Chary, R., Cowie, L. L., et al. 2007, ApJ, 665, 102
- Bertin & Arnouts (1996) Bertin, E., & Arnouts, S. 1996, A&AS, 117, 393
- Bloom et al. (2002) Bloom, J. S., Kulkarni, S. R., & Djorgovski, S. G. 2002, AJ, 123, 1111
- Bloom et al. (2009) Bloom, J. S., Perley, D. A., Li, W., et al. 2009, ApJ, 691, 723
- Bouwens et al. (2010) Bouwens, R. J., Illingworth, G. D., Oesch, P. A., et al. 2010, ApJ, 708, L69
- Bouwens et al. (2015) Bouwens, R. J., Illingworth, G. D., Oesch, P. A., et al. 2015, ApJ, 803, 34
- Bradley et al. (2012) Bradley, L. D., Trenti, M., Oesch, P. A., et al. 2012, ApJ, 760, 108
- Calzetti et al. (2000) Calzetti, D., Armus, L., Bohlin, R. C., et al. 2000, ApJ, 533, 682
- Campana et al. (2015) Campana, S., Salvaterra, R., Ferrara, A., & Pallottini, A. 2015, A&A, 575, A43
- Capak et al. (2015) Capak, P. L., Carilli, C., Jones, G., et al. 2015, Nature, 522, 455
- Castro-Tirado et al. (2013) Castro-Tirado, A. J., Sánchez-Ramírez, R., Ellison, S. L., et al. 2013, A&A, submitted (arXiv:1312.5631)
- Chary et al. (2007) Chary, R., Berger, E., & Cowie, L. 2007, ApJ, 671, 272
- Chornock et al. (2013) Chornock, R., Berger, E., Fox, D. B., et al. 2013, ApJ, 774, 26
- Chornock et al. (2014) Chornock, R., Berger, E., Fox, D. B., et al. 2014, ApJ, submitted (arXiv:1405.7400)
- Cucchiara et al. (2011) Cucchiara, A., Levan, A. J., Fox, D. B., et al. 2011, ApJ, 736, 7
- Cucchiara et al. (2015) Cucchiara, A., Fumagalli, M., Rafelski, M., et al. 2015, ApJ, 804, 51
- Curtis-Lake et al. (2016) Curtis-Lake, E., McLure, R. J., Dunlop, J. S., et al. 2016, MNRAS, 457, 440
- de Ugarte Postigo et al. (2012) de Ugarte Postigo, A., Fynbo, J. P. U., Thöne, C. C., et al. 2012, A&A, 548, A11
- Duncan & Conselice (2015) Duncan, K., & Conselice, C. J. 2015, MNRAS, 451, 2030
- Dunlop et al. (2012) Dunlop, J. S., McLure, R. J., Robertson, B. E., et al. 2012, MNRAS, 420, 901
- Eldridge & Stanway (2009) Eldridge, J. J., & Stanway, E. R. 2009, MNRAS, 400, 1019
- Ferland et al. (1998) Ferland, G. J., Korista, K. T., Verner, D. A., et al. 1998, PASP, 110, 761
- Finkelstein et al. (2012) Finkelstein, S. L., Papovich, C., Ryan, R. E., et al. 2012, ApJ, 758, 93
- Fong et al. (2013) Fong, W., Berger, E., Chornock, R., et al. 2013, ApJ, 769, 56
- Fruchter et al. (2006) Fruchter, A. S., Levan, A. J., Strolger, L., et al. 2006, Nature, 441, 463
- Fynbo et al. (2008) Fynbo, J. P. U., Prochaska, J. X., Sommer-Larsen, J., Dessauges-Zavadsky, M., & Møller, P. 2008, ApJ, 683, 321
- Fynbo et al. (2009) Fynbo, J. P. U., Jakobsson, P., Prochaska, J. X., et al. 2009, ApJS, 185, 526
- González et al. (2012) González, V., Bouwens, R. J., Labbé, I., et al. 2012, ApJ, 755, 148
- González et al. (2014) González, V., Bouwens, R., Illingworth, G., et al. 2014, ApJ, 781, 34
- Graham & Fruchter (2013) Graham, J. F., & Fruchter, A. S. 2013, ApJ, 774, 119
- Graham & Fruchter (2015) Graham, J. F., & Fruchter, A. S. 2015, ApJ, submitted (arXiv:1511.01079)
- Graham et al. (2015) Graham, J. F., Fruchter, A. S., Levesque, E. M., et al. 2015, ApJ, submitted (arXiv:1511.00667)
- Greiner et al. (2015) Greiner, J., Fox, D. B., Schady, P., et al. 2015, ApJ, 809, 76
- Hartoog et al. (2015) Hartoog, O. E., Malesani, D., Fynbo, J. P. U., et al. 2015, A&A, 580, A139
- Hjorth et al. (2012) Hjorth, J., Malesani, D., Jakobsson, P., et al. 2012, ApJ, 756, 187
- Jakobsson et al. (2004) Jakobsson, P., Hjorth, J., Fynbo, J. P. U., et al. 2004, A&A, 427, 785
- Jakobsson et al. (2006) Jakobsson, P., Levan, A., Fynbo, J. P. U., et al. 2006, A&A, 447, 897
- Jakobsson et al. (2012) Jakobsson, P., Hjorth, J., Malesani, D., et al. 2012, ApJ, 752, 62
- Kann et al. (2010) Kann, D. A., Klose, S., Zhang, B., et al. 2010, ApJ, 720, 1513
- Kawai et al. (2006) Kawai, N., Kosugi, G., Aoki, K., et al. 2006, Nature, 440, 184
- Krühler et al. (2015) Krühler, T., Malesani, D., Fynbo, J. P. U., et al. 2015, A&A, 581, A125
- Laskar et al. (2013) Laskar, T., Zauderer, A., & Berger, E. 2013, GRB Coordinates Network, 14817, 1
- Laskar et al. (2014) Laskar, T., Zauderer, A., & Berger, E. 2014, GRB Coordinates Network, 16283, 1
- Levesque et al. (2010) Levesque, E. M., Kewley, L. J., Berger, E., & Zahid, H. J. 2010, AJ, 140, 1557
- Malhotra et al. (2012) Malhotra, S., Rhoads, J. E., Finkelstein, S. L., et al. 2012, ApJ, 750, L36
- Melandri et al. (2015) Melandri, A., Bernardini, M. G., D’Avanzo, P., et al. 2015, A&A, 581, A86
- Metcalfe et al. (2006) Metcalfe, N., Shanks, T., Weilbacher, P. M., et al. 2006, MNRAS, 370, 1257
- Oesch et al. (2010) Oesch, P. A., Bouwens, R. J., Carollo, C. M., et al. 2010, ApJ, 725, L150
- Oesch et al. (2014) Oesch, P. A., Bouwens, R. J., Illingworth, G. D., et al. 2014, ApJ, 786, 108
- Oesch et al. (2015a) Oesch, P. A., Bouwens, R. J., Illingworth, G. D., et al. 2015, ApJ, 808, 104
- Oesch et al. (2015b) Oesch, P. A., van Dokkum, P. G., Illingworth, G. D., et al. 2015, ApJ, 804, L30
- Oke & Gunn (1983) Oke, J. B., & Gunn, J. E. 1983, ApJ, 266, 713
- Pei (1992) Pei, Y. C. 1992, ApJ, 395, 130
- Perley et al. (2013) Perley, D. A. et al., 2013, ApJ, 778, 128
- Perley et al. (2016) Perley, D. A., Tanvir, N. R., Hjorth, J., et al. 2016, ApJ, 817, 8
- Pian et al. (2006) Pian, E., Mazzali, P. A., Masetti, N., et al. 2006, Nature, 442, 1011
- Pier et al. (2003) Pier, J. R., Munn, J. A., Hindsley, R. B., et al. 2003, AJ, 125, 1559
- Planck Collaboration (2015) Planck Collaboration, Ade, P. A. R., Aghanim, N., et al. 2015, A&A, submitted (arXiv:1502.01589)
- Racusin et al. (2008) Racusin, J. L., Karpov, S. V., Sokolowski, M., et al. 2008, Nature, 455, 183
- Reddy & Steidel (2009) Reddy, N. A., & Steidel, C. C. 2009, ApJ, 692, 778
- Robotham & Driver (2011) Robotham, A. S. G., & Driver, S. P. 2011, MNRAS, 413, 2570
- Rogers et al. (2014) Rogers, A. B., McLure, R. J., Dunlop, J. S., et al. 2014, MNRAS, 440, 3714
- Salvaterra et al. (2009) Salvaterra, R., Della Valle, M., Campana, S., et al. 2009, Nature, 461, 1258
- Schady et al. (2012) Schady, P., Dwelly, T., Page, M. J., et al. 2012, A&A, 537, A15
- Schaerer & de Barros (2009) Schaerer, D., & de Barros, S. 2009, A&A, 502, 423
- Schechter (1976) Schechter, P. 1976, ApJ, 203, 297
- Schlafly & Finkbeiner (2011) Schlafly, E. F., & Finkbeiner, D. P. 2011, ApJ, 737, 103
- Schmidt et al. (2014) Schmidt, K. B., Treu, T., Trenti, M., et al. 2014, ApJ, 786, 57
- Schulze et al. (2015) Schulze, S., Chapman, R., Hjorth, J., et al. 2015, ApJ, 808, 73
- Stanway et al. (2016) Stanway, E. R., Eldridge, J. J., & Becker, G. D. 2016, MNRAS, 456, 485
- Stark et al. (2015) Stark, D. P., Richard, J., Charlot, S., et al. 2015, MNRAS, 450, 1846
- Starling et al. (2013) Starling, R. L. C., Willingale, R., Tanvir, N. R., et al. 2013, MNRAS, 431, 3159
- Steidel et al. (1996) Steidel, C. C., Giavalisco, M., Pettini, M., Dickinson, M., & Adelberger, K. L. 1996, ApJ, 462, L17
- Svensson et al. (2010) Svensson, K. M., Levan, A. J., Tanvir, N. R., Fruchter, A. S., & Strolger, L.-G. 2010, MNRAS, 405, 57
- Tanvir et al. (2009) Tanvir, N. R., Fox, D. B., Levan, A. J., et al. 2009, Nature, 461, 1254
- Tanvir et al. (2012) Tanvir, N. R., Levan, A. J., Fruchter, A. S., et al. 2012, ApJ, 754, 46
- Thöne et al. (2013) Thöne, C. C., Fynbo, J. P. U., Goldoni, P., et al. 2013, MNRAS, 428, 3590
- Totani et al. (2006) Totani, T., Kawai, N., Kosugi, G., et al. 2006, PASJ, 58, 485
- Totani et al. (2014) Totani, T., Aoki, K., Hattori, T., et al. 2014, PASJ, 66, 63
- Trenti et al. (2012) Trenti, M., Perna, R., Levesque, E. M., Shull, J. M., & Stocke, J. T. 2012, ApJ, 749, L38
- Trenti et al. (2015) Trenti, M., Perna, R., & Jimenez, R. 2015, ApJ, 802, 103
- Vergani et al. (2015) Vergani, S. D., Salvaterra, R., Japelj, J., et al. 2015, A&A, 581, A102
- Wilkins et al. (2013) Wilkins, S. M., Bunker, A., Coulton, W., et al. 2013, MNRAS, 430, 2885
- Zafar et al. (2010) Zafar, T., Watson, D. J., Malesani, D., et al. 2010, A&A, 515, A94
- Zafar et al. (2011) Zafar, T., Watson, D. J., Tanvir, N. R., et al. 2011, ApJ, 735, 2