Terahertz Nonlinearity in Graphene Plasmons
Sub-wavelength graphene structures support localized plasmonic resonances in the terahertz and mid-infrared spectral regimesJu2011 ; Brar2013 ; Yan2013 . The strong field confinement at the resonant frequency is predicted to significantly enhance the light-graphene interactionMikhailov2008 ; Koppens2011 , which could enable nonlinear optics at low intensity Gullans2013 ; Manjavacas2011 ; Jablan2015 in atomically thin, sub-wavelength devices Kauranen2012 . To date, the nonlinear response of graphene plasmons and their energy loss dynamics have not been experimentally studied. We measure and theoretically model the terahertz nonlinear response and energy relaxation dynamics of plasmons in graphene nanoribbons. We employ a THz pump-THz probe technique at the plasmon frequency and observe a strong saturation of plasmon absorption followed by a 10 ps relaxation time. The observed nonlinearity is enhanced by two orders of magnitude compared to unpatterned graphene with no plasmon resonance. We further present a thermal model for the nonlinear plasmonic absorption that supports the experimental results.
Graphene exhibits a broadband intrinsic nonlinear optical response Mikhailov2008 ; Hendry2010 that has been used in mode-locking Zhang2009 and harmonic generation Hong2013 . In the optical and near-infrared regime, the nonlinear response of graphene is primarily attributed to transient Pauli blocking, which leads to an ultrafast saturable absorption and nonlinear refractionZhang2012 . In the terahertz regimeJnawali2013 ; Shi2014 , however, the nonlinear response is primarily caused by fast thermal heating and cooling of the electron population, which effects the intraband absorptionKadi2014 ; Mics2015 .
In the terahertz and mid-IR regime, the light-graphene interaction can be greatly increased by exploiting plasmon resonances, where the field is strongly localized and resonantly enhanced in a sub-wavelength graphene regionKoppens2011 . A dramatic enhancement of the linear absorption has been experimentally observed in isolated subwavelength graphene elementsJu2011 ; Brar2013 ; Yan2013 , and graphene-filled metallic apertures Jadidi2015 at resonant frequencies that can be controlled through the graphene dimensions and carrier concentration. Significant enhancement in the nonlinear response of graphene can be expected and has been theoretically predictedKoppens2011 ; Manjavacas2011 ; Gullans2013 ; Yao2014 ; Jablan2015 . To date, there have been no experimental demonstrations to study this effect, or to explore the energy loss dynamics of these collective plasmonic excitations.
In this letter, we measure the nonlinear response of plasmon resonances in an array of graphene nanoribbons using THz pump-THz probe measurements with a free-electron laser that is tuned to the plasmon resonance (9.4 THz.) We observe a resonantly-enhanced pump-induced nonlinearity in the transmission that is orders of magnitude stronger than that of unpatterned graphene. The pump-probe measurements reveal an energy relaxation time of approximately 10 ps (measured at 20K). We present a thermal model of the nonlinear plasmonic response that includes scattering through LA phonons and disorder-assisted supercooling, which matches both the observed timescale and power-scaling of the nonlinear response. With the model we show that the strong pump-induced transmission change is caused by an unexpected red-shift and broadening of the resonance. Furthermore the model predicts that even greater resonant enhancement of the nonlinear response can be expected in high-mobility graphene, suggesting that nonlinear graphene plasmonic devices could be promising candidates for classical and quantum nonlinear optical processing.
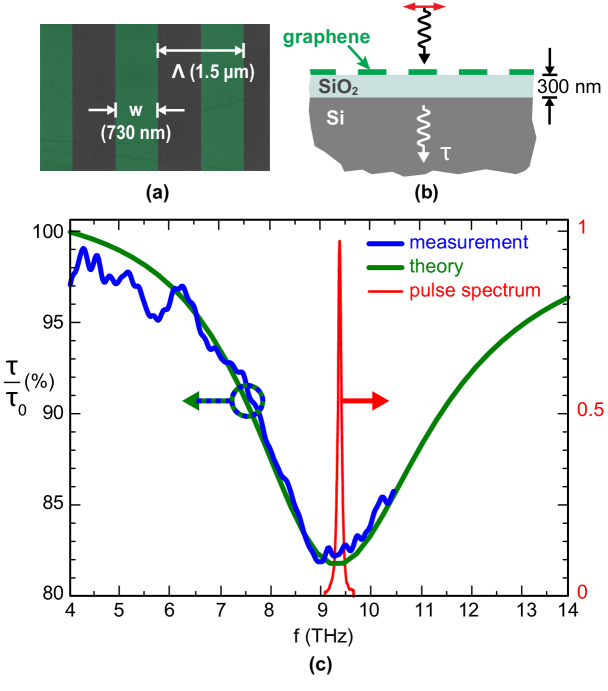
Fig. 1a-b shows the structure, dimensions, and scanning-electron micrograph of the graphene plasmonic resonant structure considered here, and Fig. 1c shows the measured room-temperature linear transmission spectrum of the sample, which exhibits a strong dip in transmission centered at 9.4 THz that is associated with plasmonic absorption of the nanoribbons.
The plasmon resonance can be approximated by assuming an equivalent sheet conductivity of the graphene ribbon array Chen2013 ; Cai2015 (Supplementary Equation S9),
| (1) |
where is the scattering rate and is the Drude weight of graphene with a carrier concentration of and Fermi velocity . The plasmon resonant frequency is related to the Drude weight by , where is the average of the substrate and incident dielectric constants Chen2013 .
The relative power transmission through such a conductive sheet is given by , where denotes the transmission with the graphene film absent, and is the admittance of the incident () or substrate () region (see Supplementary Equation S4.) The green curve in Fig. 1b shows the best-fit transmission spectrum calculated using this model, from which we determined the carrier concentration and graphene scattering rate to be cm-2 and rad/ps, respectively at room temperature, which corresponds to a Fermi energy of 0.35 eV and carrier mobility of 1,250 cm2V-1s-1.
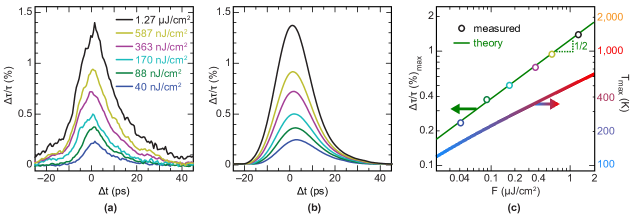
The pump-induced transmission change at the center of the plasmonic resonance was measured with spectrally narrow radiation (cf. Fig. 1c) in a setup that is depicted in Fig. 2. This signal, recorded as a function of the pump-probe delay , is depicted in Fig. 3a for several pump fluences. In all cases, the pump causes a transient increase in transmission that is accompanied by a decrease in absorption. The observed nonlinear response decays in the wake of the pump pulse with a time constant of 10 ps, which is close to the previously reported hot electron-phonon relaxation time in graphene at the measurement temperature (20 K) Winnerl2011 .
The electron temperature in the graphene evolves in response to the terahertz pump pulse with intensity at the center frequency according to Song2012
| (2) |
where is the specific heat of graphene, is the cooling coefficient, is the lattice temperature, is the fractional absorption in the graphene, which itself depends on temperature. is the Boltzmann constant, is the areal mass density, is the speed of sound in graphene, is the Riemann zeta function, is the electron-disorder mean free path, and is the acoustic deformation potential. We assume that the temperature relaxation is dominated by disorder-assisted supercollision cooling Viljas2010 ; Song2012 , rather than momentum-conserving coolingKar2014 .
The fractional absorption appearing in (2) can be derived from the equivalent conductivity (1) (Supplementary Equation S3),
| (3) |
where denotes the carrier frequency of the quasi-CW pump and probe pulses.
The basis of the thermal model is that the Drude weight , scattering rate , and plasmon frequency appearing in (1) implicitly depend upon the electron temperature , which increases when the incident pump pulse is absorbed in the graphene layer.
The temperature-dependent Drude weight DasSarma2011 ; Frenzel2014 and plasmon frequency (supplementary Section S3) are calculated as
| (4) | ||||
| (5) |
The scattering rate also varies with temperature, both because of temperature-dependent scattering from long-range Coulomb impurities and longitudinal acoustic (LA) phonons Chen2008 .
| (6) |
The second term in (6) describes the temperature dependent LA phonon scattering, which was essential in order to match the observed fluence dependence of the nonlinear response, shown in Fig. 3c (see Supplementary Section S4.)
The results from the thermal model (Fig. 3b) are in close agreement with the experimental data (Fig. 2a), and correctly predict the 10 ps response time. The increased transmission is a result of a decreased plasmon frequency, which is caused by a reduced value of the chemical potential at elevated electron temperatures (cf. Eq. (7) and (4)), and a broadening of the resonance caused by a faster scattering rate. Fig. 3c plots the peak value of the (observed and calculated) transient response as a function of the incident pump fluence , which shows an approximate dependence. Along the right axis, we plot the corresponding simulated peak electron temperature as a function of fluence, showing the expected dependence. The observed power scaling was best matched by assuming supercollision cooling as the single dominant cooling mechanism, together with temperature-dependent momentum scattering through LA phononsDasSarma2011 ; Chen2008 .
Only two free parameters were used in the numerical simulations: the acoustic deformation potential and the electron disorder mean free path , which together control the strength of dominant cooling and scattering mechanisms. The observed power scaling seen in Fig. 3c was matched by choosing eV, which is consistent with values reported in the literature for similar graphene Kar2014 ; McKitterick2015 . The mean free path was adjusted to match the overall magnitude of the nonlinearity, from which we obtained nm – which is smaller than that expected from the scattering rate, but consistent with other recent experimental measurements of cooling in large-area grapheneMcKitterick2015 . The origin of this discrepancy remains to be explained.
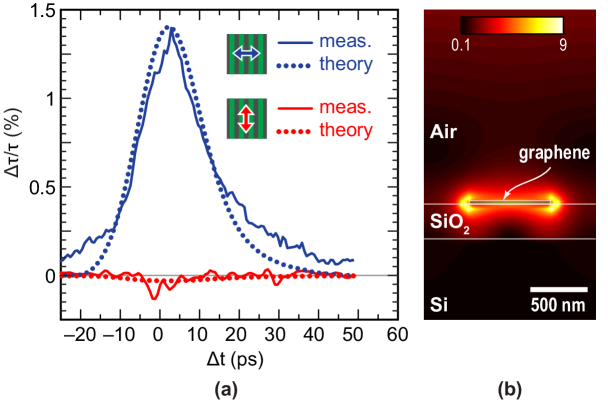
To confirm the plasmonic enhancement of the nonlinearity, we repeated the pump-probe measurements with the pump and probe co-polarized in the direction parallel to the graphene ribbons, thus ensuring that the plasmons are not excited. Fig. 4a compares the measurements from the two polarization cases for the same incident pump fluence and frequency. The measured nonlinearity is far stronger when the plasmons are excited than for the opposite polarization, consistent with the thermal predictions. Fig. 4b shows the electric field profile at the plasmon resonance calcuated using (linear) finite element simulations, showing the dramatic field enhancement that occurs near the graphene sheet, which is responsible for the enhanced nonlinearity.
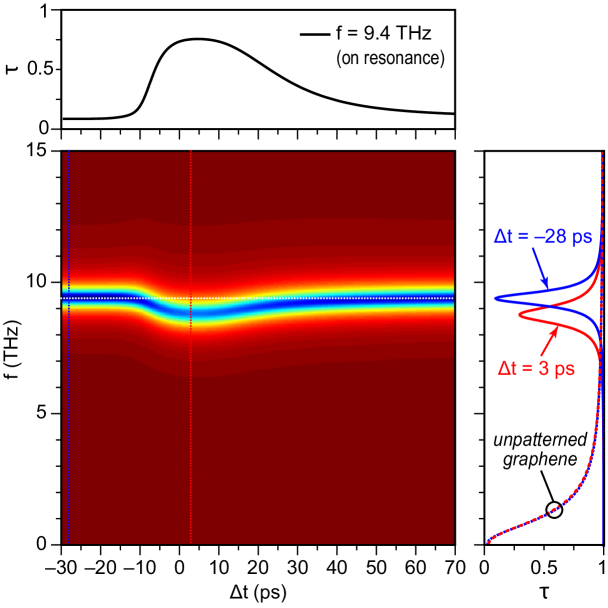
Fig. 5 presents a calculation of how this nonlinearity would be further enhanced by employing higher quality graphene nanoribbons with a mobility of 25,100 cm2V-1s-1Wang2013 . The calculated power transmission is shown as a function of frequency (in the vertical direction) and time (in the horizontal direction), assuming an input fluence of 1.27 J/cm2. The nonlinear transmission is caused by a transient red-shift of the plasmon frequency and broadening of the plasmon linewidth, causing a pump-induced change in transmission of order unity.
To conclude, the temperature dependent absorption, cooling, and scattering of hot electrons in graphene causes a nonlinear response to terahertz waves. Using terahertz pump-probe measurements, we show that when graphene is patterned into sub-wavelength structures that exhibit a plasmon resonance, this nonlinearity is greatly enhanced at the resonant frequency. This enhanced nonlinearity is caused by a stronger on-resonance absorption, followed by a spectral red-shift and broadening of the plasmon resonance with electron temperature. We provide a thermal model that explains the observed nonlinear enhancement, and sheds light on the dominant cooling and scattering mechanisms for hot electrons collectively excited in a graphene plasmon. The theory predicts that in higher-mobility graphene the nonlinearity in transmission could approach unity, enabling high-speed terahertz-induced switching or modulation.

Methods
Device Fabrication: The plasmonic devices were fabricated using CVD-grown monolayer graphene that was transferred onto a oxidized silicon substrate and diced into an 8 mm square chip. The substrate resistivity was 250 cm, and the oxide was 300 nm thick. Graphene ribbons with width 730 nm and period 1.5 m were patterned using electron-beam lithography with a PMMA resist and oxygen plasma etch to remove the graphene from the exposed areas. The graphene grating covered a region of 1.5 1.5 mm.
FEL pump-probe setup: The free electron laser was tuned to produce 5.5 ps pulses at a center frequency of 9.4 THz and a repetition rate of 13 MHz. The beam was split into a pump and probe beams that were delayed relative to one another using a mechanical delay line. In all measurements the pump and probe beams were co-polarized, but the state of polarization could be set to be either perpendicular or parallel to the graphene ribbons, in order to control whether or not the plasmon was excited, respectively. The pump and probe beams were overlapped and focused using an off-axis parabolic mirror onto the graphene ribbon array located at the focus. The sample was cooled to a (lattice) temperature of 20 K for all of the pump-probe measurements. The emerging pump beam was extinguished while the transmitted probe beam was measured using a cryogenically cooled bolometer as a function of the pump-probe delay .
Nonlinear Model: Because of the fast electron-electron scattering time, we assume that the electron population maintains a Fermi distribution, with a temperature that evolves in response to the terahertz pump pulse according to (2). The total electron population must remain constant as the electrons heat and cool, which defines the following implicit relationship between the electron temperature and the chemical potential ,
| (7) |
where is the density of states in graphene. For a given temperature , (7) can be numerically solved to determine the associated chemical potential .
The electron temperature transient was found by numerically integrating (2) using Euler’s method with a time-step of 0.5 ps, assuming a 5.5 ps Gaussian input pulse . At each time-step, the chemical potential, Drude weight, plasmon frequency, conductivity, and fractional absorption for the subsequent timestep were adjusted based upon (7), (4), (5), (1) and (3), respectively.
Knowing the instantaneous temperature transient , the fractional change in probe transmission is then numerically computed as a function of the pump-probe delay using a correlation integral.
Finite Element Calculation: The field-enhancement in the graphene was simulated using frequency-domain finite element calculations, performed on a unit cell with periodic boundary conditions, assuming normally incident plane wave excitation. The graphene was modeled as a thin (40 nm) anisotropic Drude conductor, with parameters adjusted to match the observed room-temperature transmission spectrum.
Author Contributions
M. M. Jadidi, S. Winnerl, H. D. Drew, T. E. Murphy, and M. Mittendorff conceived the experiments. M. M. Jadidi fabricated the device and conceived the theory for the thermal model. M. M. Jadidi and A. B. Sushkov carried out the FTIR measurements. J. Otto and S. Winnerl conducted the FEL pump-probe measurements. All authors contributed to the manuscript.
Acknowledgements
This work was sponsored by the US ONR (N000141310865) and the US NSF (ECCS 1309750). Support from P. Michel and the FELBE-team is gratefully acknowledged.
References
- (1) Ju, L. et al. Graphene plasmonics for tunable terahertz metamaterials. Nature Nanotech. 6, 630–634 (2011).
- (2) Brar, V. W., Jang, M. S., Sherrott, M., Lopez, J. J. & Atwater, H. A. Highly Confined Tunable Mid-Infrared Plasmonics in Graphene Nanoresonators. Nano Lett. 13, 2541–2547 (2013).
- (3) Yan, H. et al. Damping pathways of mid-infrared plasmons in graphene nanostructures. Nature Photon. 7, 394–399 (2013).
- (4) Mikhailov, S. & Ziegler, K. Nonlinear electromagnetic response of graphene: frequency multiplication and the self-consistent-field effects. J. Phys. Condens. Matter. 20 (2008).
- (5) Koppens, F. H. L., Chang, D. E. & García de Abajo, F. J. Graphene Plasmonics: A Platform for Strong Light–Matter Interactions. Nano Lett. 11, 3370–3377 (2011).
- (6) Gullans, M. and Chang, D.E. and Koppens, F. H. L. and García de Abajo, F. J. and Lukin, M. D. Single-photon nonlinear optics with graphene plasmons. Phys. Rev. Lett. 111, 247401 (2013).
- (7) Manjavacas, A., Nordlander, P. & García de Abajo, F. J. Plasmon Blockade in Nanostructured Graphene. ACS Nano 6, 1724–1731 (2012).
- (8) Jablan, M. & Chang, D. E. Multiplasmon Absorption in Graphene. Phys. Rev. Lett. 114, 236801 (2015).
- (9) Kauranen, M. & Zayats, A. V. Nonlinear plasmonics. Nature Photon. 6, 737–748 (2012).
- (10) Hendry, E., Hale, P. J., Moger, J., Savchenko, A. K. & Mikhailov, S. A. Coherent Nonlinear Optical Response of Graphene. Phys. Rev. Lett. 105 (2010).
- (11) Zhang, H., Tang, D. Y., Zhao, L. M., Bao, Q. L. & Loh, K. P. Large energy mode locking of an erbium-doped fiber laser with atomic layer graphene. Opt. Express 17 (2009).
- (12) Hong, S.-Y. et al. Optical Third-Harmonic Generation in Graphene. Phys. Rev. X 3 (2013).
- (13) Zhang, H. et al. Z-scan measurement of the nonlinear refractive index of graphene. Opt. Lett. 37 (2012).
- (14) Jnawali, G., Rao, Y., Yan, H. & Heinz, T. F. Observation of a Transient Decrease in Terahertz Conductivity of Single-Layer Graphene Induced by Ultrafast Optical Excitation. Nano Lett. 13, 524–530 (2013).
- (15) Shi, S.-F. et al. Controlling Graphene Ultrafast Hot Carrier Response from Metal-like to Semiconductor-like by Electrostatic Gating. Nano Lett. 14, 1578–1582 (2014).
- (16) Kadi, F. et al. Microscopic Description of Intraband Absorption in Graphene: The Occurrence of Transient Negative Differential Transmission. Phys. Rev. Lett. 113, 035502 (2014).
- (17) Mics, Z. et al. Thermodynamic picture of ultrafast charge transport in graphene. Nat. Commun. 6, 7655 (2015).
- (18) Jadidi, M. M. et al. Tunable Terahertz Hybrid Metal-Graphene Plasmons. Nano Lett. 15, 7099–7104 (2015).
- (19) Yao, X., Tokman, M. & Belyanin, A. Efficient Nonlinear Generation of THz Plasmons in Graphene and Topological Insulators. Phys. Rev. Lett. 112 (2014).
- (20) Chen, P.-Y. & Alù, A. Terahertz Metamaterial Devices Based on Graphene Nanostructures. IEEE Trans. THz Sci. Technol. 3, 748–756 (2013).
- (21) Cai, X. et al. Plasmon-enhanced Terahertz Photodetection in Graphene. Nano Lett. 15, 4295–4302 (2015).
- (22) Winnerl, S. et al. Carrier Relaxation in Epitaxial Graphene Photoexcited Near the Dirac Point. Phys. Rev. Lett. 107, 237401 (2011).
- (23) Song, J. C. W., Reizer, M. Y. & Levitov, L. S. Disorder-Assisted Electron-Phonon Scattering and Cooling Pathways in Graphene. Phys. Rev. Lett. 109, 106602 (2012).
- (24) Viljas, J. K. & Heikkilä, T. T. Electron-phonon heat transfer in monolayer and bilayer graphene. Phys. Rev. B 81, 245404 (2010).
- (25) Kar, S., Mohapatra, D. R., Freysz, E. & Sood, A. K. Tuning photoinduced terahertz conductivity in monolayer graphene: Optical-pump terahertz-probe spectroscopy. Phys. Rev. B 90, 165420 (2014).
- (26) Das Sarma, S., Adam, S., Hwang, E. H. & Rossi, E. Electronic transport in two-dimensional graphene. Rev. Mod. Phys. 83, 407–470 (2011).
- (27) Frenzel, A. J., Lui, C. H., Shin, Y. C., Kong, J. & Gedik, N. Semiconducting-to-Metallic Photoconductivity Crossover and Temperature-Dependent Drude Weight in Graphene. Phys. Rev. Lett. 113, 056602 (2014).
- (28) Chen, J.-H., Jang, C., Xiao, S., Ishigami, M. & Fuhrer, M. S. Intrinsic and extrinsic performance limits of graphene devices on SiO2. Nature Nanotech. 3, 206–209 (2008).
- (29) McKitterick, C. B., Rooks, M. J. & Prober, D. E. Electron-phonon cooling in large monolayer graphene devices. arXiv:1505.07034 [cond-mat.mes-hall] (2015).
- (30) Wang, L. et al. One-Dimensional Electrical Contact to a Two-Dimensional Material. Science 342, 614–617 (2013).