Direct loading of a large Yb MOT on the transition
Abstract
We report a robust technique for laser frequency stabilisation that enables the reproducible loading of in excess of 109 Yb atoms from a Zeeman slower directly into a magneto-optical trap (MOT) operating on the transition, without the need for a first stage MOT on the transition. We use a simple atomic beam apparatus to generate narrow fluorescence signals on both the 399 nm transition used for the Zeeman slower and the 556 nm transition. We present in detail the methods for obtaining spectra with a high signal-to-noise ratio and demonstrate error signals suitable for robust frequency stabilisation. Finally we demonstrate the stability and precision of our technique through sensitive measurements of the gravitational sag of the Yb MOT as a function of the intensity of the laser cooling beams, which are in good agreement with theory. These results will be important for efficient loading of the atoms into an optical dipole trap.
1 Introduction
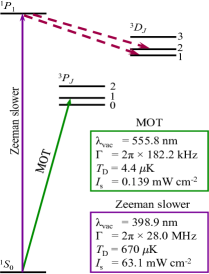
Ultracold ytterbium (Yb) atoms have found many interesting applications in modern AMO physics. Examples include studies of new quantum phases [1, 2], atomic clocks [3, 4, 5, 6], tests of time-reversal symmetry [7], nuclear parity non-conservation [8] and quantum information processing [9, 10]. The large range of Yb isotopes, 5 bosonic and 2 fermionic, makes this atom ideal for the investigation of degenerate Bose-Bose and Bose-Fermi mixtures [11, 12]. Notably, the fermionic isotope 173Yb is of great interest due to recent theoretical and experimental work leading to the observation of a unique orbital Feshbach resonance [13, 14, 15], allowing tunability of interactions in a system with SU() symmetry [16]. Similarly, the scaling of the interspecies scattering length with reduced mass [17] makes Yb a strong candidate for the observation of novel Feshbach resonances in mixtures of alkali and alkaline-earth-like systems [18, 19]. All these ultracold atom experiments start with the production of an Yb magneto-optical trap (MOT), which ideally should load quickly and reproducibly to a large number of atoms at the lowest achievable temperatures. This first stage is generally followed by evaporative cooling in an optical trap where large, reproducible MOTs are a prerequisite to reliable production of large Bose-Einstein condensates. It is therefore vitally important that the lasers used to cool and trap the Yb atoms have well stabilised frequencies. Ytterbium possesses two transitions suitable for laser cooling, the strong violet transition at 399 nm and the weakly allowed intercombination green transition at 556 nm. A diagram detailing the properties of these transitions is shown in Figure 1.
The 399 nm transition is commonly used for Zeeman slowing of an Yb atomic beam as the large linewidth and short wavelength lead to a large maximum deceleration. Numerical simulations [20] show that, for reproducible slowing, a frequency stability better than MHz is required for the Zeeman slower light, well below the natural linewidth, MHz, of the transition. This transition is also used for absorption imaging as its high saturation intensity of 63 mW/cm2 allows images to be recorded with good signal-to-noise in short times of order ten s. Accurate measurement of atom numbers from absorption imaging using this transition requires the absolute laser frequency to be stabilised to better than approximately MHz. Although the 399 nm transition is well suited to Zeeman slowing and imaging, it is not ideal for trapping and cooling in a MOT. The large linewidth gives a high Doppler temperature of 670 K while decay from to the metastable levels causes a strong loss of atoms from the cooling cycle [21]. Instead the closed, two-level transition at 556 nm is more suitable for the MOT. This transition is narrow, with a Doppler temperature of only 4.4 K (although a temperature of 30 K is more realistic [19]). However, the narrow linewidth results in a greatly reduced MOT capture velocity of 7 m; this requires precise operation of the Zeeman slower. Furthermore, to achieve optimal loading of the MOT, the 556 nm laser must be simultaneously stabilised to below the natural linewidth, kHz, of the cooling transition. The above requirements necessitate the production of Yb spectra with narrow linewidths and, ideally, a high signal-to-noise ratio (SNR).
In contrast to the alkalis, Yb has a low vapour pressure at room temperature [22]. When heated to the temperatures required for significant absorption ( ∘C) ytterbium reacts with glass, so spectroscopy of ytterbium atoms cannot be performed in conventional vapour cells. Designs have been created that circumvent this problem [23, 24] but are necessarily bulky. Hollow-cathode lamps [25, 26] are an alternative for absorption spectroscopy but these significantly broaden the features ( 1 GHz), making sub-MHz frequency stabilisation difficult. Another alternative is stabilisation of lasers to a high finesse optical cavity [27, 28].
In this paper we demonstrate the production and measurement of large stable Yb MOTs using the green transition for the MOT and the violet transition for the Zeeman slower and for absorption imaging. We place considerable emphasis on the production of Yb fluorescence spectra with high SNR and the stabilisation of the lasers to those spectra, as this underpins the performance of our experiment. In sections 2 and 3 of this paper we describe and demonstrate the production of fluorescence spectra from a simple Yb atomic beam apparatus. We include spectra of the 171Yb and 173Yb fermionic isotopes only, isolated by a polarisation technique [29, 30] from their normal overlap with lines from the remaining five bosonic isotopes. In section 4 we discuss the frequency stabilisation techniques that we use to lock lasers to the 399 nm and 556 nm transitions. Finally, in section 5, to demonstrate the stability of this locking, we present measurements of an Yb MOT operating on the 556 nm transition. We show the direct loading of a MOT of Yb atoms from a Zeeman slower without the need for a first stage operating on the 399 nm transition. We also present absorption images and measurements of the gravitational sag of the cold Yb atoms, which is highly sensitive to detuning and important for optimising the transfer to a dipole trap.
2 Experimental Setup
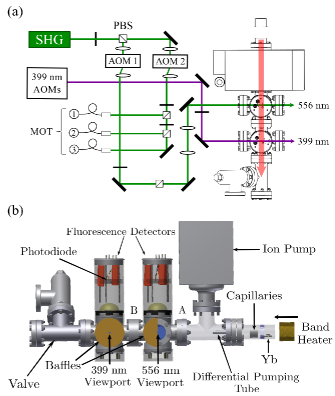
An overview of the laser setup used for the fluorescence spectroscopy and MOT measurements is shown in Figure 2(a). The 556 nm light is produced by frequency doubling a fibre laser operating at 1112 nm (Menlo Systems Orange One) to produce powers of up to 250 mW. The green light is then split into two paths by a polarising beamsplitter (PBS) cube. A pair of single-passed 200 MHz acousto-optic modulators (AOM) (Gooch and Housego, 46200-0.3-LTD) are used to set the required MOT detuning. The MOT light is delivered to the main experiment via three polarisation maintaining single-mode fibres. Intensity or detuning ramps are achieved using AOM 2 to control the power and frequency of the light. AOM 1 is used to apply a small modulation (dither) to the frequency of the light to allow frequency stabilisation to the atomic fluorescence (further details in section 4). The light after AOM 1 is expanded by a telescope to 1.95 mm, in order to increase the interaction volume of the laser light with the atomic beam.
The 399 nm light is produced by a commercial diode laser (Toptica DL Pro HP) which supplies up to 100 mW of single mode light. The majority of this is used for Zeeman slowing, with only a few mW being split off to the spectroscopy apparatus for both frequency stabilisation and to derive the light for absorption imaging. For the spectroscopy, prior to the intersection with the atomic beam, the light passes through two AOMs, each in a double pass configuration, which set the large detuning of 600 MHz required for Zeeman slowing [20]. A third double passed AOM is used to give variable detuning of the imaging light. After the AOMs, the 399 nm light passes through the viewport of the spectroscopy apparatus with a measured 1/ waist of 0.50 mm before intersecting the atomic beam. Further details of our dual species CsYb atom-trapping experimental setup may be found in [19].
2.1 Atomic beam apparatus
Figure 2(b) illustrates the main components of the atomic beam spectroscopy apparatus, structurally similar to [30], consisting of a steel vacuum chamber with two external assemblies for fluorescence detection and an external oven heater. The oven section is connected to the main section by a differential pumping tube of diameter 5 mm and length 50 mm.
Bright, collimated atomic beams may be produced [31, 32] by using an array of parallel capillary tubes as the oven aperture, where the diameter of the tubes is smaller than the mean free path, , of the effusing gas and the length of the tubes is commensurate with . For a Maxwell-Boltzmann distribution, the mean free path is [33], where is the pressure of the gas, is the temperature of the gas and is the scattering cross section. For the purposes of estimation we take to be the van der Waals diameter of an ytterbium atom, 560 pm [34]. This yields a value for the mean free path of the order of 10 mm for our oven operating at C. Our oven aperture consists of such an array of 55 capillary tubes each of internal diameter 0.58 mm and length 20 mm, positioned in front of a 5 mm diameter aperture in the oven wall. The capillary array can be removed to allow recharging of the Yb through the aperture. To produce a suitable Yb vapour pressure of order mbar, the band heater surrounding the oven (Watlow ) is raised to over 450 ∘C. A horizontal, collimated Yb atomic beam then effuses from the capillaries and passes through two further apertures, the first of diameter 6 mm, the second of diameter 8 mm, positioned as shown in Figure 2(b).
2.2 Fluorescence Detector
Each six-way cross is fitted with four viewports allowing a horizontal laser beam at either 556 or 399 nm to intersect the atomic beam at 90∘. The resulting resonance fluorescence is collected by custom built detectors based on designs presented in Refs [35, 36]. The fluorescence is collected by a 50 mm diameter aspheric lens with a focal length of 32 mm placed immediately above the upper viewport as shown in Figure 3. The lower viewport is fitted with a 50 mm diameter, 38 mm focal length retroreflecting mirror which serves to increase the amount of fluorescence detected by a factor of approximately three. This is more than the expected factor of two because fluorescence initially propagating downwards is reflected off the insides of the vacuum chamber and finds its way back via the lower mirror and upper collection lens to the photodiode. The two horizontal viewports are covered by light baffles, each with a small central aperture of 5 mm diameter; these block out unwanted extraneous light and also define a laser beam path that is orthogonal to the atomic beam. For the 556 nm laser it proved beneficial to use anti-reflection coated viewports for beam access to reduce the scattered light reaching the photodiode. The photodiode and its transimpedance amplifier are mounted together on a circular printed circuit board (PCB) which slides on three rods, thus allowing position adjustment to maximise the fluorescence signal.
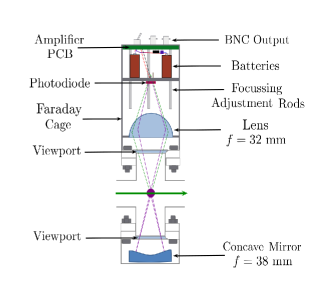
Our custom-built fluorescence detector gives an excellent SNR without the expense of a photomultiplier and despite the low levels of fluorescence. A transimpedance amplifier, of very high gain yet low noise, is placed close to a standard large area photodiode (Centronics OSD50-T) inside a Faraday cage clamped over the vacuum viewport flange. The amplifier is powered by two 9 V batteries placed inside the cage and the amplified differential signal is carried out of the cage to the differential input of the lock-in amplifier via two BNC cables. Thus the entire circuit is protected against RF pickup and noise that might be otherwise injected from a power supply. The operational amplifier is a low input-noise device (Analog Devices AD795) [37] with input pins protected by a guard ring to eliminate the effect of tiny currents that can flow in the PCB substrate. A ‘tee resistor network’ [38] consisting of three resistors (of values 10 M, 10 M, 100 k) produces an effective transimpedance gain of up to V/A [38], although we found that a gain in the range V/A was adequate for our purposes. This high gain allows us to run the atomic beam at relatively low density, thereby conserving atoms and extending the lifetime of the Yb source. At our oven operating temperature of 470 ∘C, measured at the external band heater, we have so far found that 5 grams of Yb has lasted for over two years with usage of 10 hours/day. This scheme is widely applicable to other alkaline-earth-like elements with narrow laser cooling transitions. A similar apparatus is also used at Durham to frequency stabilise lasers to the cooling transition in strontium, where an additional, counter-propagating pump beam is used to generate linewidths narrower than the residual Doppler broadening [36].
3 Fluorescence spectroscopy of the atomic beam
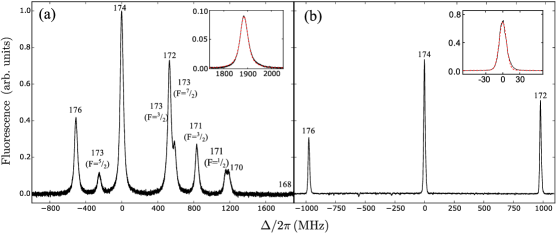
Typical fluorescence spectra obtained with our system are shown in Figure 4. In Figure 4(a), the spectrum from the state at 399 nm is obtained with a modest laser power of 33 W and an oven temperature of 470 ∘C, demonstrating the excellent SNR of this system. Note that the spectra shown are the result of a 10-point moving average applied to the data by the oscilloscope. We see signals from all the isotopes of ytterbium with the exception of 168Yb, which has an extremely low natural abundance of 0.13% [40]. However, in the inset of Figure 4(a), we clearly see 168Yb with a SNR greater than by increasing the oven temperature to 540 ∘C. The effect of Doppler broadening on the spectra at 399 nm creates a line shape described by a Voigt profile with FWHM of 40.0 MHz; this value is obtained from a least squares fit to the 168Yb peak [41, 42]. The Gaussian contribution to the Voigt profile is dominated by 19.5 MHz of Doppler broadening, while the Lorentzian contribution is 30.0 MHz.
A SNR greater than is also evident in spectrally narrow features of the state at 556 nm as shown in Figure 4(b). The inset in Figure 4(b) shows the 174Yb resonance fitted with a Voigt profile. The lineshape of the feature appears to be Gaussian, consistent with the narrow linewidth of the transition dominated by Doppler broadening. The largest component of homogeneous broadening is 1.3 MHz of power broadening due to the 460 W of 556 nm light having an intensity of around when intersecting the atomic beam. Therefore, in the Voigt fit to the data we constrain the width of the Lorentzian component to be 1.3 MHz, resulting in a FWHM of 15.0 MHz. The Gaussian contribution has a Doppler width of 14.3 MHz due to the transverse spreading of the atomic beam. From this measurement of the Doppler broadening and using the mean speed of an effusive beam, , we estimate the HWHM atom effusion angle to be 11 mrad.
A Doppler shift also occurs due to any small departure of the crossing angle of the laser and the atomic beam from 90∘. The shift, , due to this effect is described by , where is the wavelength of the transition and is the crossing angle of the laser and the atomic beam. This equation shows that small departures from 90∘ result in an offset in the centre frequency of around 11 MHz per degree for the transition at . A method for detection and correction of this offset is described in Section 4.
The five bosonic isotopes do not exhibit hyperfine structure as they have a nuclear spin of . Hence, the relative peak heights of transitions in the bosons are directly proportional to their natural abundances, this is clearly exhibited in Figure 4(a) where the 174Yb peak is 2.5 times higher than the 176Yb peak, in good agreement with their respective natural abundances of 31.8% and 12.7% [40]. On the other hand, the fermionic isotopes 171Yb and 173Yb possess hyperfine structure due to their non-zero nuclear spin of and respectively.
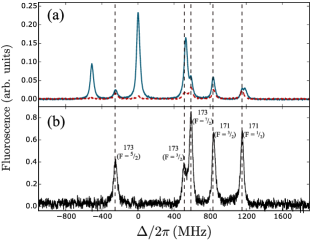
Figure 5 illustrates the production of a purely fermionic spectrum. The detected fluorescence spectra for two orthogonal cases of linear polarisation of the 399 nm laser for P = 265 W are shown in Figure 5(a), where horizontal polarisation is shown in blue and vertical polarisation in red. The suppression of the fluorescence for the bosonic isotopes is due to their lack of ground state structure and can be exploited to obtain a purely fermionic spectrum [29, 30], allowing precise measurement of the hyperfine splittings and isotope shifts. Due to the large collection angle of the fluorescence detector we do not see a perfect extinction of the boson signal. However, by subtracting the horizontally polarised signal from the vertically polarised signal (multiplied by a suitable factor of about 0.033 to match the heights of the bosonic peaks), we obtain the fermion spectrum shown in Figure 5(b). Here we resolve all the hyperfine components of 173Yb and 171Yb, including the and transitions of 173Yb which are typically masked by 172Yb. The high SNR of the raw signals mean that even after this subtraction process, the resulting SNR remains reasonable.
4 Frequency stabilisation
The spectroscopic techniques detailed above are used to stabilise the frequency of our 399 nm and 556 nm lasers to any isotope by locking to the atomic beam spectrum. For the 399 nm laser we use phase sensitive detection by modulation of the laser current at a frequency of 3.7 kHz, with a depth of MHz on the laser frequency. The resulting fluorescence signal is demodulated by a lock-in amplifier to generate the dispersive error signal.
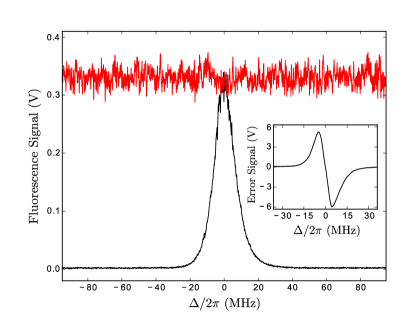
The challenging task of locking to the 556 nm transition is typically accomplished by utilising a combination of an optical cavity and atomic spectroscopy to achieve the required frequency stability [27, 28]. Here, we demonstrate that simple phase sensitive detection of the fluorescence signal from the atomic beam apparatus is sufficient to load a large MOT of Yb atoms. For phase sensitive detection of the 556 nm beam, we use an AOM to apply a dither at a frequency of 3 kHz to the AOM shift centred at 217 MHz that results in optical frequency excursions of depth MHz. The detected fluorescence is demodulated by a lock-in amplifier yielding a dispersive error signal. Figure 6 shows the fluorescence peak of 174Yb scanned over the transition (black) and the detected fluorescence when the laser is locked to the transition (red). The associated dispersive error signal is displayed in the inset and has a central slope of 1.22 V/MHz measured at the output of the lock-in amplifier. The level of noise on the fluorescence signal when the laser is locked suggests the short term fluctuations are below 1 MHz.
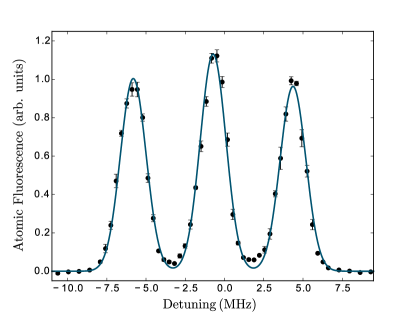
In order to measure any systematic offset in the lock to the transition, we exploit the magnetically insensitive transition in 174Yb as follows. We first load a MOT of 174Yb atoms at a total MOT beam intensity of , where is the sum of the intensities of all six beams. We then turn off the magnetic field gradient and the MOT light and immediately apply a 2.4 G bias field to produce a Zeeman shift for the magnetically sensitive states. The MOT beams are then pulsed back on at an intensity of and the fluorescence from the cold atoms is detected. A plot of the detected atomic fluorescence against the detuning of the pulsed MOT light from the locked laser is shown in Figure 7. The figure shows the three expected peaks for the , and states, with the centre frequency of the peak found to be offset by MHz prior to calibration. The most likely cause of the offset is a small deviation of the crossing angle between the laser and the atomic beam of 0.070 from 90∘. This offset can then be corrected to zero by compensation with AOM 1.
5 Laser cooling of Yb
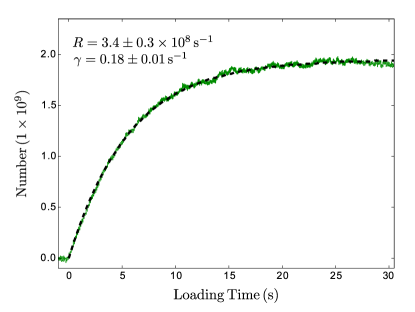
The efficiency of the loading of Yb MOTs is strongly dependent on the performance of the frequency stabilisation of the narrow 556 nm transition. In Figure 8 we demonstrate the production of a large Yb MOT with a steady state atom number of atoms. We achieve this number using 556 nm light with a total beam intensity of and a detuning of 4.6 MHz. The axial magnetic field gradient is 3.4 G/cm. We extract the atom number from fluorescence measurements of the MOT, this is calibrated by absorption imaging on the 399 nm transition and agrees well with the number calculated from the fluorescence directly.
The loading of atoms in a MOT can be simply modelled by the equation
| (1) |
where is the number of atoms in the MOT, is the loading time, is the loss rate and is the loading rate. A least squares fit of the equation to the data is shown by the dashed line in Figure 8, from which we find a loading rate of s-1. This efficient loading of the MOT is accomplished without the need for frequency sidebands on the MOT light, a technique commonly employed [43] to increase the low capture velocity of 556 nm transition. This result shows that the 399 nm Zeeman laser is frequency stabilised below the MHz required for optimum operation [20].
To further demonstrate that the lasers are stably and reliably locked with our Yb atomic beam apparatus, we include in Figure 9 a series of absorption images and measurements of an Yb MOT sagging under gravity with low intensities of MOT light. Under these low intensity conditions, the vertical MOT position is extremely sensitive to the MOT detuning [44, 36]. To produce the images in Figure 9(a) we directly load a MOT of 174Yb atoms using the 556 nm transition at an intensity of . After loading the MOT, we ramp down the intensity of the MOT light before taking an absorption image of the lowered atoms using the strong transition.
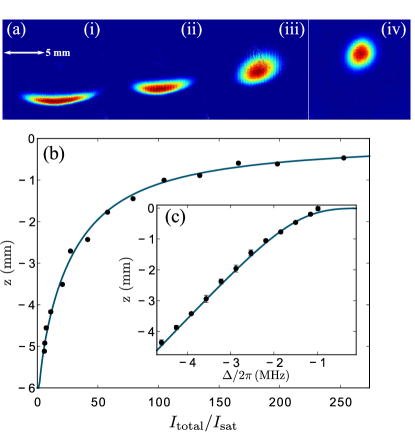
In Figure 9(b) we measure the depth of the sag as a function of intensity and we see that the MOT drops a distance of up to 5 mm, which is greater than its initial size. This position shift is an important parameter when utilising intensity and detuning ramps to reach lower temperatures [19] before loading the atoms into an optical dipole trap. The equilibrium position may be determined by equating the force due to gravity with the net scattering force due to the two vertical MOT beams. This yields
| (2) |
where is the detuning of the light, is the standard acceleration due to gravity, is the magnetic field gradient in the direction, is the effective magnetic moment, is the Landé g-factor of the state and is the Bohr magneton. The blue line in Figure 9(b) is a fit of Equation (2) to the experimental data (circles), with fit parameters: MOT detuning MHz and axial gradient G/cm. In Figure 9(c) we measure the sag as a function of detuning . The blue line is again a fit to the experimental data (circles) using Equation (2), in this case with fit parameters of: total MOT intensity and axial gradient G/cm. The excellent agreement between the experimental and fitted data in Figure 9(c) over a range of detunings of 4 MHz shows that our detuning is stable to below the power-broadened linewidth of the transition and is highly reproducible during an experimental run of several hours duration. This reproducibility, combined with our understanding of the gravitational sag, are essential prerequisites to loading the atoms into an optical dipole trap for subsequent cooling to quantum degeneracy.
6 Conclusion
We have demonstrated a simple approach to laser frequency stabilisation that enables the reproducible loading of a large number of Yb atoms directly into a MOT operating on the 556 nm transition. In our apparatus, an oven produces a well collimated atomic beam which is probed by resonant laser light, crossing at 90∘ to reduce Doppler broadening. The fluorescence from the atoms is detected using a high numerical aperture lens and a high-gain photodiode circuit. We presented fluorescence spectra obtained with this apparatus for both Yb laser cooling transitions (at 399 nm and 556 nm) and showed that they are suitable for generating high SNR dispersive error signals for laser locking without the need for saturated absorption techniques [24, 26]. By switching the laser polarisation we were also able to derive a spectrum for the two fermionic isotopes only. We also show that the laser lock may be calibrated to better than 1 MHz using Yb MOT fluorescence measurements of the magnetically insensitive transition of the state. The performance of the locking is demonstrated by the loading of a large ( atoms) Yb MOT without the use of frequency sidebands on the MOT light or an optical cavity in the locking scheme. The stability and reproducibility of the lock to the narrow transition is demonstrated by measurements of an Yb MOT sagging under gravity at low MOT light intensities. We have used this system to lock both the 399 nm and 556 nm lasers for over 2 years, during which time the spectroscopy has been highly reproducible. The approach is also applicable to other alkaline earth and lanthanide elements with narrow laser cooling transitions [36, 45, 46, 47, 48, 49]. We expect our work will be of interest to other groups starting to construct experiments to study ultracold quantum gases of Yb, where robust and reproducible laser frequency stabilisation is an essential prerequisite to cooling to quantum degeneracy.
References
References
- [1] Liu W V, Wilczek F and Zoller P 2004 Phys. Rev. A 70(3) 033603
- [2] Taie S, Yamazaki R, Sugawa S and Takahashi Y 2012 Nature Phys. 8 825–830 ISSN 1745-2473
- [3] Hoyt C W, Barber Z W, Oates C W, Fortier T M, Diddams S A and Hollberg L 2005 Phys. Rev. Lett. 95(8) 083003
- [4] Barber Z W, Hoyt C W, Oates C W, Hollberg L, Taichenachev A V and Yudin V I 2006 Phys. Rev. Lett. 96(8) 083002
- [5] Porsev S G, Derevianko A and Fortson E N 2004 Phys. Rev. A 69(2) 021403
- [6] Hinkley N, Sherman J A, Phillips N B, Schioppo M, Lemke N D, Beloy K, Pizzocaro M, Oates C W and Ludlow A D 2013 Science 341 1215–1218
- [7] Natarajan V 2005 The European Physical Journal D - Atomic, Molecular, Optical and Plasma Physics 32 33–38 ISSN 1434-6060
- [8] DeMille D 1995 Phys. Rev. Lett. 74(21) 4165–4168
- [9] Hayes D, Julienne P S and Deutsch I H 2007 Phys. Rev. Lett. 98(7) 070501
- [10] Reichenbach I and Deutsch I H 2007 Phys. Rev. Lett. 99(12) 123001
- [11] Fukuhara T, Sugawa S, Takasu Y and Takahashi Y 2009 Phys. Rev. A 79(2) 021601
- [12] Taie S, Takasu Y, Sugawa S, Yamazaki R, Tsujimoto T, Murakami R and Takahashi Y 2010 Phys. Rev. Lett. 105(19) 190401
- [13] Zhang R, Cheng Y, Zhai H and Zhang P 2015 Phys. Rev. Lett. 115(13) 135301
- [14] Höfer M, Riegger L, Scazza F, Hofrichter C, Fernandes D R, Parish M M, Levinsen J, Bloch I and Fölling S 2015 Phys. Rev. Lett. 115(26) 265302
- [15] Pagano G, Mancini M, Cappellini G, Livi L, Sias C, Catani J, Inguscio M and Fallani L 2015 Phys. Rev. Lett. 115(26) 265301
- [16] Scazza F, Hofrichter C, Höfer M, De Groot P C, Bloch I and Fölling S 2014 Nature Phys. 10 779–784 ISSN 1745-2473
- [17] Munchow F, Bruni C, Madalinski M and Gorlitz A 2011 Phys. Chem. Chem. Phys. 13(42) 18734–18737
- [18] Brue D A and Hutson J M 2013 Phys. Rev. A 87(5) 052709
- [19] Kemp S L, Butler K L, Freytag R, Hopkins S A, Hinds E A, Tarbutt M R and Cornish S L 2016 Review of Scientific Instruments 87 023105
- [20] Hopkins S A, Butler K, Guttridge A, Kemp S, Freytag R, Hinds E A, Tarbutt M R and Cornish S L 2016 Review of Scientific Instruments 87 043109
- [21] Honda K, Takahashi Y, Kuwamoto T, Fujimoto M, Toyoda K, Ishikawa K and Yabuzaki T 1999 Phys. Rev. A 59(2) R934–R937
- [22] Cottrell T and Hultgren R 1973 Selected values of the thermodynamic properties of the elements (Metals Park, Ohio : American Society for Metals)
- [23] Ishchenko V N, Kochubei S A, Rubtsova N N, Khvorostov E B and Yevseyev I V 2002 Laser Physics 12 1079–1088
- [24] Jayakumar A, Plotkin-Swing B, Jamison A O and Gupta S 2015 Review of Scientific Instruments 86 073115
- [25] Kim J I, Park C Y, Yeom J Y, Kim E B and Yoon T H 2003 Opt. Lett. 28 245–247
- [26] Loftus T, Bochinski J R, Shivitz R and Mossberg T W 2000 Phys. Rev. A 61(5) 051401
- [27] Maruyama R, Wynar R H, Romalis M V, Andalkar A, Swallows M D, Pearson C E and Fortson E N 2003 Phys. Rev. A 68(1) 011403
- [28] Xiong Z, Long Y, Xiao H, Zhang X, He L and Lü B 2011 Chin. Opt. Lett. 9 041406
- [29] Zinkstok R, van Duijn E J, Witte S and Hogervorst W 2002 Journal of Physics B: Atomic, Molecular and Optical Physics 35 2693
- [30] Long Y, Xiong Z, Zhang X, Zhang M, Lü B and He L 2014 Chin. Opt. Lett. 12 021401
- [31] Ross K and Sonntag B 1995 Rev. Sci. Instrum. 66 4409–4433
- [32] Giordmaine J and Wang T 1960 J. Appl. Phys. 31 463–471
- [33] Ramsey N 1986 Molecular Beams (Oxford Science Publications)
- [34] Alvarez S 2013 Dalton Trans. 42(24) 8617–8636
- [35] Quessada A 2005 Development of an optical clock based on trapped strontium atoms: realization of an ultra-stable laser and frequency stability Ph.D. thesis Université Pierre et Marie Curie - Paris VI
- [36] Boddy D 2014 First observations of Rydberg blockade in a frozen gas of divalent atoms Ph.D. thesis Durham University
- [37] Details of correct use may be found in http://www.analog.com/media/en/technical-documentation/data-sheets/ad795.pdf and http://dx.doi.org/10.15128/9s1616164
- [38] 1995 Photodiode monitoring with op amps Application Bulletin AB-075 Burr-Brown Corporation
- [39] Das D, Barthwal S, Banerjee A and Natarajan V 2005 Phys. Rev. A 72(3) 032506
- [40] De Laeter J R, Böhlke J K, De Bièvrevre P, Hidaka H, Peiser H S, Rosman K J R and Taylor P D P 2009 Pure Appl. Chem. 75 683–800 ISSN 13653075
- [41] Newville M, Stensitzki T, Allen D B and Ingargiola A 2014 Lmfit: Non-linear least-square minimization and curve-fitting for python
- [42] Hughes I G and Hase T P A 2010 Measurements and their Uncertainties (Oxford University Press)
- [43] Peng-Yii Z, Zhuan-Xian X, Yun L, Ling-Xiang H and Bao-Long L 2009 Chinese Physics Letters 26 083702
- [44] Ludlow A D 2008 The Strontium Optical Lattice Clock: Optical Spectroscopy with Sub-Hertz Accuracy Ph.D. thesis University of Colorado
- [45] De S, Dammalapati U, Jungmann K and Willmann L 2009 Phys. Rev. A 79(4) 041402
- [46] Sukachev D, Sokolov A, Chebakov K, Akimov A, Kanorsky S, Kolachevsky N and Sorokin V 2010 Phys. Rev. A 82(1) 011405
- [47] Guest J R, Scielzo N D, Ahmad I, Bailey K, Greene J P, Holt R J, Lu Z T, O’Connor T P and Potterveld D H 2007 Phys. Rev. Lett. 98(9) 093001
- [48] Maier T, Kadau H, Schmitt M, Griesmaier A and Pfau T 2014 Opt. Lett. 39 3138–3141
- [49] Frisch A, Aikawa K, Mark M, Rietzler A, Schindler J, Zupanič E, Grimm R and Ferlaino F 2012 Phys. Rev. A 85(5) 051401