14(7,1) Published: Physical Review B 92, 235206 (2015)
Coupling between Phonon-Phonon and Phonon-Impurity Scattering: A Critical Revisit of the Spectral Matthiessen’s Rule
Abstract
The spectral Matthiessen’s rule is commonly used to calculate the total phonon scattering rate when multiple scattering mechanisms exist. Here we predict the spectral phonon relaxation time of defective bulk silicon using normal mode analysis based on molecular dynamics and show that the spectral Matthiessen’s rule is not accurate due to the neglect of the coupling between anharmonic phonon-phonon scattering and phonon-impurity scattering . As a result, the spectral Matthiessen’s rule underestimates the total phonon scattering rate, and hence overestimates the thermal conductivity of mass-doped and Ge-doped silicon by about 20-40%. We have also directly estimated this coupling scattering rate, so-called coupled five-phonon scattering , and achieved good agreement between and the total scattering rate .
pacs:
66.70.Df, 61.72.-y, 63.20.kp, 63.20.kgThe spectral Matthiessen’s (M’s) rule is a general rule to estimate the total spectral scattering rate when multiple scattering mechanisms exist at the same time Ziman (1960). In most solids, phonon transport is governed by phonon-phonon scattering , phonon-impurity scattering , phonon-boundary scattering , etc., where specifies a phonon mode with wave vector and dispersion branch . By adding all of these factors, the spectral M’s rule gives the total scattering rate as . This scattering rate plays a crucial rule in predicting thermal conductivity based on the Boltzmann transport equation (BTE) , where is the projection of the phonon group velocity along the transport direction, is the volume, is phonon specific heat per mode not (a), and the summation is done over all the resolvable phonon modes Turney et al. (2009). This approach has been applied to predict the thermal conductivities of isotope-rich semiconductors Lindsay et al. (2013a); Lindsay and Broido (2008); Lindsay et al. (2012), alloys Garg et al. (2011); He et al. (2012); Tian et al. (2012), nanostructures Mingo and Yang (2003); Martin et al. (2009), etc. Feng and Ruan (2014). However, as an empirical rule, the M’s rule assumes that the scattering mechanisms are independent, which was usually not verified in those calculations employing them. The spectral M’s rule has not been examined yet, although the failures of the conventional gray M’s Rules, i.e., or for electrical transport Ziman (1960); Takeda and Pearsall (1980) and or for phonon transport Turney et al. (2010); Luisier (2013) have been studied extensively, where , , and are the electron mobility, electrical conductivity and effective phonon mean free path, respectively. Take phonon transport for instance, the correct approach is to first obtain the spectral total relaxation time using the spectral M’s rule , and then derive the thermal conductivity using the Boltamann transport equation (BTE) , where , , and are the phonon specific heat, group velocity, and phase velocity, respectively. It can be conveniently shown that only if all the ’s have the same dependence, one can first use BTE to obtain the partial thermal conductivity due to one scattering mechanism , and then use the gray M’s rule to obtain the same total thermal conductivity , i.e., the gray M’s rule is valid. However, in general the ’s have different dependencies. Therefore, the failure of the gray M’s rule can be expected, while the spectral M’s rule has been assumed to be valid all the time. Thus in this paper, our objectives are to (1) predict the spectral phonon scattering rate and thermal conductivity without touching the detailed phonon scattering processes or the spectral M’s rule, and (2) examine the accuracy of the spectral M’s rule and provide physical interpretation and quantitative correction.
We take defective bulk Si as an example and calculate , , and in three independent ways. is obtained by performing the phonon normal mode analysis (NMA) Feng and Ruan (2014); Thomas et al. (2010); Ladd et al. (1986); de Koker (2009); McGaughey and Kaviany (2004); Henry and Chen (2008-02-01T00:00:00); Feng et al. (2015) on pristine silicon, in which only phonon-phonon scattering occurs. is calculated from the Tamura’s formalism, and is calculated by NMA on the defective silicon. The spectral M’s rule is examined by comparing to . To examine the accuracy of these scattering rates, we compare the thermal conductivity predicted from or with that from the Green-Kubo method based on MD. The scattering rates and were obtained by performing the following NMA on pristine silicon and on defective silicon respectively,
| (1) | |||||
| (2) |
Here, is the th component of the time dependent displacement of the th basis atom in the th unit cell, is the phonon eigenvector, is the equilibrium position, denotes the Fourier transformation, and is called spectral energy density. is a constant for a given . is a Lorentzian function with peak position and full width at half maximum. By MD simulation the time dependent atomic velocity is obtained and substituted into Eqs. (1) and (2) to obtain the spectral phonon scattering rate . With this method, we can obtain of pristine silicon and of impurity-doped silicon independently. In the evaluation of , the intrinsic lattice anharmonicity and the extrinsic impurity are treated as a combined perturbation to the phonon normal modes. This method does not touch the details of the scattering processes or the spectral M’s rule.
From the second-order perturbation theory Klemens (1958); Ziman (1960), Tamura gave the isotope scattering rate by fermi’s golden rule (FGR) Tamura (1983)
| (3) |
where characterizes the magnitude of mass disorder, with , , and indicating the isotope types, the fraction of isotope in the th basis atom, and the average atom mass at the th basis. Equation (3) is equivalent to for cubic lattice structures, where is the normalized density of states. The Tamura’s formalism was first derived for the calculation of isotope scattering rate but recently has been applied to many other impurities with bonding change Garg et al. (2011); Tian et al. (2012); He et al. (2012); Kundu et al. (2011); Li et al. (2012). In the last part of the paper we study the contribution of the impurity bonding strength to the total scattering rate. In the long wavelength approximation (LWA) Klemens (1958); Kaviany (2008); Tamura (1983), Eq. (3) is reduced to the relation, , where is the volume of a unit cell, is the concentration of the impurities, and are the group and phase velocities of phonon, respectively.
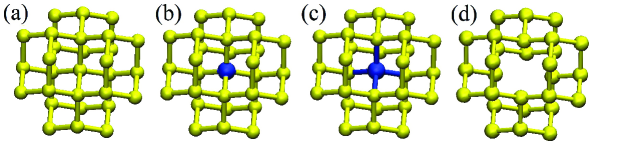
We investigate the pristine c-Si, the mass-doped c-Si (Si-Si), the 73Ge-doped c-Si (73Ge-Si), and the vacancy-doped c-Si (V-Si) bulks Shiga et al. (2014); Wang et al. (2014) at classical 300 K with the sketches of the lattice structures shown in Fig. 1. Here the Si-Si is to substitute some of the original Si atoms with mass while keeping the bonds unchanged. The NMA and the Tamura’s formalism rely on MD simulations and lattice dynamics (LD) calculations, which are conducted in LAMMPS Plimpton (1995) and GULP Gale (1997), respectively. All the scattering rates are calculated based on the Tersoff interatomic potential Tersoff (1989). The domain size and total simulation time are set as conventional cubic cells and to eliminate the size and time effects [19]. Each time step is set as to resolve all the phonon modes. From the simulation results, it is found that one impurity affects at most the motions of its nearest (2.3 Å) and second nearest (3.8 Å) neighbors because of the approximate tight binding force in silicon. In our simulation, the impurities were randomly distributed with the distance between each of the two defects being larger than 11 Å to ensure the defects do not influence each other. Three or more independent simulations are conducted for each case to minimize the statistical error. In the lattice dynamics calculation we employed a grid of to obtain results as accurately as possible, since Eq. (1) requires the evaluation of delta functions.
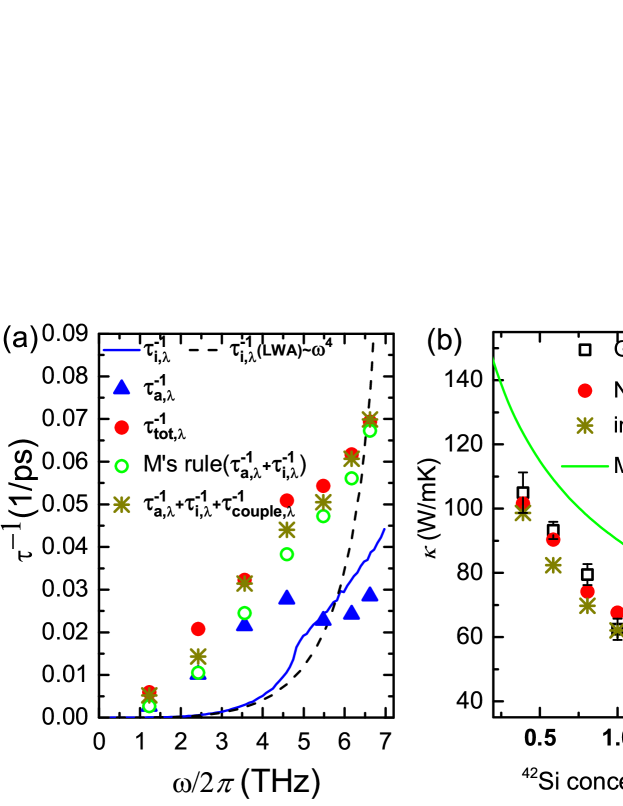
Figure 2 (a) gives the phonon scattering rates of the TA mode in the [100] direction for 0.4% 42Si-Si at classical 300 K. The phonon-phonon scattering rate scales as at low frequencies, but deviates at higher frequencies. Such a trend was also seen in previous studies Henry and Chen (2008-02-01T00:00:00); Esfarjani et al. (2011). The calculated from Eq. (3) is found to be exactly the same with as mentioned above. At low frequency, is about one order of magnitude lower than . As the frequency increases, becomes even higher than due to the increase of the density of states. We also note that the impurity scattering rate obeys the relation given by the LWA [dashed black line] for the phonon frequency below THz. For higher frequency where phonon wavelength is short and comparable with the defect size, the Rayleigh scattering model breaks down giving way to the Mie scattering model and thus the frequency dependence gradually fades with increasing frequency Klemens (1955). Interestingly, we find that the spectral M’s rule, [open green circle], underestimates the phonon total scattering rates [solid red circle] by 10%-50% for different frequencies. To ensure this discrepancy is not due to the different domain sizes used in the NMA and Tamura’s formula, we have performed both the MD simulations and FGR calculations in the domain of 161616 unit cells and the same-size mesh, respectively. We have found that such discrepancy indeed exists, especially in the mid-frequency range. Actually the impurity scattering rates do not vary much when the -mesh size changes from 969696 to 161616 since the latter is already dense enough to obtain a good phonon density of states. In our work, all the calculations are done based on the same Tersoff potential, and the comparison between the results of different methods is self-consistent. Thus, the conclusions still hold although the dispersion has discrepancy with experiments.
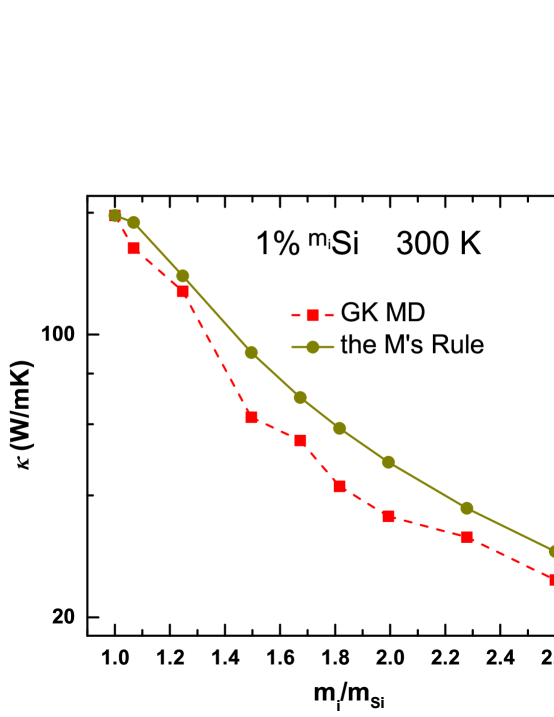
The thermal conductivity as a function of the 42Si concentration at classical 300 K is shown in Fig. 2(b). The NMA and GK are both based on classical equilibrium molecular dynamics and the same interatomic potential. In our calculation results, their agreement is good (within 5%). As seen in Fig. 2(b) for the mass doped bulk silicon, the NMA thermal conductivity values (red circles) match excellently with GK values (black squares). For pristine c-Si, our Green-Kubo and NMA methods give consistent thermal conductivity values. In contrast, the calculated from the spectral M’s rule [green line] has about 20%-40% overestimation. This overestimation has also been observed in the doped silicon with a broad range of mass (28-73) at a concentration of 1%, as seen in Fig. 3.
The physical mechanism for the inaccuracy of the spectral M’s rule is explored from the second-order perturbation theory Carruthers (1962). The phonon scattering operator and rate for a defective material are described as
| (4) | |||||
| (5) | |||||
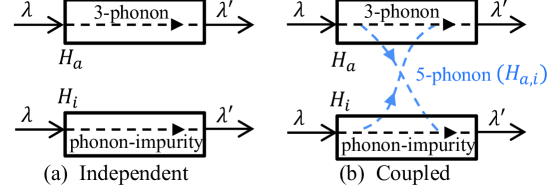
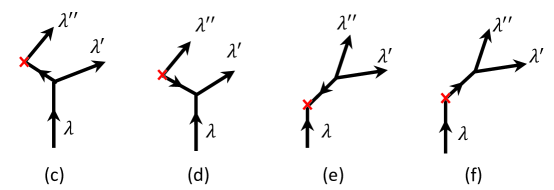
where is the harmonic lattice Hamiltonian, and is a positive infinitesimal Carruthers (1962). The first two terms and are the perturbation Hamiltonians from intrinsic anharmonicity and extrinsic impurity, leading to intrinsic anharmonic phonon-phonon scattering and extrinsic phonon-impurity scattering , respectively. The former includes the intrinsic three-phonon, four-phonon, five-phonon processes, etc., and the latter involves two phonons. The third operator in Eq. (4), which was usually ignored by researchers, represents the coupling between and and may involve five or more phonons. To the lowest order of the coupling, the coupled five-phonon scattering (three phonons in the three-phonon scattering and the two phonons in the impurity scattering) provides additional channels for one mode to scatter to the other mode and thus increases the scattering rate, as shown in Figs. 4(a) and (b). The detailed sketches for the coupled five-phonon process are shown in Figs. 4(c) to (f). Note that this coupled five-phonon process is different from the intrinsic five-phonon process which has already been included in the term . The term “coupling” is used because the transitions occur between the intermediate quantum states of three-phonon process and impurity-phonon process with detailed sketches shown in Refs. Carruthers (1962, 1961). This coupling is calculated by the second-order perturbation theory and is different from the meaning of “interplay” discussed in Refs. Lindsay et al. (2013b); Lindsay and Broido (2012) where the spectral M’s rule was still used not (b).
To roughly estimate the contribution of the coupled five-phonon scattering, we applied the approximate expression derived by Carruthers from fermi’s golden rule Carruthers (1962),
| (6) |
where measures “the ‘lack’ of energy conservation by the intermediate phonons” Carruthers (1962) in the five-phonon process, and is Debye frequency exp . This coupled five-phonon scattering rate, however, has, to our knowledge, never been evaluated. We substitute the obtained from NMA into Eq. (6) to estimate the coupling scattering and check the agreement between and . By including the estimated coupling scattering rate , a good agreement is achieved for both and as seen in Fig. 2. The frequency dependence of in Fig. 2(a) is explained by Eq. (6) as follows. At low frequencies (1-5 THz), increases with frequency due to the increasing , while at higher frequencies (6-7 THz), it decreases with frequency since the increasing brings down the third term in the bracket. Physically, at higher frequencies the large density of states allows phonon states to transit into other states quickly by impurity scattering, and thus the intermediate states required in the coupling scattering are probably difficult to produce. Generally, the maximum occurs at the mid-frequencies where the phonons have relatively high as well as low density of states.
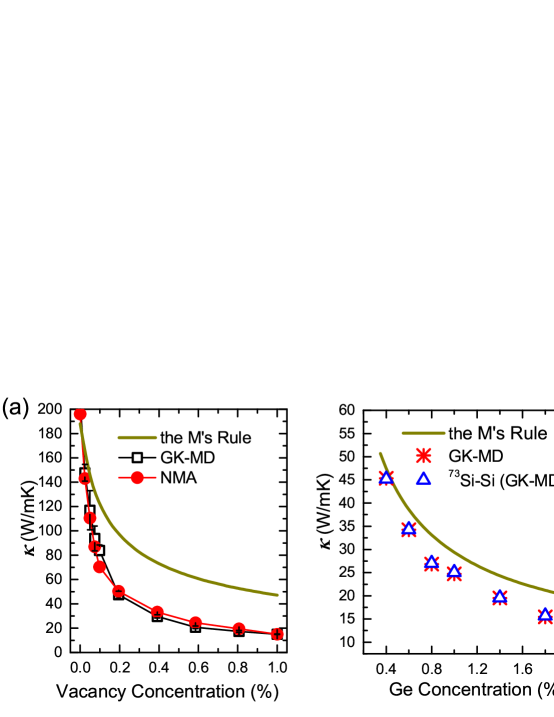
Figure 5 (a) shows of V-Si as a function of vacancy concentration calculated from different methods. We find that even for bond-missing defects our NMA [red circle] presents excellent agreement with GK-MD [black square], indicating that treating the impurities and anharmonicity as one combined perturbation to calculate total scattering rates is reasonable. The spectral M’s rule [yellow line] over-predicts of V-Si by about 100-150% at a vacancy concentration of 0.2-1%. The discrepancy comes from two aspects: (1) the spectral M’s rule neglects the coupling between phonon-phonon and phonon-defect scattering rates as elaborated earlier, and (2) the Tamura’s formalism only captures the scattering by mass disorder while ignoring the bond changes. As for 73Ge-Si shown in Fig. 5 (b), the spectral M’s rule over predicts about 20%-40% of . Most of this discrepancy comes from the coupling since we find that 73Ge-Si and 73Si-Si have almost the same thermal conductivity, indicating that the Ge-Si bond provides negligible scattering compared to the mass disorder introduced by Ge atoms. In addition, the over prediction of by the spectral M’s rule is also seen in the high Ge concentration range Carruthers (1962); Abeles et al. (1962).
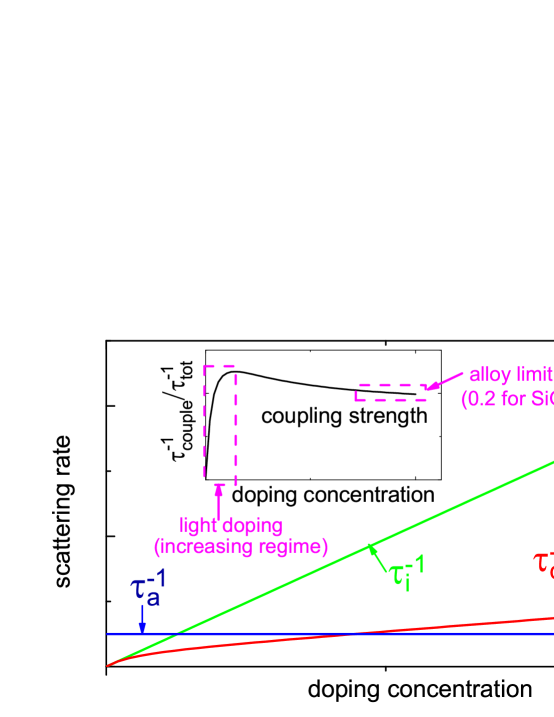
For two materials having the same light-doping level (), the coupling strength, defined by is approximately and is higher for the higher- material which has a lower . On the other hand, if the doping level is high (), the coupling strength is higher for the lower- material which has a higher .
For general materials, the phonon scattering rates as a function of doping concentration are shown in Fig. 6. The coupling scattering rate initially increases rapidly with doping in the light doping regime and then increases linearly and more slowly in the heavy doping regime. As a result, a maximum of the coupling strength occurs when the system transits from the light to heavy doping. For example, for silicon doped with Ge in our work as shown in Fig. 5(b), the coupling strength increases to 0.4 as the doping level increases to 2%. On the other hand, at the concentration of 50% which is in the alloy limit, the coupling strength is about . Here we used the approximation of Carruthers (1962) with in SiGe alloy and the fact that pristine silicon and SiGe alloy have the thermal conductivities of 156 W/mK and 7 W/mK, respectively. Carruthers et al. hypothesized that this coupled five-phonon scattering caused the over estimation of for SiGe alloy in early years Carruthers (1962); Abeles et al. (1962), though a quantitative evaluation was not done in their work. The concept of the coupling effect can be extended to all doped material systems, and the general trends should be similar to Fig. 6. For example, the coupling strength in PbTe/Se alloy is estimated to be about 9%, which may account for the overestimation in Ref. Tian et al. (2012). In Ref. Garg et al. (2011), Garg et al. included the coupling implicitly by calculating the three-phonon scattering rates in a large SiGe alloy supercell using fully-quantum density functional perturbation theory. Although the five-phonon processes were implicitly included in prior calculations of the total phonon scattering rates, we have isolated the scattering rate due to five-phonon processes only.
To conclude, without touching the details of the phonon scattering processes, we have used the NMA approach to predict the thermal properties of defective materials more accurately than the spectral M’s rule. The spectral M’s rule is found to over-predict the phonon relaxation time and thermal conductivity because the spectral M’s rule does not take into account the coupling between anharmonic phonon-phonon scattering and impurity scattering. Our results demonstrate one system which has strong coupling between different scattering mechanisms and estimate the coupling scattering rates with good quantitative accuracy. Such coupling exists in many different systems of solids, and can be explored for lower as well as higher for thermoelectrics.
We would like to thank Ajit Vallabhaneni and Frank Brown for proofreading the manuscript, and Yan Wang for helpful discussions. Simulations were performed at the Purdue Network for Computational Nanotechnology (NCN). The work was supported by the National Science Foundation (Award No. 1150948).
References
- Ziman (1960) J. M. Ziman, Electrons and Phonons (Oxford University Press, London, 1960).
- not (a) To consistent with the GK method based classical MD simulations, in this work the value of is taken as under the classical Boltzmann distribution.
- Turney et al. (2009) J. Turney, E. Landry, A. McGaughey, and C. Amon, Physical Review B 79, 064301 (2009), ISSN 1098-0121, URL http://link.aps.org/doi/10.1103/PhysRevB.79.064301.
- Lindsay et al. (2013a) L. Lindsay, D. A. Broido, and T. L. Reinecke, Phys. Rev. B 87, 165201 (2013a), URL http://link.aps.org/doi/10.1103/PhysRevB.87.165201.
- Lindsay and Broido (2008) L. Lindsay and D. a. Broido, Journal of Physics: Condensed Matter 20, 165209 (2008), ISSN 0953-8984, URL http://stacks.iop.org/0953-8984/20/i=16/a=165209?key=crossref.fae35963b743f83e18ac9194e2b46aea.
- Lindsay et al. (2012) L. Lindsay, D. a. Broido, and T. L. Reinecke, Physical Review Letters 109, 095901 (2012), ISSN 0031-9007, URL http://link.aps.org/doi/10.1103/PhysRevLett.109.095901.
- Garg et al. (2011) J. Garg, N. Bonini, B. Kozinsky, and N. Marzari, Physical Review Letters 106, 045901 (2011), ISSN 0031-9007, URL http://link.aps.org/doi/10.1103/PhysRevLett.106.045901.
- He et al. (2012) Y. He, I. Savić, D. Donadio, and G. Galli, Physical chemistry chemical physics : PCCP 14, 16209 (2012), ISSN 1463-9084, URL http://www.ncbi.nlm.nih.gov/pubmed/23060011.
- Tian et al. (2012) Z. Tian, J. Garg, K. Esfarjani, T. Shiga, J. Shiomi, and G. Chen, Physical Review B 85, 184303 (2012), ISSN 1098-0121, URL http://link.aps.org/doi/10.1103/PhysRevB.85.184303.
- Mingo and Yang (2003) N. Mingo and L. Yang, Physical Review B 68, 245406 (2003), ISSN 0163-1829, URL http://link.aps.org/doi/10.1103/PhysRevB.68.245406.
- Martin et al. (2009) P. Martin, Z. Aksamija, E. Pop, and U. Ravaioli, Physical Review Letters 102, 125503 (2009), ISSN 0031-9007, URL http://link.aps.org/doi/10.1103/PhysRevLett.102.125503.
- Feng and Ruan (2014) T. Feng and X. Ruan, Journal of Nanomaterials 2014, 206370 (2014), ISSN 1687-4110, URL http://www.hindawi.com/journals/jnm/2014/206370/.
- Takeda and Pearsall (1980) Y. Takeda and T. P. Pearsall, Electronics Letters 17, 1980 (1980), ISSN 00135194.
- Turney et al. (2010) J. E. Turney, a. J. H. McGaughey, and C. H. Amon, Journal of Applied Physics 107, 024317 (2010), ISSN 00218979, URL http://link.aip.org/link/JAPIAU/v107/i2/p024317/s1{&}Agg=doi.
- Luisier (2013) M. Luisier, Applied Physics Letters 103, 113103 (2013), ISSN 00036951, URL http://link.aip.org/link/APPLAB/v103/i11/p113103/s1{&}Agg=doi.
- Thomas et al. (2010) J. A. Thomas, J. E. Turney, R. M. Iutzi, C. H. Amon, and A. J. H. McGaughey, Physical Review B 81, 081411 (2010), ISSN 1098-0121, URL http://link.aps.org/doi/10.1103/PhysRevB.81.081411.
- Ladd et al. (1986) A. J. C. Ladd, B. Moran, and W. G. Hoover, Phys. Rev. B 34, 5058 (1986), URL http://link.aps.org/doi/10.1103/PhysRevB.34.5058.
- de Koker (2009) N. de Koker, Physical Review Letters 103, 125902 (2009), ISSN 0031-9007, URL http://link.aps.org/doi/10.1103/PhysRevLett.103.125902.
- McGaughey and Kaviany (2004) A. McGaughey and M. Kaviany, Physical Review B 69, 094303 (2004), ISSN 1098-0121, URL http://link.aps.org/doi/10.1103/PhysRevB.69.094303.
- Henry and Chen (2008-02-01T00:00:00) A. S. Henry and G. Chen, Journal of Computational and Theoretical Nanoscience 5, 141 (2008-02-01T00:00:00), URL http://www.ingentaconnect.com/content/asp/jctn/2008/00000005/00000002/art00002.
- Feng et al. (2015) T. Feng, B. Qiu, and X. Ruan, Journal of Applied Physics 117, 195102 (2015), ISSN 0021-8979, URL http://scitation.aip.org/content/aip/journal/jap/117/19/10.1063/1.4921108.
- Klemens (1958) P. Klemens, Solid State Physics, vol. 7 (Academic Press Inc., New York, USA, 1958).
- Tamura (1983) S.-i. Tamura, Physical Review B 27, 858 (1983), URL http://journals.aps.org/prb/abstract/10.1103/PhysRevB.27.858.
- Kundu et al. (2011) a. Kundu, N. Mingo, D. a. Broido, and D. a. Stewart, Physical Review B 84, 125426 (2011), ISSN 1098-0121, URL http://link.aps.org/doi/10.1103/PhysRevB.84.125426.
- Li et al. (2012) W. Li, L. Lindsay, D. a. Broido, D. a. Stewart, and N. Mingo, Physical Review B 86, 174307 (2012), ISSN 1098-0121, URL http://link.aps.org/doi/10.1103/PhysRevB.86.174307.
- Kaviany (2008) M. Kaviany, Heat Transfer Physics (Cambridge University Press, New York, 2008).
- Shiga et al. (2014) T. Shiga, T. Hori, and J. Shiomi, Japanese Journal of Applied Physics 53, 021802 (2014), ISSN 0021-4922, URL http://stacks.iop.org/1347-4065/53/021802.
- Wang et al. (2014) T. Wang, G. K. H. Madsen, and A. Hartmaier, Modelling and Simulation in Materials Science and Engineering 22, 035011 (2014), ISSN 0965-0393, URL http://stacks.iop.org/0965-0393/22/i=3/a=035011?key=crossref.9b6888a772100db211c7e20bf0534c96$\$nhttp://iopscience.iop.org/0965-0393/22/3/035011.
- Plimpton (1995) S. Plimpton, Journal of Computational Physics 117, 1 (1995), ISSN 0021-9991, URL http://www.sciencedirect.com/science/article/pii/S002199918571039X.
- Gale (1997) J. D. Gale, J. Chem. Soc., Faraday Trans. 93, 629 (1997), URL http://dx.doi.org/10.1039/A606455H.
- Tersoff (1989) J. Tersoff, Phys. Rev. B 39, 5566 (1989), URL http://link.aps.org/doi/10.1103/PhysRevB.39.5566.
- Esfarjani et al. (2011) K. Esfarjani, G. Chen, and H. T. Stokes, Physical Review B 84, 085204 (2011), ISSN 1098-0121, URL http://link.aps.org/doi/10.1103/PhysRevB.84.085204.
- Klemens (1955) P. G. Klemens, Proceedings of the Physical Society. Section A 68, 1113 (1955), URL http://iopscience.iop.org/0370-1298/68/12/303.
- Carruthers (1962) P. Carruthers, Physical Review 125, 123 (1962), URL http://prola.aps.org/abstract/PR/v125/i1/p123_1.
- Carruthers (1961) P. Carruthers, Reviews of Modern Physics 33, 92 (1961), URL http://rmp.aps.org/abstract/RMP/v33/i1/p92{_}1.
- Lindsay et al. (2013b) L. Lindsay, D. A. Broido, and T. L. Reinecke, Physical Review B 144306, 1 (2013b).
- Lindsay and Broido (2012) L. Lindsay and D. a. Broido, Physical Review B 85, 035436 (2012), ISSN 1098-0121, URL http://link.aps.org/doi/10.1103/PhysRevB.85.035436.
- not (b) The interplay between isotope scattering and 3-phonon scattering was studied for heavily doped beryllium-VI compounds Lindsay et al. (2013b) and boron nitride Lindsay and Broido (2012). There it was illustrated that the highly doped isotopes changed the phonon dispersion relation and further influenced the 3-phonon scattering rate. In their approach, although is modified due to the doping of isotopes, and were evaluated separately and no coupling between them was included. Thus, the spectral M’s rule was still used.
- (39) Detailed explanation of these parameters are found in Ref. Carruthers (1962), according to which, , , and are roughly taken as 2, 213 rad/ps, and , respectively. To roughly estimate the contribution of 5-phonon scattering, the choices of these parameters allow slight changes which will not influence the mangitudes or properties of final results.
- Abeles et al. (1962) B. Abeles, D. Beers, G. Cody, and J. Dismukes, Physical review 125, 1954 (1962), URL http://prola.aps.org/abstract/PR/v125/i1/p44{_}1.