Search for Magnetic Monopoles in Magnetic Reconnection Regions
Abstract
In order to satisfy the symmetry between electric and magnetic fields in the source free Maxwell’s equations, electric charges might have magnetic counterparts: magnetic monopoles. Many methods and techniques are proposed to search for the monopoles, but no confirmed results have been obtained. Based on solar observations, we know that magnetic reconnections take place during eruptive solar activities. The magnetic fields can be broken at first and then rejoined, implying that the fields are source-relevant at the broken moment. It is speculated that the magnetic lines undergo outward deflection movement during the broken moment, as the line tying effect disappears and the magnetic tension triggers the movement. The signal of the deflection is detected for the first time by EUV and H observations in reconnection processes. We propose that the monopoles appear in magnetic reconnection regions at first, and then the annihilation of opposite polarity monopoles releases energy and perhaps also produces particles. To detect the predict monopoles, laboratory plasma experiments can be used to provide some fundamental information.
1 Introduction
Following the predicted existence of monopoles from spontaneous symmetry breaking mechanisms (Dirac 1931), searches have been routinely made for monopoles produced at accelerators, in cosmic rays, and bound in matter (Nakamura & Particle Data Group 2010). The main strategy to search for monopoles is that monopoles will interact with their pass through matter (Fairbairn et al. 2007). It is suggested that monopoles with Dirac charge would typically lose energy at a rate which is thousands times larger than that expected from particles with the elementary electric charge. Consequently, scintillators, gas chambers and nuclear track detectors have been used in cosmic ray and collider experiments (Price et al. 1975; Cabrera 1982). Many efforts have been made to seek monopoles in moon rock, meteorites and sea water (Kovalik & Kirschvink 1986; Jeon & Longo 1995). Furthermore, a range of experiments about the induced nucleon decay are also employed to detect the monopoles (Kajita et al. 1985; Bartelt et al. 1987; Becker-Szendy et al. 1994; Balkanov et al. 1998; Ambrosio et al. 2002). Collider experiments about lower energy (Carrigan et al. 1973; Aubert et al. 1983) and high energy (Kalbfleisch et al. 2004; Abulencia et al. 2006) in hadron-hadron collisions have been employed to search for the suggested monopoles.
In solar and stellar coronae, magnetic reconnection is an essential physical process (Cassak et al. 2008; Zhang et al. 2013). Vast theoretical studies of magnetic reconnection have been done to explain flares (Sturrock 1966; Hirayama 1974; Kopp & Pneuman 1976) and filament eruptions (Shibata 1999; Antiochos et al. 1999; Lin & Forbes 2000). Magnetic reconnection occurs at an X-point where anti-parallel magnetic field lines converge and reconnect, then the magnetic energy is released and converted to other forms of energy, e.g. radiation, energetic particle acceleration, and kinetic energy of plasma (Priest & Forbes 2000; Priest 2014). Many signatures of magnetic reconnection have been observed in different kinds of solar eruptions, e.g., flares and coronal mass ejections, and as well as solar winds (Tsuneta et al. 1992; Masuda et al. 1994; Shibata et al. 1995; Yokoyama et al. 2001; Innes et al. 2003; Sui & Holman 2003; Asai et al. 2004; Lin et al. 2005; Gosling et al. 2007; Li & Zhang 2009; Zhang et al. 2013). In the magnetosphere, magnetic reconnection are also revealed by in situ measurements (Phan et al. 2007; Mozer et al. 2002; Dunlop et al. 2011). Moreover, many experiments which are dedicated to magnetic reconnection have been carried out in laboratories under controlled conditions (Bratenahl & Yeates 1970; Yamada et al. 1997).
In this paper, we report new properties of magnetic reconnections and propose that the magnetic monopoles can be searched for in magnetic reconnection regions. We describe the observational data in Section 2. In Section 3, we present the results. The conclusions and a brief discussion are displayed in Section 4.
2 Observations
The New Vacuum Solar Telescope (NVST; Liu et al. 2014) observe the Sun with high temporal and spatial resolutions. We mainly use the H line from the NVST to study the dynamic evolution of small-scale magnetic reconnection. Moreover, the Atmospheric Imaging Assembly (AIA; Lemen et al. 2012) multi-wavelength observations and the Helioseismic and Magnetic Imager (HMI; Scherrer et al. 2012; Schou et al. 2012) line-of-sight magnetograms from the Solar Dynamics Observatory (SDO; Pesnell et al. 2012) are also used. SDO/AIA observes the full disk of the Sun in 10 wavelengths with a pixel size of 0.6 and a cadence of 12 s. These data reveal the solar atmospheric temperatures from 5000 K to 20 MK. The SDO/HMI records the line-of-sight (LOS) magnetic field with a cadence of 45 s and a spatial sampling of 0.5 pixel-1.
On 27 January 2012, two sets of EUV loops observed by AIA appeared above the western solar limb as seen from the Earth (Sun et al. 2015). AIA 171 Å and 94 Å images from 00:00 to 07:00 UT are adopted to research the process of magnetic reconnection. On 2014 February 3, the NVST observed the AR 11967 with a field of view (FOV) of 151′′ 151′′, and the H 6562.8 Å images are adopted in this study from 05:49:52 UT to 09:10:01 UT, with a cadence of 12 s and a spatial sampling of 0.′′163 per pixel. The calibration, correction and speckle masking (Weigelt 1977; Lohmann et al. 1983) reconstruction of these H data, as well as the co-alignment between these H data and SDO images are described by Yang et al. (2015).
3 Results
The concept of magnetic reconnection was proposed long time ago, and many observations and theoretic models have been displayed and put forward. However, the most important question (aspect) that whether magnetic field breaks or not during reconnection has always been omitted. The advance of the solar observations help us to check the details of magnetic reconnection. This work tracks the following idea. If magnetic field breaks during reconnection, the broken field will undergo a special outward movement, due to the disappearance of the line tying effect and magnetic tension causes the movement of the broken field. Examining this movement will provide new clues about the essentials of reconnection, such as the magnetic fields are source-relevant, and monopoles or equivalent monopoles appear at the broken points.
3.1 Observations of magnetic reconnection in solar atmosphere
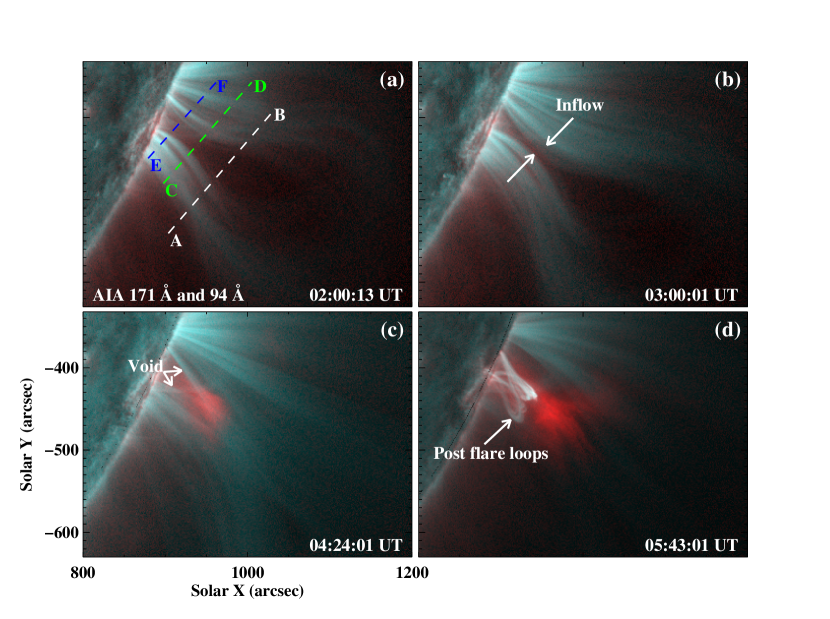
Recently, both the ground-based and space-borne observations have provided a mass of magnetic reconnection events in solar atmosphere. Two events are chosen to display the properties of magnetic reconnection. The first event occurred on 27 January 2012. From 00:00 to 03:00 UT, two sets of cool loops (171 Å passband, corresponding to a temperature of 0.6 MK) which were above the western solar limb (Fig. 1a) moved towards each other and formed an X-shaped structure near 03:00 UT (Fig. 1b). Following the disappearance of the cool loops, a hot region (7 MK; detected in the channel of AIA 94 Å) immediately appeared near the X-shaped structure, implying the initial heating of a solar flare (red in Fig. 1c). About one hour later, post flare loops were detected (Fig. 1d).
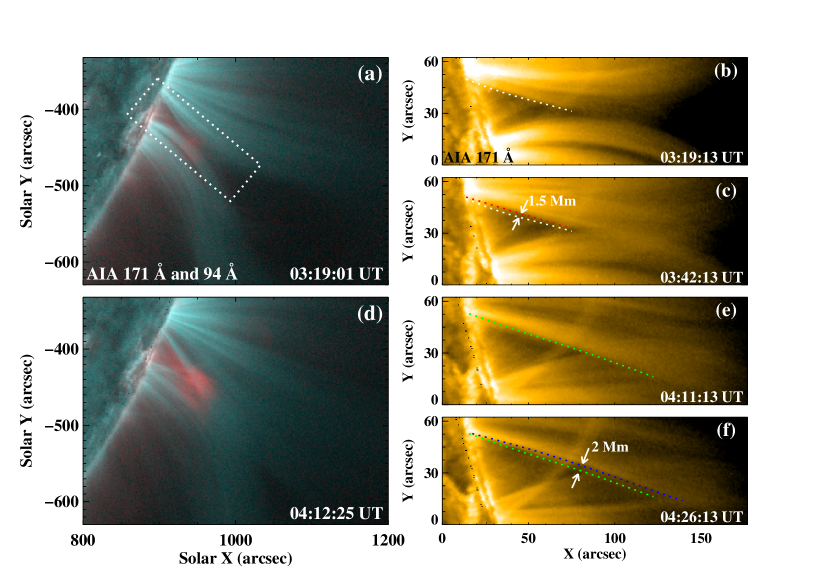
We speculate that the broken fields will undergo a special movement, so we focus on the evolution of EUV loops while the two sets of loops approach. Indeed, the loops at the both sides of the “Void” space (denoted by arrows in Fig. 1c) deflect outward, and this deflection has never been reported before. At the beginning of the reconnection the deflection (Fig. 2b and 2c) speed is small, i.e., 1.5 Mm in 13 min, or 1.1 km s-1. At the later phase of the reconnection, the deflection (Fig. 2e and 2f) speed is 2.2 km s-1, twice as large as that at the beginning. An animation (movie1.mpeg) to display this deflection is available in the online journal.
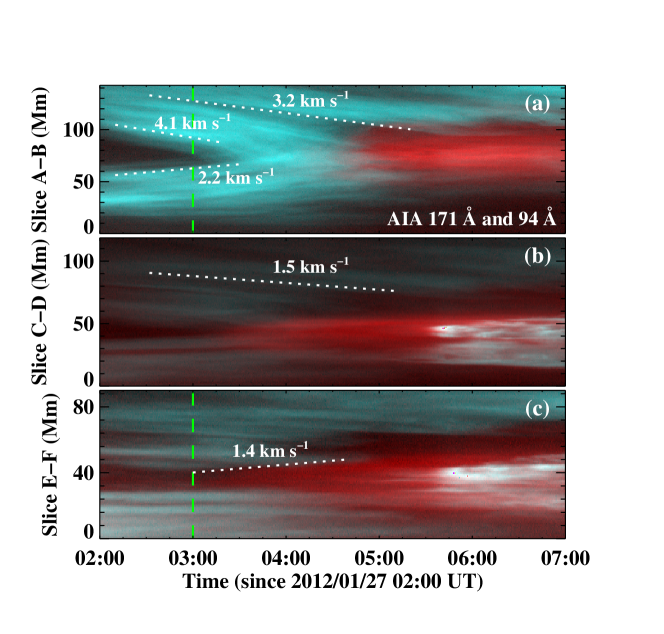
The multi-wavelength observations from the AIA with the high spatial and temporal resolution successfully detect evidences for reconnection including plasma inflows, heating close to the reconnection site, and outward deflection relative to the broken fields. To quantitatively analyze the inflows and deflection, we select three slices in the 171 and 94 Å composite images (“AB”, “CD” and “EF” in Fig. 1a). The stack plots (Fig. 3) clearly show that the bilateral cool loops (cyan) keep moving towards the reconnection region. Once the visible innermost loops come into contact at 03:00 UT (blue dashed lines in Fig. 3a and 3c), hot plasma (red, Fig. 3b and 3c) appears at the reconnection site. The speeds of the inflows vary from 1.5 to 4.1 km s-1 (Fig. 3a and 3b). In addition, the average outward deflection speed of the loops at the upper side of the “Void” space is about 1.4 km s-1.
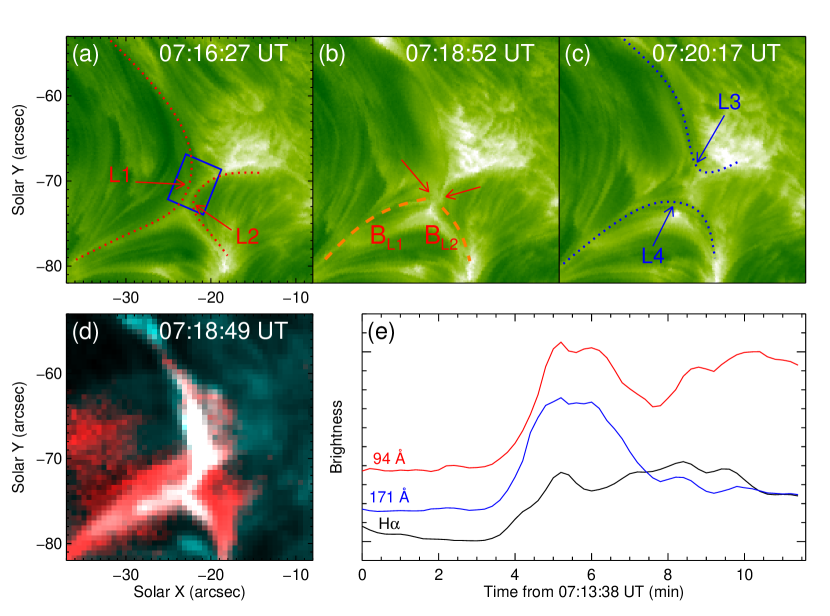
The second reconnection event is displayed in Fig. 4. Sequence of H images show the magnetic reconnection between two sets of small-scale loops “L1” and “L2”, as shown in panel (a). Prior to the initiation of rapid reconnection, the two sets of loops “L1” and “L2” were moving towards each other and then interacted. At 07:18:52 UT, both loops “L1” and “L2” were apparently broken (as denoted in panel (b)). Meanwhile, two broken loops (“BL1” and “BL2” in panel (b)) which were respectively related to “L1” and “L2” appeared, but the curvatures of “BL1” and “BL2” were more different from that of “L1” and “L2”. Then “BL1” and “BL2” connected to form a loop “L4”, and loops “L1” and “L2” disappeared (panel (c)). To better exhibit this reconnection process, an animation (movie2.mpeg) is available in the online journal. At the reconnection region and its proximity, the brightenings in the H images (panels (b) and (c)) and the 171 and 94 Å composite images (panel (d)) can be found. As displayed in panel (e), all the three light curves in the reconnection region (blue window in panel (a)) reach the peak simultaneously, i.e., 07:18:50 UT. To better exhibit this reconnection process, an animation (movie2.mpeg) is available in the online journal.
3.2 Magnetic monopoles appearing in magnetic reconnection regions
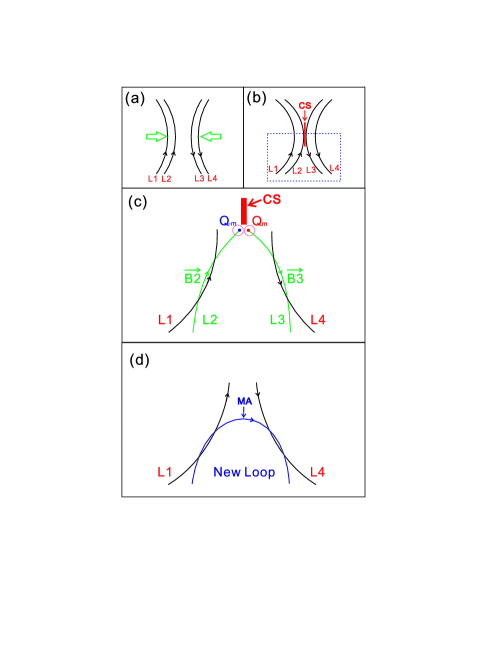
Traditional reconnection models presented that opposite magnetic fields form a current sheet while the fields approach each other. Magnetic energy converts into heat and kinetic energy by Ohmic dissipation in the current sheet which locates in a tiny diffusion region. But the joint between the fields and the current sheet is always omitted, and nobody knows the physical properties of the joint. Although Dungey (1953) was the first to suggest that “lines of force can be broken and rejoined”, in the past decades and at present time, almost no researcher have considered that magnetic field lines must be broken firstly, if the lines are involved in reconnection. We suggest that while the field lines break, opposite polarity monopoles at the two broken points appear. Figure 5 displays a series of schematic drawings which illustrate the magnetic reconnection process. The green arrows in panel (a) denote the convergence of two sets of loops (“L1” and “L2”, “L3” and “L4”), and the vertical red structure (panels (b) and (c)) represents the current sheet (CS). At the joint (denoted by a blue point in panel (c)) between CS and L2, loop “L2” breaks. The corresponding magnetic field breaks also and its direction points to the joint. So is source-relevant at this moment and negative monopoles appears at the joint. Similarly, “L3” and its corresponding magnetic field break at another joint (red point in panel (c)). Positive monopoles appear at this joint, as points outward from the joint. Meanwhile, the curvatures of “L2” and “L3” in panel (b) change to that in panel (c). The main reason is that the line tying effect does not work during the broken process, and magnetic tension triggers the change of the curvatures. The Gauss’s law for magnetism around the two red circles in panel (c) can be written respectively as
(1)
(2)
Where is a coefficient. We suggest that the monopoles are instable, they should be annihilated in a short time. It is possible that “L2” and “L3” (panel (c)) connects to form a new loop (panel (d)). The annihilation of opposite polarity monopoles releases energy () and perhaps produces particle (). This process can be expressed as
(3)
4 Conclusions and Discussion
Based on both the ground-based and space-borne observations, we report two magnetic reconnection events in solar atmosphere. Assuming that magnetic fields can be broken at first and then rejoined during reconnection process, we suggest that the magnetic lines undergo outward deflection movement during the broken moment, as the line tying effect does not work and the magnetic tension triggers the movement. The signal of this movement is detected for the first time by EUV and H observations in the two reconnection events. To satisfy the Gauss’s law for magnetism, we propose that the monopoles appear in magnetic reconnection regions. The annihilation of opposite polarity monopoles releases energy and perhaps also produces particles, then new loop forms. It is speculated that the monopoles can be searched for in magnetic reconnection region, if the monopoles exist indeed in nature.
The common features of most reconnection theories include the changes of magnetic topologies and the release of magnetic energy (Parker 1957; Sweet 1958; Petschek 1964; see the review by Yamada et al. 2010). The topology changes are mainly the break of inflowing anti-parallel loops and the formation of new loops. When the loops reconnect in the diffusion region, magnetic energy is released, thus heating the plasma. In addition, the reconnected field lines near the X-point are sharply bent and the magnetic tension force also impacts the plasma to increase the kinetic energy. Therefore, the plasma is brightened and expelled. However, it is very few to take into account the break of magnetic field and the succedent matter of the break. In this work, we forecast at first the deflection movement, and then we find the signal of the movement in the reconnection events.
Since the introduction of magnetic monopoles by Dirac (1931), they are compulsory in many formulations of Grand Unified Theories (GUT, Polyakov 1974; ’t Hooft 1974). Although GUT-scale monopoles are commonly believed to be extremely heavy (1017 GeV), there are other mechanisms resulting in production of much lighter monopoles after inflation. Kephart and Shafi (2001) proposed that monopoles with a magnetic charge of a few Dirac units and masses in the range 1071013 GeV could be occurred in symmetry-breaking events. Furthermore, there is a speculation that these lighter monopoles are possible ultra-high energy cosmic rays, so monopoles can be searched for in cosmic radiation. Based on both measurements and estimates of cosmic magnetic fields, it is suggested that they could accelerate monopoles lighter than 1014 eV to relativistic velocities (Beck et al. 1996; Ryu et al. 1998).
It is a fact that no traditional monopoles have been verifiably detected (Yao et al. 2006). Although there are some reports of magnetic monopole detections (Price et al. 1975; Cabrera 1982; Caplin et al. 1986), these reports have often been challenged by the original authors themselves (Price et al. 1978; Huber et al. 1990). In this paper, we propose a new idea: search for magnetic monopoles in magnetic reconnection regions. Both remote observations and local detections can be employed to search for monopoles in reconnection regions which are in solar atmosphere and in laboratories, respectively.
References
- ’t Hooft (1974) ’t Hooft G., 1974, Nuclear Physics B, 79, 276
- Abulencia et al. (2006) Abulencia A. et al., 2006, Physical Review Letters, 96, 201801
- Ambrosio et al. (2002) Ambrosio M. et al., 2002, European Physical Journal C, 26, 163
- Antiochos et al. (1999) Antiochos S. K., DeVore C. R., Klimchuk J. A., 1999, ApJ, 510, 485
- Asai et al. (2004) Asai A., Yokoyama T., Shimojo M., Shibata K., 2004, ApJ, 605, L77
- Aubert et al. (1983) Aubert B., Musset P., Price M., Vialle J. P., 1983, Physics Letters B, 120, 465
- Balkanov (1998) Balkanov V., 1998, Progress in Particle and Nuclear Physics, 40, 391
- Bartelt et al. (1987) Bartelt J. et al., 1987, Phys. Rev. D, 36, 1990
- Beck et al. (1996) Beck R., Brandenburg A., Moss D., Shukurov A., Sokoloff D., 1996, ARA&A, 34, 155
- Becker-Szendy et al. (1994) Becker-Szendy R. et al., 1994, Phys. Rev. D, 49, 2169
- Bratenahl & Yeates (1970) Bratenahl A., Yeates C. M., 1970, Physics of Fluids, 13, 2696
- Cabrera (1982) Cabrera B., 1982, Physical Review Letters, 48, 1378
- Caplin et al. (1986) Caplin A. D., Hardiman M., Koratzinos M., Schouten J. C., 1986, Nature, 321, 402
- Carrigan et al. (1973) Carrigan R. A., Nezrick F. A., Strauss B. P., 1973, Phys. Rev. D, 8, 3717
- Cassak et al. (2008) Cassak P. A., Mullan D. J., Shay M. A., 2008, ApJ, 676, L69
- Dirac (1931) Dirac P. A. M., 1931, Proceedings of the Royal Society of London Series A, 133, 60
- Dungey (1953) Dungey J. W., 1953, Philosophical Magazine, 44, 725
- Dunlop et al. (2011) Dunlop M. W. et al., 2011, Physical Review Letters, 107, 025004
- Fairbairn et al. (2007) Fairbairn M. et al., 2007, Phys. Rep., 438, 1
- Gosling et al. (2007) Gosling J. T. et al., 2007, Geophys. Res. Lett., 34, L06102
- Hirayama (1974) Hirayama T., 1974, Sol. Phys., 34, 323
- Huber et al. (1990) Huber M. E., Cabrera B., Taber M. A., Gardner R. D., 1990, Physical Review Letters, 64, 835
- Innes et al. (2003) Innes D. E., McKenzie D. E., Wang T., 2003, Sol. Phys., 217, 247
- Jeon & Longo (1995) Jeon H., Longo M. J., 1995, Physical Review Letters, 75, 1443
- Kajita et al. (1985) Kajita T., Arisaka K., Koshiba M., Nakahata M., Oyama Y., 1985, Journal of the Physical Society of Japan, 54, 4065
- Kalbfleisch et al. (2004) Kalbfleisch G. R., Luo W., Milton K. A., Smith E. H., Strauss M. G., 2004, Phys. Rev. D, 69, 052002
- Kephart & Shafi (2001) Kephart T. W., Shafi Q., 2001, Physics Letters B, 520, 313
- Kopp & Pneuman (1976) Kopp R. A., Pneuman G. W., 1976, Sol. Phys., 50, 85
- Kovalik & Kirschvink (1986) Kovalik J. M., Kirschvink J. L., 1986, Phys. Rev. A, 33, 1183
- Lemen et al. (2012) Lemen J. R. et al., 2012, Sol. Phys., 275, 17
- Li & Zhang (2009) Li L., Zhang J., 2009, ApJ, 703, 877
- Lin & Forbes (2000) Lin J., Forbes T. G., 2000, J. Geophys. Res., 105, 2375
- Lin et al. (2005) Lin J. et al., 2005, ApJ, 622, 1251
- Liu et al. (2014) Liu Z. et al., 2014, Research in Astronomy and Astrophysics, 14, 705
- Lohmann et al. (1983) Lohmann A. W., Weigelt G., Wirnitzer B., 1983, Appl. Opt., 22, 4028
- Masuda et al. (1994) Masuda S., Kosugi T., Hara H., Tsuneta S., Ogawara Y., 1994, Nature, 371, 495
- Mozer et al. (2002) Mozer F. S., Bale S. D., Phan T. D., 2002, Physical Review Letters, 89, 015002
- Nakamura & Particle Data Group (2010) Nakamura K., Particle Data Group, 2010, Journal of Physics G Nuclear Physics, 37, 075021
- Parker (1957) Parker E. N., 1957, J. Geophys. Res., 62, 509
- Pesnell et al. (2012) Pesnell W. D., Thompson B. J., Chamberlin P. C., 2012, Sol. Phys., 275, 3
- Petschek (1964) Petschek H. E., 1964, NASA Special Publication, 50, 425
- Phan et al. (2007) Phan T. D. et al., 2007, Geophys. Res. Lett., 34, L14104
- Polyakov (1974) Polyakov A. M., 1974, Soviet Journal of Experimental and Theoretical Physics Letters, 20, 194
- Price et al. (1975) Price P. B., Shirk E. K., Osborne W. Z., Pinsky L. S., 1975, Physical Review Letters, 35, 487
- Price et al. (1978) Price P. B., Shirk E. K., Osborne W. Z., Pinsky L. S., 1978, Phys. Rev. D, 18, 1382
- Priest (2014) Priest E., 2014, Magnetohydrodynamics of the Sun, by Eric Priest, Cambridge, UK: Cambridge University Press, 2014,
- Priest & Forbes (2000) Priest E., Forbes T., 2000, Magnetic Reconnection, by Eric Priest and Terry Forbes, pp. 612. ISBN 0521481791. Cambridge, UK: Cambridge University Press, June 2000.,
- Ryu et al. (1998) Ryu D., Kang H., Biermann P. L., 1998, A&A, 335, 19
- Scherrer et al. (2012) Scherrer P. H. et al., 2012, Sol. Phys., 275, 207
- Schou et al. (2012) Schou J. et al., 2012, Sol. Phys., 275, 229
- Shibata (1999) Shibata K., 1999, Ap&SS, 264, 129
- Shibata et al. (1995) Shibata K. et al., 1995, ApJ, 451, L83
- Sturrock (1966) Sturrock P. A., 1966, Nature, 211, 695
- Sui & Holman (2003) Sui L., Holman G. D., 2003, ApJ, 596, L251
- Sun et al. (2015) Sun J. Q. et al., 2015, Nature Communications, 6, 7598
- Sweet (1958) Sweet P. A., 1958, Electromagnetic Phenomena in Cosmical Physics, 6, 123
- Tsuneta et al. (1992) Tsuneta S. et al., 1992, PASJ, 44, L63
- Weigelt (1977) Weigelt G. P., 1977, Optics Communications, 21, 55
- Yamada et al. (1997) Yamada M. et al., 1997, Physics of Plasmas, 4, 1936
- Yamada et al. (2010) Yamada M., Kulsrud R., Ji H., 2010, Reviews of Modern Physics, 82, 603
- Yang et al. (2015) Yang S., Zhang J., Xiang Y., 2015, ApJ, 798, L11
- Yao et al. (2006) Yao W.-M. et al., 2006, Journal of Physics G Nuclear Physics, 33, 1
- Yokoyama et al. (2001) Yokoyama T., Akita K., Morimoto T., Inoue K., Newmark J., 2001, ApJ, 546, L69
- Zhang et al. (2013) Zhang J. et al., 2013, ApJ, 776, 57