Herschel Observations of Major Merger Pairs at z=0: Dust Mass and Star Formation
Abstract
We present Herschel PACS SPIRE far-infrared (FIR) and sub-mm imaging observations for a large K-band selected sample of 88 close major-merger pairs of galaxies (H-KPAIRs) in 6 photometric bands (70, 100, 160, 250, 350, and 500 ). Among 132 spiral galaxies in the 44 spiral-spiral (SS) pairs and 44 spiral-elliptical (SE) pairs, 113 are detected in at least one Herschel band. Star formation rate (SFR) and dust mass () are derived from the IR SED fitting. Mass of total gas () is estimated by assuming a constant dust-to-gas mass ratio of 0.01. Star forming spiral galaxies (SFGs) in SS pairs show significant enhancements in both specific star formation rate (sSFR) and star formation efficiency (SFE), while having nearly the same gas mass, compared to control galaxies. On the other hand, for SFGs in SE pairs, there is no significant sSFR enhancement and the mean SFE enhancement is significantly lower than that of SFGs in SS pairs. This suggests an important role for the disc-disc collision in the interaction induced star formation. The of SFGs in SE pairs is marginally lower than that of their counterparts in both SS pairs and the control sample. Paired galaxies with and without interaction signs do not differ significantly in their mean sSFR and SFE. As found in previous works, this much larger sample confirms the primary and secondary spirals in S+S pairs follow a Holmberg effect correlation on sSFR.
Subject headings:
galaxies: interactions — galaxies: evolution — galaxies: starburst — galaxies: general1. Introduction
Galaxy interactions and mergers are important external mechanisms for triggering galactic evolution (Kormendy & Kennicutt, 2004). Both observations and numerical simulations have shown that dynamical instabilities induced by galaxy interactions can cause cold gas inflow and massive star formation in the central region of disk galaxies (see e.g., Bahcall et al. 1995; Hopkins et al. 2006; Dasyra et al. 2006). Merger induced star formation was first predicted by Toomre & Toomre (1972), and confirmed by Larson & Tinsley (1978) in a study of optical colors of Arp galaxies. Many subsequent studies of the emission and Far-Infrared (FIR) emission in Arp galaxies and in paired galaxies provided further support to this theory (see Kennicutt 1996 for a review). On the other hand, Haynes & Herter (1988) found little or no enhanced FIR emission in a sample of optically selected pairs compared to a control sample of single galaxies. In a more influential paper, Bergvall et al. (2003) reported a multi-wavelength study in which they found no significant star formation rate (SFR) enhancement for a sample of morphologically selected merger candidates. Apparently, only some merging galaxies have significantly enhanced SFR, with ultra-luminous infrared galaxies (ULIRGs) as the extreme examples, and the others do not. Therefore, whether the mean SFR of a merger sample shows significant enhancement depends very much on how it is selected. Kennicutt et al. (1987) and Bushouse et al. (1988) found that merger candidates which show strong signs of tidal interactions have significantly stronger SFR enhancement than optically selected paired galaxies, the latter being only marginally enhanced (a factor of ) compared to single galaxies. Telesco et al. (1988) found a strong tendency for pairs with the highest FIR color temperatures to have the smallest separation. Xu & Sulentic (1991) showed that the enhancement of the FIR emission of close spiral-spiral (SS) pairs with separation less than the size of the primary and with signs of interaction is significantly stronger than that of wider pairs and pairs without interaction signs. Sulentic (1989) found that elliptical-elliptical (E+E) pairs are equally quiet in the FIR emission as single ellipticals. Very few E’s in SE pairs are FIR bright, possibly cross-fueled by their S companions (Domingue et al., 2003).
More recently, large digitized surveys (e.g. SDSS, 2MASS, 2df, etc) enabled large and homogeneously selected pair samples. A clear anti-correlation between the specific SFR (sSFR=SFR/) and the pair separation has been well established (Barton et al., 2000; Lambas et al., 2003; Alonso et al., 2004; Nikolic et al., 2004; Li et al., 2008; Ellison et al., 2008; Scudder et al., 2012; Patton et al., 2013). In particular, close pairs with projected separation have relatviely strong sSFR enhancement of a factor of (Ellison et al., 2008), while the sSFR enhancement of wider pairs is significantly weaker (Scudder et al., 2012; Patton et al., 2013). On the other hand, not all star forming galaxies (SFGs) in close pairs have enhanced sSFR. Xu et al. (2010) studied the sSFR enhancement in a sample of K-band selected close major-merger pairs (primary-to-secondary mass ratio ) using Spitzer FIR observations, and found that (1) on average, SFGs in SE pairs do not show any sSFR enhancement compared to their counterparts in a mass-matched control sample; (2) the sSFR enhancement in SS major-merger pairs is mass dependent in the sense that significant sSFR enhancement is confined to massive SFGs while no enhancement is found in low mass SFGs with nearly equal (low) mass companions. Using data obtained in Herschel (PEP/ HerMES) and Spitzer surveys of the COSMOS field (Scoville et al., 2007), Xu et al. (2012a) studied the cosmic evolution of the sSFR enhancement in close major-merger pairs since z=1, and found that the sSFR enhancement in massive SS pairs decreases with increasing redshift, while there is no significant sSFR enhancement in massive SE pairs at any redshift. Other authors also found evidence for the lack of SFR enhancement in SE pairs (Hwang et al., 2011; MOON & YOON, 2015) or low SFR activity in spiral galaxies with early type close neighbors (Park & Choi, 2005; Park et al., 2008; Park & Choi, 2009). The literature results on the sSFR enhancement in close minor-merger pairs are controversial. Woods & Geller (2007) found that in close minor mergers, only secondary companions are sSFR enhanced while there is no significant enhancement in primary companions. This is opposite to the results of Lambas et al. (2003) that show stronger sSFR enhancement in the primaries. More recently, Scudder et al. (2012) found that both the primaries and the secondaries have significantly enhanced sSFRs in close minor-merger pairs. Lanz et al. (2013) studied SEDs for 31 interacting galaxies in 14 major minor merger systems, and found increases in SFR but not sSFR as the interaction sequences progress from non-interacting to strongly interacting.
In this paper, we present new FIR imaging observations in the 6 photometry bands (70, 100, 160, 250, 350, and 500 ) of Herschel PACS (Poglitsch et al., 2010) and SPIRE (Griffin et al., 2010), for a large and complete sample of close major-merger pairs of SFGs (including both SS and SE pairs). The focus of this new study is on the dependence of the SFR enhancement on the dust mass, which is a good proxy of gas mass. Star formation activity in galaxies is fueled by cold gas which dominates the gas mass, and all SFGs are gas rich. Does the SFR enhancement depend on the gas content of a paired SFG? Both in simulations (Hopkins et al., 2009; Perret et al., 2014; Scudder et al., 2015) and in observations (Xu et al., 2012a) there have been indications that the SFR enhancement may decrease with increasing gas fraction. According to Hopkins et al. (2009) (see also Mihos & Hernquist (1996)), this is because the gravitational torque imposed by the stellar disk to the gas disk is less effective when gas fraction is high, therefore less disk gas can sink to the nuclear region to fuel the merger-induced starburst by losing angular momentum to stars. Maps of the dust emission in the six Herschel bands enabled us to estimate accurately the dust mass (and its distribution) for individual SFGs. All galaxies in our Herschel sample, a subset of the KPAIR sample of K-band selected major-merger pairs (Domingue et al., 2009; Xu et al., 2012b), have and normal metallicity. Therefore their gas mass is likely to be related to dust mass with a rather constant gas-to-dust ratio of (Draine & Li, 2007), and the sSFR vs. relation for these paired SFGs can be explored using the Herschel observations. It is worth noting that it is difficult to measure directly the gas mass in individual galaxies in close major-merger pairs. The angular resolutions of single dish HI 21 cm line observations are too coarse () to resolve pairs into individual galaxies, while the interferometry observations using the VLA are very expensive in terms of the integration time.
The rest of the paper is arranged as following: Section 2 describes the selection of the H-KPAIR sample, details of Herschel observation photometry are given in Section 3. Section 4 shows the images catalogs of the H-KPAIR galaxies, and describes the estimation of dust mass and star formation rates using SED fittings, while we describe the selection, data reduction photometry on control sample galaxies in Section 5. Sections 6 7 show statistical comparison results on sSFRs, total gas masses, and star formation efficiencies (SFEs) in H-KPAIRs and the control sample. Discussions will be given in Section 8. We summarize our results and briefly introduce future plans in Section 9.
Throughout this paper, we adopt the -cosmology with and , and .
2. The Herschel KPAIR (H-KPAIR) Sample
The local galaxy pairs sample used in this work (hereafter Herschel KPAIR sample, or H-KPAIR) was constructed from the KPAIR which is a complete and unbiased K-band selected sample of 170 close major-merger galaxy pairs (see details in Domingue et al. 2009, Xu et al. 2010). Pairs in the KPAIR with following characteristics are excluded from H-KPAIR: (1) Elliptical+Elliptical (E+E) pairs; (2) pairs with only one measured redshift; (3) pairs with recession velocities 2000km/s. The resulting sample contains 88 galaxy pairs (176 paired galaxies), of which 44 are Spiral+Spiral (SS) pairs and 44 are Spiral+Elliptical (SE) pairs. Interaction morphology of these pairs was visually checked by three of us (C.C., C.K.X. and D.D). Accordingly, pairs are classified into three types: (1) INT (with signs of interacting, e.g., morphological distortions, tidal tails and bridges, plumes etc.), (2) MER (merging systems) and (1) JUS (’just’ pairs without clear signs of interaction). All galaxies have with a median of z0.04.
3. Herschel Observations
3.1. PACS SPIRE images
Pairs in H-KPAIR were observed successfully using PACS and SPIRE photometers in the three PACS bands (70, 100, 160m) and three SPIRE bands (250, 350, 500m). Observations of 83 pairs were carried within our own proposal (OT2cxu2). All but two of these pairs are smaller than 2’, while the sizes of two large pairs (J1406+5043 and J2047+0019) are between 3’ to 5’.
PACS observations were done in the scanmap mode with medium scan speed (20”/s). Each pair was observed with four concatenated PACS observations. The first two are for the 70 and 160 m bands with orientation angles of 45deg (nominal) and 45deg (orthogonal), respectively, and the other two for the 100 and 160 m bands of the same cross-scan configuration. For small pairs (2’), each scan map has 6 scans with separation of 30” and scan length 3. This yields nearly uniform coverage of a 3’ 3’ region, leaving enough margin outside the pairs for background determination. The average 4- sensitivity limits are 36, 42, and 56 mJy for the three PACS bands. For large pairs we used scan number 10, separation 36” and scan length 6’, yielding a uniform coverage of a 6’ 6’ region and the average 4- sensitivity limits of 30, 36, and 48 mJy. Data reduction was carried out using Herschel Interactive Processing Environment (HIPE; Ott 2010), with the mapmaking done using UNIMAP (Traficante et al., 2011). The mean beam size (full width at half maximum: FWHM) are 5.7”, 6.8”, 12.0” for 70, 100, 1600m images, respectively.
SPIRE observations of small pairs were done in the small-map mode, providing uniformly covered cross-scan maps of 4’ 4’ in 3 SPIRE bands. For large pairs, the observations were done in the large-map mode with nominal scan speed (30”/s), both scan-length and scan-height equal to 6’, and in AB directions. For both the small and large maps, each observation has 4 repeats, yielding confusion limite 4- sensitivities of 29, 30, and 34 mJy in the 3 SPIRE bands, respectively. The SPIRE data were reduced using HIPE 10.0.0 which uses the de-striper for the mapmaking. Bad pixels (PSWF8, PSWE9, PSWB5, PSWD11) were masked. The mean beam FWHM are 18.2”, 24.9”, 36.3” for 250, 350, 500m images, respectively.
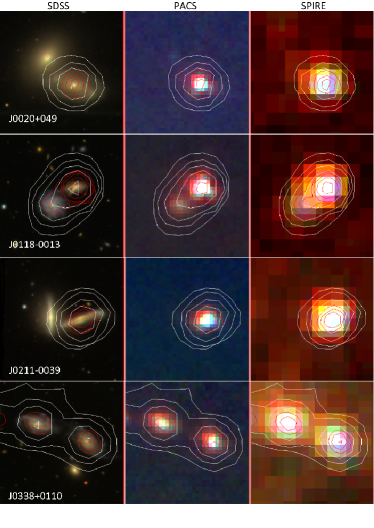
The remaining 5 pairs in H-KPAIR were observed by other OT and KPGT projects, and their Herschel data were taken from the archives. SPIRE images of two pairs (J1101+5720 and J1429+3534) were taken directly from HerMES data release v2. In Table 1 we present the pair galaxy ID, RA Decl, redshift (z), Ks band magnitude (from 2MASS), morphological types (spiral or elliptical), interaction morphological types (as described in Sect.2), and Herschel proposal ID for 176 paired galaxies in the H-KPAIR sample. SDSS, PACS, SPIRE images of all pairs are shown in Figure 1.
Fig. Set1. SDSS, Herschel PACS, SPIRE three-color images of H-KPAIR galaxy pairs
| (1) | (2) | (3) | (4) | (5) | (6) | (7) | (8) | (9) | (10) | (11) |
|---|---|---|---|---|---|---|---|---|---|---|
| Pair ID | Galaxy ID | RA | Dec | z | Ks | Type | Int-type | Herschel-ID | s(p) | (Vz) |
| (KPAIR) | (2MASX) | (J2000) | (J2000) | redshift | (mag) | (kpc) | (km s-1) | |||
| J00200049 | J002025800049350 | 5.107446 | 0.826346 | 0.014864 | 10.98 | S | JUS | OT2cxu2 | 11.44 | 402.0 |
| J002027480050009 | 5.114637 | 0.833554 | 0.016204 | 10.5 | E | JUS | ||||
| J01180013 | J011834170013416 | 19.642259 | 0.228261 | 0.045344 | 12.05 | S | JUS | OT2cxu2 | 27.23 | 54.0 |
| J011835560013594 | 19.648352 | 0.233075 | 0.045524 | 12.88 | S | JUS | ||||
| J02110039 | J021106380039191 | 32.776675 | 0.655108 | 0.017746 | 11.42 | S | JUS | OT2cxu2 | 10.63 | 96.0 |
| J021108320039171 | 32.784577 | 0.654777 | 0.018066 | 10.9 | S | JUS | ||||
| J03380109 | J033812220110088 | 54.550919 | 1.16912 | 0.039201 | 12.42 | S | INT | OT2cxu2 | 24.9 | 432.9 |
| J033812990109414 | 54.554136 | 1.161523 | 0.040644 | 12.77 | E | INT | ||||
| J07541648 | J075431941648214 | 118.633109 | 16.805959 | 0.045869 | 12.03 | S | MER | OT2cxu2 | 13.89 | 104.1 |
| J075432211648349 | 118.634232 | 16.809722 | 0.046216 | 11.55 | S | MER | ||||
| J08083854 | J080833773854534 | 122.14073 | 38.914841 | 0.040173 | 12.37 | S | JUS | OT2cxu2 | 18.71 | 23.7 |
| J080835633854522 | 122.148487 | 38.914504 | 0.040094 | 11.88 | E | JUS | ||||
| J08232120 | J082332662120171 | 125.886114 | 21.338096 | 0.018076 | 12.15 | S | JUS | OT2cxu2 | 15.44 | 0.3 |
| J082334212120515 | 125.892554 | 21.34764 | 0.018075 | 11.52 | S | JUS | ||||
| J08295531 | J082914915531227 | 127.312147 | 55.522992 | 0.025059 | 11.73 | S | JUS | OT2cxu2 | 27.75 | 55.2 |
| J082920835531081 | 127.336797 | 55.518931 | 0.025243 | 11.42 | S | JUS | ||||
| J08364722 | J083644824722188 | 129.186777 | 47.371907 | 0.05256 | 12.28 | S | JUS | OT2cxu2 | 15.8 | 0.0 |
| J083645884722100 | 129.191208 | 47.369469 | 0.05256 | 11.9 | S | JUS | ||||
| J08383054 | J083817593054534 | 129.573312 | 30.914861 | 0.047559 | 12.65 | S | INT | OT2cxu2 | 9.09 | 152.7 |
| J083817953055011 | 129.5748 | 30.916973 | 0.048068 | 11.94 | S | INT | ||||
| J08393613 | J083859733613164 | 129.748888 | 36.221234 | 0.055618 | 12.04 | E | JUS | OT2cxu2 | 26.58 | 231.6 |
| J083901253613042 | 129.755226 | 36.217846 | 0.054846 | 12.55 | S | JUS | ||||
| J08412642 | J084149592642578 | 130.456662 | 26.716073 | 0.084834 | 12.27 | S | JUS | OT2cxu2 | 30.64 | 300.0 |
| J084150542642475 | 130.460609 | 26.713209 | 0.085834 | 12.99 | E | JUS | ||||
| J09065144 | J090602835144411 | 136.511812 | 51.744702 | 0.02912 | 11.68 | E | JUS | OT2cxu2 | 24.29 | 3.3 |
| J090604985144071 | 136.520782 | 51.735305 | 0.029131 | 11.95 | S | JUS | ||||
| J09123547 | J091236363547180 | 138.151523 | 35.788345 | 0.023532 | 11.53 | E | JUS | OT2cxu2 | 14.24 | 6.0 |
| J091236763547462 | 138.153186 | 35.796182 | 0.023512 | 12.34 | S | JUS | ||||
| J09134742 | J091344614742165 | 138.435884 | 47.704599 | 0.051226 | 11.91 | E | INT | OT2cxu2 | 24.32 | 450.9 |
| J091346064742001 | 138.441955 | 47.700051 | 0.052729 | 12.1 | S | INT | ||||
| J09154419 | J091554674419510 | 138.977827 | 44.33086 | 0.039568 | 12.23 | S | MER | OT1dsanders1 | 9.69 | 2.4 |
| J091555524419580 | 138.981364 | 44.332785 | 0.039576 | 11.31 | S | MER | ||||
| J09260447 | J092641110447247 | 141.671319 | 4.790211 | 0.089132 | 13.16 | S | MER | OT2cxu2 | 8.13 | 483.6 |
| J092641370447260 | 141.672412 | 4.790559 | 0.090744 | 12.48 | S | MER | ||||
| J09370245 | J093744130245394 | 144.433951 | 2.760819 | 0.024156 | 10.01 | S | INT | OT2cxu2 | 25.64 | 197.7 |
| J093745060244504 | 144.437634 | 2.74737 | 0.023497 | 10.45 | E | INT | ||||
| J10105440 | J101000795440198 | 152.503332 | 54.672181 | 0.046004 | 12.2 | S | MER | OT2cxu2 | 13.92 | 83.7 |
| J101002125440279 | 152.508859 | 54.674434 | 0.046283 | 12.34 | S | MER | ||||
| J10150657 | J101552570657330 | 153.969058 | 6.959172 | 0.029931 | 12.28 | S | JUS | OT2cxu2 | 13.02 | 244.5 |
| J101553380657495 | 153.972451 | 6.963758 | 0.029116 | 11.3 | E | JUS | ||||
| J10204831 | J102051884831096 | 155.216286 | 48.519406 | 0.052968 | 13.26 | S | INT | OT2cxu2 | 25.94 | 45.0 |
| J102053694831246 | 155.223658 | 48.523383 | 0.053118 | 12.27 | E | INT | ||||
| J10223446 | J102256473446564 | 155.73532 | 34.78235 | 0.05537 | 13.18 | S | INT | OT2cxu2 | 11.56 | 301.5 |
| J102256553446468 | 155.735626 | 34.779681 | 0.056375 | 12.39 | S | INT | ||||
| J10234220 | J102336584220477 | 155.902453 | 42.346583 | 0.045621 | 12.36 | S | INT | OT2cxu2 | 15.98 | 53.1 |
| J102336844221037 | 155.903524 | 42.351041 | 0.045444 | 13.01 | S | INT | ||||
| J10270114 | J102729500114490 | 156.872904 | 1.246742 | 0.023592 | 11.79 | S | INT | OT2cxu2 | 14.21 | 64.8 |
| J102729700115170 | 156.873782 | 1.254605 | 0.023376 | 10.9 | E | INT | ||||
| J10325306 | J103253165306536 | 158.22153 | 53.114916 | 0.06403 | 12.62 | S | INT | OT2cxu2 | 8.32 | 44.7 |
| J103253215306477 | 158.221747 | 53.113263 | 0.063881 | 12.15 | E | INT | ||||
| J10334404 | J103329724404342 | 158.373843 | 44.076176 | 0.052303 | 11.91 | S | JUS | OT2cxu2 | 27.42 | 64.2 |
| J103331624404212 | 158.381778 | 44.072572 | 0.052089 | 12.37 | S | JUS | ||||
| J10365447 | J103642745447356 | 159.178124 | 54.79323 | 0.045841 | 12.47 | S | INT | OT2cxu2 | 16.9 | 17.1 |
| J103644005447489 | 159.183338 | 54.796929 | 0.045784 | 11.63 | E | INT | ||||
| J10393904 | J103923383904501 | 159.847442 | 39.080611 | 0.043464 | 12.49 | S | JUS | OT2cxu2 | 20.35 | 43.2 |
| J103925153904573 | 159.854824 | 39.082589 | 0.04332 | 12.29 | E | JUS | ||||
| J10430645 | J104350530645466 | 160.960666 | 6.76296 | 0.028694 | 11.96 | S | INT | OT2cxu2 | 23.23 | 173.7 |
| J104352680645256 | 160.969501 | 6.75702 | 0.028115 | 12.2 | S | INT | ||||
| J10453910 | J104524783910298 | 161.353285 | 39.174955 | 0.026834 | 11.63 | S | JUS | OT2cxu2 | 22.72 | 340.5 |
| J104524963909499 | 161.354008 | 39.163873 | 0.025699 | 11.41 | E | JUS | ||||
| J10515101 | J105143685101195 | 162.93181 | 51.022155 | 0.025027 | 10.27 | E | JUS | OT2cxu2 | 6.99 | 366.0 |
| J105144505101303 | 162.935331 | 51.025075 | 0.023807 | 10.97 | S | JUS | ||||
| J10590857 | J105958690857215 | 164.994547 | 8.955983 | 0.063163 | 12.01 | E | JUS | OT2cxu2 | 21.62 | 140.1 |
| J105959150857357 | 164.996465 | 8.95992 | 0.062696 | 12.95 | S | JUS | ||||
| J11015720 | J110143575720058 | 165.431565 | 57.334969 | 0.046903 | 12.46 | E | JUS | KPGTsoliver1 | 28.03 | 276.0 |
| J110143645720336 | 165.431837 | 57.342686 | 0.047823 | 13.17 | S | JUS | ||||
| J11064751 | J110649444751119 | 166.706021 | 47.853312 | 0.064324 | 12.66 | S | INT | OT2cxu2 | 17.92 | 334.8 |
| J110650684751090 | 166.711183 | 47.85252 | 0.06544 | 12.44 | S | INT | ||||
| J11200028 | J112046570028142 | 170.194061 | 0.470612 | 0.025534 | 11.78 | S | JUS | OT2cxu2 | 12.33 | 25.2 |
| J112048010028068 | 170.200062 | 0.468579 | 0.025618 | 11.0 | S | JUS | ||||
| J11250226 | J112517040227007 | 171.321025 | 2.450198 | 0.050379 | 12.75 | S | INT | OT2cxu2 | 12.99 | 84.0 |
| J112517160226488 | 171.321518 | 2.446913 | 0.050659 | 12.14 | S | INT | ||||
| J11273604 | J112732893604168 | 171.887066 | 36.071335 | 0.035053 | 11.67 | S | JUS | OT2cxu2 | 27.43 | 25.2 |
| J112734673603470 | 171.894471 | 36.063083 | 0.035137 | 10.82 | S | JUS | ||||
| J11374728 | J113754764727588 | 174.478176 | 47.466349 | 0.034334 | 11.28 | E | JUS | OT2cxu2 | 26.63 | 137.7 |
| J113758014728143 | 174.491711 | 47.470652 | 0.033875 | 11.86 | S | JUS |
| (1) | (2) | (3) | (4) | (5) | (6) | (7) | (8) | (9) | (10) | (11) |
|---|---|---|---|---|---|---|---|---|---|---|
| Pair ID | Galaxy ID | RA | Dec | z | Ks | Type | Int-type | Herschel-ID | s(p) | (Vz) |
| (KPAIR) | (2MASX) | (J2000) | (J2000) | redshift | (mag) | (kpc) | (km s-1) | |||
| J11443332 | J114403353332062 | 176.013986 | 33.535072 | 0.031799 | 11.74 | E | INT | OT2cxu2 | 20.48 | 100.5 |
| J114404333332339 | 176.018049 | 33.54277 | 0.031464 | 12.66 | S | INT | ||||
| J11483547 | J114843703547002 | 177.182095 | 35.783414 | 0.064099 | 12.81 | S | INT | OT2cxu2 | 29.11 | 144.0 |
| J114845253547092 | 177.188549 | 35.785896 | 0.063619 | 11.94 | S | INT | ||||
| J11503746 | J115013333746107 | 177.555564 | 37.769659 | 0.055042 | 12.7 | S | INT | OT2cxu2 | 25.36 | 149.4 |
| J115013993746306 | 177.558293 | 37.775167 | 0.05554 | 12.44 | S | INT | ||||
| J11501444 | J115057641444200 | 177.740186 | 14.738912 | 0.057202 | 12.69 | S | INT | OT2cxu2 | 17.17 | 300.0 |
| J115058441444124 | 177.743517 | 14.736805 | 0.056202 | 11.73 | E | INT | ||||
| J11544932 | J115422994932509 | 178.595801 | 49.547493 | 0.070154 | 13.0 | S | INT | OT2cxu2 | 8.23 | 308.4 |
| J115423074932456 | 178.596149 | 49.546019 | 0.071182 | 12.02 | E | INT | ||||
| J12025342 | J120204245342317 | 180.517927 | 53.708769 | 0.064651 | 12.97 | S | INT | OT2cxu2 | 27.14 | 210.3 |
| J120205375342487 | 180.522233 | 53.713478 | 0.06395 | 12.43 | E | INT | ||||
| J12050135 | J120540660135365 | 181.419422 | 1.59349 | 0.022002 | 12.1 | S | JUS | OT2cxu2 | 30.83 | 332.4 |
| J120540730134302 | 181.419711 | 1.575058 | 0.020894 | 11.21 | E | JUS | ||||
| J12114039 | J121155074039182 | 182.97949 | 40.655067 | 0.022854 | 11.82 | S | INT | OT2cxu2 | 7.73 | 195.3 |
| J121156484039184 | 182.98535 | 40.655124 | 0.023505 | 11.98 | S | INT | ||||
| J12191201 | J121917191200582 | 184.821646 | 12.01619 | 0.027303 | 11.83 | E | INT | OT2cxu2 | 13.18 | 160.8 |
| J121918661201054 | 184.827781 | 12.018189 | 0.026767 | 12.8 | S | INT | ||||
| J12434405 | J124338874405399 | 190.911978 | 44.094436 | 0.041791 | 12.09 | S | JUS | OT2cxu2 | 22.6 | 249.9 |
| J124339364406046 | 190.914009 | 44.101295 | 0.040958 | 11.94 | E | JUS | ||||
| J12524645 | J125250114645272 | 193.208797 | 46.757577 | 0.061331 | 12.42 | S | JUS | OT2cxu2 | 27.67 | 104.7 |
| J125252124645294 | 193.21717 | 46.758185 | 0.060982 | 12.2 | E | JUS | ||||
| J13014803 | J130116624803366 | 195.319279 | 48.06018 | 0.030278 | 12.2 | S | INT | OT2cxu2 | 11.84 | 129.6 |
| J130118354803304 | 195.326491 | 48.058471 | 0.029846 | 12.67 | S | INT | ||||
| J13080422 | J130827370422125 | 197.114112 | 4.370179 | 0.025476 | 13.39 | S | JUS | OT2cxu2 | 18.52 | 66.0 |
| J130829640422045 | 197.123418 | 4.367971 | 0.025696 | 12.44 | S | JUS | ||||
| J13133910 | J131314293910360 | 198.309546 | 39.176686 | 0.071586 | 12.24 | E | INT | OT2cxu2 | 8.29 | 0.0 |
| J131314703910382 | 198.311265 | 39.177305 | 0.071586 | 13.1 | S | INT | ||||
| J13154424 | J131513864424264 | 198.807791 | 44.407356 | 0.03586 | 12.01 | S | INT | OT1rmushotz1 | 27.84 | 35.1 |
| J131517264424255 | 198.821937 | 44.407105 | 0.035743 | 11.23 | S | INT | ||||
| J13156207 | J131530766207447 | 198.878026 | 62.129135 | 0.030566 | 11.99 | S | INT | OT1dsanders1 | 22.39 | 6.0 |
| J131535066207287 | 198.896085 | 62.124613 | 0.030586 | 11.54 | S | INT | ||||
| J13320301 | J133255250301347 | 203.230301 | 3.026349 | 0.049306 | 12.95 | S | INT | OT2cxu2 | 21.45 | 297.0 |
| J133256550301395 | 203.235759 | 3.027679 | 0.048316 | 12.19 | S | INT | ||||
| J13460325 | J134620010325407 | 206.583483 | 3.428114 | 0.024781 | 11.19 | S | JUS | OT2cxu2 | 25.03 | 222.0 |
| J134622150325057 | 206.592397 | 3.418283 | 0.025521 | 11.66 | E | JUS | ||||
| J14000254 | J140036610254327 | 210.152556 | 2.909102 | 0.025579 | 11.49 | S | INT | OT2cxu2 | 12.23 | 391.5 |
| J140037960254227 | 210.15818 | 2.906313 | 0.026884 | 11.73 | S | INT | ||||
| J14004251 | J140057834251203 | 210.240969 | 42.85566 | 0.032741 | 11.87 | S | INT | OT2cxu2 | 27.27 | 234.3 |
| J140058794250427 | 210.244986 | 42.845198 | 0.033522 | 12.18 | S | INT | ||||
| J14056542 | J140550796542598 | 211.461632 | 65.716632 | 0.03063 | 12.8 | S | JUS | OT2cxu2 | 23.27 | 39.6 |
| J140553346542277 | 211.472286 | 65.707721 | 0.030762 | 12.0 | E | JUS | ||||
| J14065043 | J140621575043303 | 211.589913 | 50.725106 | 0.006456 | 9.7 | S | JUS | OT2cxu2 | 25.21 | 240.6 |
| J140641275043239 | 211.671969 | 50.723327 | 0.007258 | 9.56 | E | JUS | ||||
| J14070234 | J140707030234513 | 211.779296 | 2.580923 | 0.058555 | 12.44 | S | INT | OT2cxu2 | 14.43 | 300.0 |
| J140707200234402 | 211.780016 | 2.577849 | 0.057555 | 12.96 | E | INT | ||||
| J14233400 | J142342383400324 | 215.926602 | 34.009016 | 0.013553 | 11.48 | S | JUS | OT2cxu2 | 16.14 | 294.0 |
| J142346323401012 | 215.943004 | 34.017002 | 0.012573 | 11.04 | S | JUS | ||||
| J14240304 | J142458310303597 | 216.242996 | 3.066606 | 0.052517 | 12.37 | S | JUS | OT2cxu2 | 13.91 | 300.0 |
| J142459130304012 | 216.246381 | 3.067027 | 0.053517 | 11.9 | S | JUS | ||||
| J14250313 | J142505520313590 | 216.272925 | 3.233119 | 0.037083 | 11.98 | E | INT | OT2cxu2 | 22.37 | 114.0 |
| J142507390313560 | 216.280712 | 3.232055 | 0.037463 | 12.97 | S | INT | ||||
| J14293534 | J142947663534275 | 217.448585 | 35.574313 | 0.028996 | 10.93 | S | JUS | KPGTsoliver1 | 22.07 | 180.3 |
| J142950313534122 | 217.459663 | 35.570065 | 0.029597 | 11.9 | S | JUS | ||||
| J14334004 | J143346834004512 | 218.445139 | 40.080911 | 0.026047 | 10.78 | S | INT | OT2cxu2 | 28.01 | 114.0 |
| J143348404005392 | 218.451475 | 40.094155 | 0.026427 | 11.17 | S | INT | ||||
| J14441207 | J144420551207429 | 221.085649 | 12.128593 | 0.030445 | 11.51 | S | MER | OT2cxu2 | 8.26 | 299.4 |
| J144420791207552 | 221.086655 | 12.132 | 0.031443 | 10.72 | S | MER | ||||
| J15004317 | J150023744316559 | 225.098935 | 43.282197 | 0.031088 | 11.34 | E | JUS | OT2cxu2 | 14.58 | 147.0 |
| J150025004317131 | 225.10417 | 43.286997 | 0.031578 | 11.73 | S | JUS | ||||
| J15053427 | J150531373427534 | 226.380709 | 34.464851 | 0.074528 | 12.98 | S | INT | OT2cxu2 | 9.55 | 300.0 |
| J150531833427526 | 226.38266 | 34.464635 | 0.073528 | 12.36 | E | INT | ||||
| J15060346 | J150643910346364 | 226.682879 | 3.776844 | 0.036278 | 11.48 | S | JUS | OT2cxu2 | 25.24 | 315.0 |
| J150645790346214 | 226.690883 | 3.772574 | 0.035228 | 11.6 | S | JUS | ||||
| J15105810 | J151015875810425 | 227.566059 | 58.178518 | 0.030343 | 11.77 | S | JUS | OT2cxu2 | 10.54 | 402.0 |
| J151017765810375 | 227.574164 | 58.176979 | 0.031683 | 12.35 | S | JUS | ||||
| J15140403 | J151445440403587 | 228.689368 | 4.06633 | 0.0386 | 11.89 | S | INT | OT2cxu2 | 18.81 | 186.0 |
| J151446970403576 | 228.695709 | 4.066007 | 0.03922 | 12.06 | S | INT | ||||
| J15233748 | J152337683749030 | 230.907038 | 37.817522 | 0.023365 | 12.55 | S | INT | OT2cxu2 | 20.09 | 78.3 |
| J152338993748254 | 230.912489 | 37.807073 | 0.023626 | 12.43 | E | INT | ||||
| J15265915 | J152647745915464 | 231.698953 | 59.262907 | 0.044712 | 12.45 | S | INT | OT2cxu2 | 8.77 | 224.1 |
| J152648925915478 | 231.703856 | 59.263304 | 0.045459 | 12.13 | E | INT | ||||
| J15284255 | J152812764255474 | 232.053241 | 42.929924 | 0.018839 | 10.02 | S | INT | OT2cxu2 | 26.53 | 243.0 |
| J152816674256384 | 232.069607 | 42.944107 | 0.018029 | 10.59 | S | INT | ||||
| J15524620 | J155232584620180 | 238.135769 | 46.338356 | 0.059385 | 12.07 | E | INT | OT2cxu2 | 19.46 | 489.0 |
| J155233934620237 | 238.141398 | 46.339933 | 0.061015 | 12.75 | S | INT |
| (1) | (2) | (3) | (4) | (5) | (6) | (7) | (8) | (9) | (10) | (11) |
|---|---|---|---|---|---|---|---|---|---|---|
| Pair ID | Galaxy ID | RA | Dec | z | Ks | Type | Int-type | Herschel-ID | s(p) | (Vz) |
| (KPAIR) | (2MASX) | (J2000) | (J2000) | redshift | (mag) | (kpc) | (km s-1) | |||
| J15564757 | J155621914757172 | 239.091225 | 47.954829 | 0.019103 | 12.1 | S | JUS | OT2cxu2 | 22.96 | 240.0 |
| J155627384757302 | 239.114264 | 47.958429 | 0.019903 | 12.16 | E | JUS | ||||
| J15583227 | J155837493227379 | 239.656243 | 32.460535 | 0.049368 | 13.16 | S | INT | OT2cxu2 | 10.8 | 261.0 |
| J155837843227471 | 239.657667 | 32.463088 | 0.048498 | 12.29 | S | INT | ||||
| J16024111 | J160242544111499 | 240.677392 | 41.197267 | 0.033536 | 11.69 | S | JUS | OT2cxu2 | 18.66 | 69.0 |
| J160244754111589 | 240.686475 | 41.199706 | 0.033306 | 12.5 | S | JUS | ||||
| J16082529 | J160805592529091 | 242.023328 | 25.485866 | 0.041547 | 11.94 | S | MER | OT2cxu2 | 10.96 | 224.1 |
| J160806482529066 | 242.02704 | 25.485182 | 0.042294 | 11.32 | S | MER | ||||
| J16082328 | J160822612328459 | 242.094219 | 23.479425 | 0.04092 | 13.17 | S | JUS | OT2cxu2 | 22.25 | 31.8 |
| J160823542328240 | 242.098125 | 23.473347 | 0.040814 | 12.44 | S | JUS | ||||
| J16143711 | J161454183711064 | 243.72577 | 37.185123 | 0.058169 | 12.13 | S | INT | OT2cxu2 | 9.13 | 0.0 |
| J161454213711136 | 243.725893 | 37.187131 | 0.058169 | 12.04 | E | INT | ||||
| J16284109 | J162824974110064 | 247.104069 | 41.168463 | 0.033017 | 11.47 | S | JUS | OT2cxu2 | 27.9 | 370.8 |
| J162827564109395 | 247.114849 | 41.161 | 0.031781 | 11.52 | S | JUS | ||||
| J16352630 | J163542932630494 | 248.928908 | 26.513727 | 0.070061 | 12.29 | S | INT | OT2cxu2 | 14.99 | 378.0 |
| J163543662630505 | 248.931925 | 26.514045 | 0.071321 | 12.22 | E | INT | ||||
| J16374650 | J163725834650161 | 249.357631 | 46.837824 | 0.057817 | 11.8 | S | JUS | OT2cxu2 | 25.82 | 299.7 |
| J163727544650054 | 249.364787 | 46.834858 | 0.056818 | 12.44 | S | JUS | ||||
| J17021859 | J170203201900006 | 255.513366 | 19.000181 | 0.057322 | 12.39 | E | INT | OT2cxu2 | 17.14 | 462.6 |
| J170203781859495 | 255.515763 | 18.997088 | 0.05578 | 13.18 | S | INT | ||||
| J17043448 | J170450893448530 | 256.212001 | 34.814721 | 0.057213 | 13.06 | S | INT | OT2cxu2 | 11.74 | 270.0 |
| J170450973449020 | 256.212288 | 34.817342 | 0.056313 | 12.4 | S | INT | ||||
| J20470019 | J204719080019150 | 311.829434 | 0.320801 | 0.012971 | 9.08 | S | JUS | OT2cxu2 | 28.98 | 414.0 |
| J204724280018030 | 311.851263 | 0.300826 | 0.011591 | 9.74 | E | JUS |
Note. — Descriptions of Columns: (1) Pair ID. The designations are “KPAIR J0020+0049”, etc. (2) Galaxy ID, taken from 2MASS. (3) RA (deg, J2000). (4) Dec (deg, J2000). (5) redshift z taken from SDSS or other telescopes. (6) () magnitude taken from 2MASS. (7) Morphological type (S: Spirals, E: Ellipticals). (8) Interacting morphological type (INT: with interaction signs; MER: mergers; JUS: without interacting signs, ’just’ pairs). (9) Herschel proposal ID. (10) projected separation (s(p)) between two galaxies in pairs, in kpc. (11) the difference in radial velocity ((Vz)) between two galaxies in pairs, in km s-1.
3.2. PACS SPIRE photometry
We made extended-source photometry on individual galaxies in each pair to get their integrated FIR-submm fluxes. The following two methods were used:
-
1. Aperture photometry: for pairs with large separation compared with the beam size of a given band, elliptical/circular apertures were selected and aperture photometry was performed. The photometric error is the quadratic sum of background subtraction error and the rms error as calculated in Dale et al. (2012). For PACS data, photometry in aperture matching annuli were used to determine the values for sky background subtraction. For SPIRE data, the sky background was estimated using the mean of photometric measurements on 8 elliptical/circular regions (of the same size as the photometric aperture) surrounding the pair. Aperture corrections were applied according to measurements on the PSF images.
-
2. IMFIT model fitting photometry: for blended pairs with small separation, IMFIT (Erwin, 2014) was used to do the 2-component simultaneous model fitting to get the deblended flux for each galaxy. The PACS photometry fits simultaneously a combination of sky level, gaussians and exponential disks for both galaxy components. Initial parameters include the peak intensity, coordinates and appropriate scale. The IMFIT uses minimization and the residual images were examined and adjusted manually. Subsequent initial parameter adjustments were performed to minimize the residual images. The relative flux of each galaxy is fairly robust to the parameter adjustments. Total aperture flux of the pair with division based on relative fits was therefore the chosen photometric method. Errors are based on the area dependent background error estimation for this large aperture with a conservative approach based on half the area of the flux assigned to each galaxy. The pair J09260447 is too blended for the fits to converge to a useful residual and the relative flux could not be determined. The reported errors for this pair are large but constrained by the total flux. The SPIRE photometry uses two types of models in IMFIT: (1) PSF model for point-like galaxies; (2) 2-D gaussian for extended galaxies. Both models also include an uniform background. The photometric errors were estimated using the rms error measured on the residual images: errorrms = rms (residual,per pixel) N / (N: number of pixels in the aperture; n: number of beams in the aperture).
Color corrections were made for 3 SPIRE bands with multiplicative correcting factors of 0.95385, 0.95632, 0.97215 for 250, 350, 500m fluxes, respectively. No calibration errors are included in PACS and SPIRE photometric errors. 4- upper-limits were given for non-detections in both aperture model fitting photometry methods.
4. Dust Mass, and stellar mass
Dust mass and integrated infrared luminosity (8 – 1000m) of individual galaxies are estimated via FIR-submm SED (Spectral Energy Distributions) fitting using the dust emission model of (Draine & Li, 2007) (hereafter DL07). The DL07 model includes emissions from polycyclic aromatic hydrocarbon (PAH) molecules and graphite and silicate grains, covering the entire IR wavelength range from the mid infrared (MIR) though the submm. It is consistent with observations of a variety of infrared continuum and PAH features in local galaxies (e.g., Draine et al. 2007, see also Dale et al. 2012 for more detailed descriptions). In the SED fittings, the Milky way extinction curve (MW3.1) is assumed and the maximum interstellar radiation field intensity is fixed at . The best-fit values of parameters , gamma, qPAH (between 0.5 and 4.5 with the step of 0.1), and Umin (among values of 0.10, 0.15, 0.20, 0.30, 0.40, 0.50, 0.70, 0.80, 1.00, 1.20, 1.50, 2.00, 2.50, 3.00, 4.00, 5.00, 7.00, 8.00, 12.0, 15.0, 20.0, 25.0) are then found via a simple minimization. The errors of includes two terms: (1) error associated with model fitting, estimated using Bayesian analysis (da Cunha et al., 2008); (2) error caused by observational uncertainties, estimated using a Monte-Carlo method: it equals to the standard deviation of the values of resulting from fittings of 300 simulated IR-submm SEDs. In each SED, the flux in a given Herschel band is generated randomly assuming a gaussian probability distribution with the mean equal to the observed flux and the equal to the photometric error. The mean errors of for spirals in H-KPAIRs are estimated to be: 0.0860.020 dex (log10(M⊙)), 0.1010.044 dex, and 0.2130.191 dex for those with all 6-bands Herschel detections, 5-bands Herschel detections and 4-bands Herschel detections, respectively.
We carried out a test to check whether the lack of MIR broadband fluxes in the SED fittings introduces any bias, using 25 H-KPAIR spirals observed by Spitzer (Xu et al., 2010). As shown in Figure 2, the obtained using SED fittings with and without MIR fluxes (IRAC 8m MIPS 24m) agree very well with each other. The scatter is quite small and much lower than other uncertainties. We also found good agreement between LIR and LTIR (estimated from 24, 70, 160m luminosities; Dale et al. 2005). Thus, both and LIR estimated using DL07 model SED fittings from FIR-submm bands are reliable even though the MIR data points are missing. On the other hand, in trials that used two-graybody model (2GB; Dunne & Eales 2001) in the SED fittings of H-KPAIR galaxies, we found that the resulting and are both systematically lower than those obtained using DL07 model (Figure 3). This is mainly due to the fact that the 2GB model does not include the MIR emission at , therefore it underestimates and (Dale et al., 2012).
It should be noted that there might be a systematic underestimation (up to 20) of the LIR for galaxies with very warm MIR-to-FIR colors (f(25m)/f(60m)0.2). These sources are generally associated with bright AGNs (Surace et al., 1998). As discussed in Section 8.1, very few galaxies in our samples may be associated with bright AGNs. Therefore our results shall not be affected significantly by this possible bias. Indeed, Figure 4 shows the dependence of LIR estimations using DL07 SED fittings without or with MIR (Spitzer IRAC MIPS 24m) data points on Spitzer MIR-to-FIR colors: f(24m)/f(70m), for 30 spirals in H-KPAIRs which were also included in Xu et al. (2010). There is only one spiral in pairs (J204719080019150) with warm MIR-to-FIR color (f(24m)/f(70m)0.2), and there are no obvious underestimations of LIR without the use of MIR points.


For H-KPAIR and control sample galaxies (see Section 5) with the number of Herschel band of detections less than four, we used an empirical relation between and (the monochromatic luminosity at 250 ) to estimate the dust mass (or its upper-limit) from the 250m flux (or the upper-limit). The adopted relation is . The (or its upper-limit) of these galaxies was estimated from the the 100m flux (or the upper-limit) according to another empirical relation: . Both relations were derived using H-KPAIR spirals with all 6-band or 5-band detections. Comparing results obtained from SED fittings to those calculated using these relations, the RMS errors of the two empirical relations are 0.27 dex (for ) and 0.11 dex (for ), respectively.
In Table 2 and Table 3 we listed the Herschel fluxes, stellar mass Mstar, the SFR, and total gas masses () of paired spiral and elliptical galaxies, respectively. The SFR is derived from using the formula of Kennicutt (1998), with an additional correction factor of 10-0.20 for the conversion from the Salpeter IMF to the Kroupa IMF (Calzetti, 2013). It is worth noting that this formalism misses the contribution from unobscured UV radiation, which is on the order of 20% for KPAIR galaxies (Yuan et al., 2012). It is also contaminated by the dust emission powered by the radiation of old stars (Buat & Xu, 1996). However, since the same formalism is applied to both H-KPAIR galaxies and control galaxies, these possible biases shall not affect the results on the star formation enhancement of paired galaxies. Mstar is estimated using 2MASS Ks band luminosity: Mstar/LK = 1.32 M⊙/L⊙ (Xu et al., 2004; Domingue et al., 2009), with an additional correction factor of 10-0.39 (Xu et al., 2012b) in order to match those given in SDSS value-added catalogs (Kauffmann et al. 2003; with Kroupa IMF).
| (1) | (2) | (3) | (4) | (5) | (6) | (7) | (8) | (9) | (10) | (11) | (12) |
|---|---|---|---|---|---|---|---|---|---|---|---|
| Galaxy ID | F70m | F100m | F160m | P-PACS | F250m | F350m | F500m | P-SPIRE | logMstar | SFR | log |
| (2MASX) | (mJy) | (mJy) | (mJy) | (mJy) | (mJy) | (mJy) | (M⊙) | (M⊙/yr) | (M⊙) | ||
| J00202580+0049350 | 738.9014.03 | 1067.9015.14 | 1288.5040.76 | AAA | 571.3546.82 | 242.0617.53 | 90.0411.28 | APP | 10.49 | 1.39 | 9.28 |
| J01183417-0013416 | 3507.9020.73 | 3874.9022.54 | 2555.5033.61 | MMM | 1246.09 163.57 | 517.7828.79 | 150.5628.41 | PPP | 10.98 | 55.91 | 10.26 |
| J01183556-0013594 | 459.7020.73 | 814.3022.54 | 997.1033.61 | MMM | 373.6246.31 | 162.5614.32 | 86.01 | PPP | 10.65 | 5.92 | 9.92 |
| J02110638-0039191 | 1126.5015.75 | 1822.7017.70 | 1839.4051.51 | AAA | 989.3583.06 | 401.9520.05 | 135.1211.49 | APP | 10.45 | 2.95 | 9.61 |
| J02110832-0039171 | 37.65 | 42.34 | 60.49 | AAA | 52.509.65 | 25.81 | 35.17 | APP | 10.68 | 0.09 | 8.67 |
| J03381222+0110088 | 368.049.08 | 607.689.90 | 801.8516.88 | AAA | 513.6947.72 | 200.0031.08 | 92.45 | APP | 10.70 | 5.02 | 10.13 |
| J07543194+1648214 | 1365.8410.40 | 1934.7611.60 | 2078.5629.24 | MMM | 1024.4850.21 | 361.6319.41 | 101.2621.93 | PPP | 10.96 | 18.00 | 10.22 |
| J07543221+1648349 | 769.5610.40 | 1485.1411.60 | 1434.7429.24 | MMM | 790.3263.32 | 422.9216.90 | 167.3821.69 | PPP | 11.15 | 12.02 | 10.42 |
| J08083377+3854534 | 121.915.59 | 223.426.56 | 167.7512.23 | AAA | 127.5315.64 | 63.3614.90 | 51.08 | PPP | 10.71 | 1.35 | 9.36 |
| J08233266+2120171 | 732.667.06 | 1037.7011.49 | 928.0714.95 | AAA | 538.0042.87 | 193.8910.74 | 76.2312.43 | AGP | 10.08 | 1.71 | 9.26 |
| J08233421+2120515 | 933.608.62 | 1229.6016.68 | 1115.5021.58 | AAA | 643.1743.90 | 223.9422.02 | 83.0513.54 | AGP | 10.34 | 2.27 | 9.33 |
| J08291491+5531227 | 344.8419.45 | 674.1017.78 | 957.9726.71 | AAA | 614.6345.86 | 295.6426.82 | 160.679.75 | AAG | 10.56 | 1.93 | 10.06 |
| J08292083+5531081 | 368.5012.42 | 697.5114.41 | 927.7519.50 | AAA | 691.6745.51 | 363.7128.46 | 120.4211.07 | AAG | 10.69 | 2.05 | 10.00 |
| J08364482+4722188 | 43.048.44 | 55.958.26 | 69.1614.98 | AAA | 65.06 | 29.21 | 37.30 | PPP | 10.98 | 0.82 | 9.49 |
| J08364588+4722100 | 33.75 | 33.05 | 59.90 | AAA | 35.67 | 31.45 | 30.70 | PPP | 11.13 | 0.49 | 9.27 |
| J08381759+3054534 | 232.065.87 | 365.965.92 | 581.7312.75 | MMM | 137.0511.63 | 69.7410.84 | 36.50 | GPP | 10.74 | 2.90 | 9.61 |
| J08381795+3055011 | 91.525.87 | 144.275.92 | 59.49 | MMM | 161.3811.29 | 77.6411.02 | 38.198.99 | GPP | 11.03 | 1.31 | 8.28 |
| J08390125+3613042 | 62.868.09 | 104.814.79 | 221.3114.71 | AAA | 161.6312.42 | 74.0712.79 | 33.467.98 | PPP | 10.91 | 1.91 | 10.13 |
| J08414959+2642578 | 25.885.11 | 70.298.46 | 106.8415.80 | AAA | 56.008.24 | 25.91 | 33.25 | PPP | 11.41 | 1.44 | 9.69 |
| J09060498+5144071 | 155.628.21 | 270.748.46 | 492.7920.23 | AAA | 338.8124.19 | 157.2216.16 | 69.6210.39 | AAP | 10.60 | 1.26 | 9.84 |
| J09123676+3547462 | 14.80 | 13.55 | 16.17 | AAA | 28.35 | 20.63 | 41.44 | PPP | 10.24 | 0.04 | 8.57 |
| J09134606+4742001 | 208.1410.16 | 406.018.89 | 589.7321.83 | AAA | 308.5411.21 | 148.808.83 | 62.918.28 | GGP | 11.05 | 4.27 | 10.13 |
| J09155467+4419510 | 2426.6714.10 | 2992.4812.48 | 2994.0928.97 | MMM | 1085.3692.00 | 342.2031.64 | 248.9327.21 | PPP | 10.74 | 26.18 | 10.19 |
| J09155552+4419580 | 4541.4314.10 | 5820.1412.48 | 5134.2128.97 | MMM | 2254.33 100.27 | 1026.7631.55 | 218.3526.69 | PPP | 11.11 | 43.22 | 10.41 |
| J09264111+0447247 | 16.3616.36 | 19.3619.36 | 19.8019.80 | CCC | 37.608.04 | 36.87 | 36.94 | PPP | 11.10 | 1.05 | 10.37 |
| J09264137+0447260 | 16.3616.36 | 19.3619.36 | 19.8019.80 | CCC | 35.49 | 36.21 | 36.72 | PPP | 11.38 | 0.91 | 9.70 |
| J09374413+0245394 | 2601.6038.65 | 4557.4045.05 | 6157.9078.87 | AAA | 3101.00 124.44 | 1347.9277.60 | 505.4150.50 | AAA | 11.16 | 9.83 | 10.37 |
| J10100079+5440198 | 427.648.06 | 969.537.00 | 1404.1926.20 | MMM | 735.3657.31 | 356.7322.99 | 123.5513.80 | PPP | 10.89 | 6.40 | 10.35 |
| J10100212+5440279 | 168.228.06 | 312.577.00 | 430.6126.20 | MMM | 366.3440.03 | 128.1914.54 | 57.69 | PPP | 10.84 | 3.30 | 10.08 |
| J10155257+0657330 | 15.62 | 64.945.58 | 85.747.00 | AAA | 95.7612.28 | 51.46 | 45.76 | PPP | 10.45 | 0.28 | 9.16 |
| J10205188+4831096 | 138.955.57 | 298.699.27 | 290.6316.50 | AAA | 167.9113.07 | 70.558.64 | 34.74 | PPP | 10.59 | 2.10 | 9.67 |
| J10225647+3446564 | 244.086.22 | 332.407.06 | 352.3118.98 | AAA | 176.5510.60 | 85.878.87 | 42.328.71 | PPP | 10.66 | 5.65 | 9.88 |
| J10225655+3446468 | 13.71 | 15.56 | 19.50 | AAA | 42.02 | 28.51 | 36.47 | PPP | 10.99 | 0.27 | 9.37 |
| J10233658+4220477 | 718.848.05 | 1085.128.56 | 1265.4721.92 | MMM | 558.5021.07 | 239.0811.65 | 83.179.48 | PPP | 10.81 | 9.52 | 10.05 |
| J10233684+4221037 | 268.068.05 | 346.878.56 | 290.1221.92 | MMM | 195.6717.87 | 71.9612.90 | 36.43 | PPP | 10.55 | 3.84 | 9.59 |
| J10272950+0114490 | 746.2911.60 | 1175.2011.27 | 1262.9035.01 | AAA | 586.3847.10 | 251.3615.89 | 70.939.21 | PPP | 10.42 | 1.91 | 9.44 |
| J10325316+5306536 | 17.50 | 47.036.53 | 85.3218.46 | AAA | 39.18 | 36.44 | 32.48 | PPP | 11.02 | 1.03 | 9.46 |
| J10332972+4404342 | 679.807.60 | 1143.7813.46 | 1000.2723.74 | AMM | 561.4220.29 | 310.5413.69 | 113.3510.87 | GPP | 11.12 | 14.35 | 10.39 |
| J10333162+4404212 | 211.618.35 | 443.8213.46 | 779.9323.74 | AMM | 296.3031.67 | 119.2917.97 | 41.609.00 | GPP | 10.93 | 4.17 | 9.99 |
| J10364274+5447356 | 15.18 | 14.42 | 15.42 | AAA | 50.46 | 41.84 | 40.66 | PPP | 10.78 | 0.17 | 9.29 |
| J10392338+3904501 | 14.47 | 16.22 | 54.8810.71 | AAA | 57.8410.40 | 23.993.76 | 32.84 | PPP | 10.72 | 0.16 | 9.29 |
| J10435053+0645466 | 908.746.93 | 1426.009.42 | 1527.2030.11 | AAA | 739.6255.76 | 268.3026.47 | 126.2713.54 | APP | 10.53 | 4.46 | 9.78 |
| J10435268+0645256 | 70.025.10 | 128.945.83 | 345.6617.53 | AAA | 245.6722.10 | 116.3115.33 | 76.56 | APP | 10.42 | 0.56 | 9.80 |
| J10452478+3910298 | 112.4212.10 | 122.567.02 | 244.2016.00 | AAA | 189.6918.59 | 81.9410.03 | 40.28 | APP | 10.63 | 0.67 | 9.63 |
| J10514450+5101303 | 55.53 | 53.29 | 62.73 | AAA | 35.27 | 35.19 | 32.71 | PPP | 10.80 | 0.16 | 8.66 |
| J10595915+0857357 | 14.47 | 14.63 | 20.26 | AAA | 43.21 | 28.80 | 40.62 | PPP | 10.86 | 0.32 | 9.47 |
| J11014364+5720336 | 9.04 | 178.93 | 24.27 | AAA | 58.01 | 52.54 | 64.05 | PPP | 10.54 | 2.01 | 9.37 |
| J11064944+4751119 | 11.86 | 12.65 | 13.89 | AAA | 85.33 | 48.39 | 43.96 | PPP | 11.00 | 0.30 | 9.74 |
| J11065068+4751090 | 259.748.73 | 456.009.30 | 519.0921.25 | AAA | 352.1724.81 | 134.438.95 | 47.6310.59 | PPP | 11.11 | 8.47 | 10.22 |
| J11204657+0028142 | 318.5238.33 | 275.7936.70 | 220.1612.98 | AAA | 87.888.61 | 44.908.95 | 44.09 | GPP | 10.49 | 1.12 | 8.55 |
| J11204801+0028068 | 49.52 | 47.52 | 46.04 | AAA | 67.869.51 | 40.36 | 46.21 | GPP | 10.80 | 0.14 | 8.90 |
| J11251704+0227007 | 13.50 | 17.16 | 19.39 | AAA | 40.9510.25 | 43.79 | 51.00 | PPP | 10.72 | 0.23 | 9.26 |
| J11251716+0226488 | 51.045.94 | 138.389.60 | 219.0322.83 | AAA | 164.5212.36 | 87.7314.98 | 45.87 | PPP | 10.97 | 1.13 | 9.96 |
| (1) | (2) | (3) | (4) | (5) | (6) | (7) | (8) | (9) | (10) | (11) | (12) |
|---|---|---|---|---|---|---|---|---|---|---|---|
| Galaxy ID | F70m | F100m | F160m | P-PACS | F250m | F350m | F500m | P-SPIRE | logMstar | SFR | log |
| (2MASX) | (mJy) | (mJy) | (mJy) | (mJy) | (mJy) | (mJy) | (M⊙) | (M⊙/yr) | (M⊙) | ||
| J11273289+3604168 | 70.875.20 | 154.659.90 | 275.7213.37 | AAA | 185.1217.20 | 70.089.25 | 46.059.85 | AGG | 10.84 | 0.78 | 9.62 |
| J11273467+3603470 | 624.3412.74 | 1417.0012.21 | 1887.0024.35 | AAA | 1180.7679.62 | 482.7314.53 | 158.6310.97 | AGG | 11.19 | 4.98 | 10.24 |
| J11375801+4728143 | 17.95 | 19.32 | 22.62 | AAA | 76.98 | 38.08 | 51.27 | PPP | 10.75 | 0.12 | 9.20 |
| J11440433+3332339 | 156.586.84 | 334.386.35 | 386.6111.86 | AAA | 277.059.74 | 101.8420.70 | 51.09 | PPP | 10.35 | 1.11 | 9.58 |
| J11484370+3547002 | 245.7112.07 | 562.9811.80 | 928.8822.28 | MMM | 514.8837.78 | 216.0711.40 | 78.6410.56 | PPP | 10.94 | 7.84 | 10.44 |
| J11484525+3547092 | 267.6112.07 | 598.3211.80 | 459.2222.28 | MMM | 402.2754.30 | 189.0711.91 | 53.548.82 | PPP | 11.27 | 7.14 | 10.25 |
| J11501333+3746107 | 15.49 | 41.943.82 | 124.0413.85 | AAM | 47.707.24 | 33.95 | 33.85 | PPP | 10.84 | 0.66 | 9.40 |
| J11501399+3746306 | 148.805.95 | 320.166.54 | 309.7013.85 | AAM | 248.539.61 | 113.717.55 | 44.0410.79 | PPP | 10.95 | 3.44 | 10.05 |
| J11505764+1444200 | 14.87 | 14.06 | 17.12 | AAA | 25.48 | 27.27 | 26.19 | PPP | 10.87 | 0.25 | 9.19 |
| J11542299+4932509 | 14.52 | 15.08 | 16.62 | AAA | 35.458.80 | 32.56 | 38.89 | PPP | 10.95 | 0.42 | 9.49 |
| J12020424+5342317 | 41.225.33 | 71.544.85 | 119.4410.72 | AAA | 97.158.57 | 47.166.46 | 39.11 | PPP | 10.88 | 1.78 | 10.03 |
| J12054066+0135365 | 34.41 | 42.56 | 32.47 | AAA | 43.02 | 36.57 | 39.41 | AAA | 10.21 | 0.09 | 8.61 |
| J12115507+4039182 | 467.6321.33 | 690.9820.83 | 851.8243.60 | MMM | 264.7920.04 | 123.7315.98 | 67.02 | PPP | 10.40 | 1.08 | 9.14 |
| J12115648+4039184 | 2413.8721.33 | 2090.6020.83 | 1031.3743.60 | MMM | 467.8417.31 | 155.5710.70 | 90.9711.70 | PPP | 10.36 | 7.14 | 9.12 |
| J12191866+1201054 | 164.667.39 | 237.807.52 | 392.8926.58 | AAA | 189.2011.91 | 82.4314.21 | 35.338.12 | PPP | 10.12 | 0.83 | 9.34 |
| J12433887+4405399 | 93.446.88 | 190.877.06 | 291.0716.53 | AAA | 189.8411.52 | 82.2812.26 | 29.52 | PPP | 10.84 | 1.17 | 9.64 |
| J12525011+4645272 | 51.065.86 | 106.385.43 | 124.404.74 | AAA | 122.609.68 | 58.8610.75 | 44.78 | PPP | 11.05 | 1.84 | 10.07 |
| J13011662+4803366 | 922.4511.95 | 1206.1612.70 | 1144.1130.74 | MMM | 504.6336.55 | 198.8811.70 | 74.3910.65 | PPP | 10.51 | 5.62 | 9.62 |
| J13011835+4803304 | 675.0511.95 | 975.2412.70 | 845.7830.74 | MMM | 366.0531.51 | 162.1011.22 | 47.2911.94 | PPP | 10.31 | 2.94 | 9.43 |
| J13082737+0422125 | 54.107.99 | 124.306.83 | 179.0114.30 | AAA | 139.9714.04 | 75.347.13 | 33.205.76 | GPP | 9.84 | 0.28 | 9.35 |
| J13082964+0422045 | 74.687.92 | 149.928.14 | 222.2712.76 | AAA | 171.7610.19 | 93.8514.69 | 35.386.46 | GPP | 10.22 | 0.38 | 9.43 |
| J13131470+3910382 | 23.14 | 24.15 | 67.02 | AAA | 33.20 | 36.51 | 31.20 | PPP | 10.92 | 0.68 | 9.48 |
| J13151386+4424264 | 256.7011.79 | 483.176.95 | 569.0213.79 | AAA | 411.3635.87 | 164.6116.70 | 80.63 | APP | 10.73 | 2.35 | 9.88 |
| J13151726+4424255 | 1105.109.30 | 1094.208.30 | 669.7120.69 | AAA | 340.7531.14 | 138.5711.12 | 61.67 | APP | 11.04 | 8.29 | 9.41 |
| J13153076+6207447 | 1894.6224.13 | 2488.2021.36 | 2602.0363.41 | MMM | 923.0178.71 | 320.4144.00 | 116.7126.82 | APP | 10.62 | 7.59 | 9.80 |
| J13153506+6207287 | 9522.3724.13 | 8581.7721.36 | 5586.2763.41 | MMM | 1615.77 135.74 | 539.4641.27 | 167.1224.28 | APP | 10.80 | 55.30 | 9.81 |
| J13325525-0301347 | 423.1011.84 | 542.1112.36 | 416.8520.37 | MMM | 300.3312.92 | 93.4910.37 | 33.69 | PPP | 10.62 | 7.08 | 9.67 |
| J13325655-0301395 | 276.8111.84 | 476.7912.36 | 612.9520.37 | MMM | 281.7219.14 | 148.0212.66 | 49.389.48 | PPP | 10.91 | 4.37 | 9.91 |
| J13462001-0325407 | 34.854.92 | 202.5210.65 | 309.6625.46 | AAA | 223.8218.24 | 107.9812.36 | 42.407.74 | AAP | 10.69 | 0.28 | 9.45 |
| J14003661-0254327 | 41.24 | 25.074.92 | 51.99 | AAA | 32.23 | 24.77 | 42.83 | PPP | 10.60 | 0.08 | 8.63 |
| J14003796-0254227 | 13.46 | 16.89 | 15.99 | AAA | 48.94 | 29.11 | 30.13 | PPP | 10.55 | 0.06 | 8.82 |
| J14005783+4251203 | 1101.709.93 | 1573.7011.16 | 1726.9339.41 | AAM | 893.1869.75 | 352.6729.30 | 129.5012.79 | APP | 10.71 | 8.10 | 10.01 |
| J14005879+4250427 | 1407.3010.47 | 1788.8012.41 | 1798.3739.41 | AAM | 849.7062.63 | 303.0619.83 | 99.4814.24 | APP | 10.60 | 9.88 | 9.86 |
| J14055079+6542598 | 81.296.76 | 161.016.26 | 221.4910.95 | AAA | 182.8017.26 | 103.0710.63 | 55.799.48 | APP | 10.30 | 0.73 | 9.80 |
| J14062157+5043303 | 4848.3025.34 | 8820.2024.14 | 10480.0058.91 | AAA | 4350.49 166.18 | 1990.0176.04 | 695.1563.28 | AAA | 10.14 | 0.92 | 9.32 |
| J14070703-0234513 | 44.435.16 | 165.849.56 | 220.3810.74 | AAA | 164.4815.13 | 86.588.92 | 36.218.79 | PPP | 10.98 | 1.49 | 10.01 |
| J14234238+3400324 | 954.068.13 | 1465.1012.39 | 1596.0022.30 | AAA | 789.0058.13 | 360.5528.53 | 124.1013.66 | AAP | 10.06 | 0.97 | 9.23 |
| J14234632+3401012 | 237.138.52 | 499.6511.25 | 698.0917.35 | AAA | 446.2742.09 | 224.3422.98 | 76.0611.45 | AAP | 10.16 | 0.26 | 9.08 |
| J14245831-0303597 | 253.647.85 | 591.0911.13 | 857.0022.18 | AAA | 325.6516.98 | 115.1615.83 | 53.15 | GPP | 10.91 | 4.07 | 9.96 |
| J14245913-0304012 | 40.60 | 43.69 | 27.89 | AAA | 222.1516.49 | 129.2015.86 | 61.3913.81 | GPP | 11.12 | 0.62 | 9.92 |
| J14250739+0313560 | 15.68 | 13.71 | 13.43 | AAA | 39.41 | 33.13 | 33.58 | PPP | 10.36 | 0.10 | 9.01 |
| J14294766+3534275 | 18.043.67 | 175.35 | 49.5112.07 | AAA | 66.4510.80 | 65.79 | 46.34 | APP | 10.97 | 0.68 | 9.02 |
| J14295031+3534122 | 180.585.65 | 283.0415.59 | 254.069.01 | AAA | 177.9016.70 | 61.329.05 | 49.03 | APP | 10.60 | 1.06 | 9.24 |
| J14334683+4004512 | 886.4912.00 | 1345.4014.96 | 1763.5037.31 | AAM | 892.5374.85 | 446.4441.59 | 206.7010.84 | AAG | 10.94 | 4.38 | 10.11 |
| J14334840+4005392 | 1459.0012.23 | 2146.8010.61 | 2496.3037.31 | AAM | 1102.5785.57 | 462.3936.70 | 136.348.90 | AAG | 10.79 | 5.30 | 9.81 |
| J14442055+1207429 | 258.7311.30 | 392.3212.00 | 565.2229.96 | MMM | 180.0520.87 | 164.4112.67 | 68.7911.10 | GGP | 10.76 | 1.15 | 9.21 |
| J14442079+1207552 | 574.6011.30 | 1234.1812.00 | 1598.1829.96 | MMM | 895.8922.73 | 287.7010.92 | 117.7210.60 | GGP | 11.11 | 3.48 | 10.05 |
| J15002500+4317131 | 27.945.11 | 18.18 | 16.77 | AAA | 45.82 | 52.13 | 48.99 | PPP | 10.73 | 0.10 | 8.96 |
| J15053137+3427534 | 13.13 | 14.13 | 12.73 | AAA | 35.21 | 36.48 | 34.79 | PPP | 11.00 | 0.44 | 9.53 |
| J15064391+0346364 | 33.087.23 | 32.597.23 | 85.47 | AAA | 45.73 | 42.30 | 35.47 | GGP | 10.93 | 0.21 | 9.04 |
| J15064579+0346214 | 232.459.24 | 477.5913.24 | 780.6866.13 | AAA | 441.2736.88 | 202.4610.04 | 88.8710.08 | GGP | 10.86 | 2.22 | 9.97 |
| J15101587+5810425 | 41.0210.00 | 18.51 | 24.37 | MMM | 66.01 | 39.97 | 37.62 | PPP | 10.70 | 0.09 | 9.07 |
| J15101776+5810375 | 304.7210.00 | 697.739.03 | 806.4865.40 | MMM | 427.4321.74 | 176.687.71 | 62.5110.13 | PPP | 10.50 | 2.04 | 9.68 |
| (1) | (2) | (3) | (4) | (5) | (6) | (7) | (8) | (9) | (10) | (11) | (12) |
|---|---|---|---|---|---|---|---|---|---|---|---|
| Galaxy ID | F70m | F100m | F160m | P-PACS | F250m | F350m | F500m | P-SPIRE | logMstar | SFR | log |
| (2MASX) | (mJy) | (mJy) | (mJy) | (mJy) | (mJy) | (mJy) | (M⊙) | (M⊙/yr) | (M⊙) | ||
| J15144544+0403587 | 26.81 | 39.847.79 | 69.46 | AAA | 64.4712.30 | 29.827.12 | 35.19 | PPP | 10.83 | 0.29 | 9.21 |
| J15144697+0403576 | 17.54 | 18.90 | 48.40 | AAA | 33.51 | 30.61 | 35.12 | PPP | 10.77 | 0.15 | 8.99 |
| J15233768+3749030 | 130.266.35 | 164.975.60 | 154.3317.71 | AAA | 119.5112.49 | 47.458.17 | 53.55 | APP | 10.14 | 0.47 | 8.95 |
| J15264774+5915464 | 14.01 | 12.35 | 15.42 | AAA | 28.48 | 23.89 | 29.13 | PPP | 10.77 | 0.14 | 9.06 |
| J15281276+4255474 | 1502.2017.05 | 3183.2020.78 | 3633.4041.97 | AAA | 1966.20 114.11 | 807.6954.68 | 294.2029.05 | AAA | 10.96 | 2.93 | 9.91 |
| J15281667+4256384 | 84.096.07 | 147.595.43 | 192.5721.48 | AAA | 72.0810.49 | 58.76 | 49.29 | AAA | 10.70 | 0.14 | 8.46 |
| J15523393+4620237 | 110.886.21 | 261.347.68 | 385.2020.21 | AAA | 267.3014.16 | 116.318.99 | 38.577.70 | PPP | 10.92 | 3.53 | 10.16 |
| J15562191+4757172 | 522.757.89 | 721.787.39 | 761.4017.63 | AAA | 466.3934.08 | 198.5719.07 | 66.377.78 | AAP | 10.15 | 1.50 | 9.37 |
| J15583749+3227379 | 8.29 | 8.79 | 10.26 | AAA | 78.5718.18 | 32.057.55 | 25.68 | PPP | 10.56 | 0.12 | 9.50 |
| J15583784+3227471 | 349.876.76 | 627.047.22 | 702.9812.78 | AAA | 361.7220.96 | 151.295.88 | 41.597.21 | PPP | 10.89 | 4.81 | 9.89 |
| J16024254+4111499 | 1442.5514.88 | 2267.3112.52 | 2364.6628.23 | MMM | 1056.5427.49 | 470.4934.98 | 184.4211.57 | GPP | 10.81 | 10.66 | 10.13 |
| J16024475+4111589 | 413.4514.88 | 691.2912.52 | 910.2428.23 | MMM | 380.2216.91 | 182.9718.21 | 67.529.14 | GPP | 10.48 | 2.84 | 9.71 |
| J16080559+2529091 | 92.56 | 214.789.41 | 558.6220.08 | MMM | 181.2714.99 | 67.98 | 58.70 | PPP | 10.90 | 1.78 | 9.67 |
| J16080648+2529066 | 131.0414.51 | 240.689.41 | 122.4920.08 | MMM | 342.9319.66 | 198.3718.06 | 56.18 | PPP | 11.16 | 2.14 | 10.08 |
| J16082261+2328459 | 138.829.96 | 267.168.47 | 669.1733.34 | AAM | 326.2513.67 | 99.0312.32 | 57.118.58 | GPP | 10.38 | 1.82 | 9.93 |
| J16082354+2328240 | 951.206.74 | 1278.6016.78 | 1109.6333.34 | AAM | 488.8818.52 | 263.9211.27 | 72.677.70 | GPP | 10.67 | 10.37 | 9.95 |
| J16145418+3711064 | 22.82 | 24.924.90 | 22.74 | AAA | 30.49 | 46.44 | 47.06 | PPP | 11.12 | 0.46 | 9.29 |
| J16282497+4110064 | 51.50 | 52.55 | 45.85 | AAA | 38.44 | 40.42 | 37.49 | APP | 10.89 | 0.29 | 8.93 |
| J16282756+4109395 | 18.133.50 | 57.435.41 | 40.509.25 | AAA | 38.44 | 31.81 | 37.19 | APP | 10.83 | 0.30 | 8.90 |
| J16354293+2630494 | 25.365.11 | 33.535.36 | 59.0212.87 | AAA | 38.60 | 41.14 | 36.54 | PPP | 11.23 | 0.90 | 9.52 |
| J16372583+4650161 | 41.586.93 | 107.556.02 | 308.1324.89 | AAM | 140.869.72 | 106.3318.11 | 53.509.39 | GPP | 11.26 | 1.64 | 10.20 |
| J16372754+4650054 | 69.347.52 | 179.908.12 | 205.4324.89 | AAM | 267.817.56 | 109.99 | 59.72 | GPP | 10.98 | 2.09 | 10.19 |
| J17020378+1859495 | 20.26 | 18.22 | 23.73 | AAA | 28.63 | 37.35 | 31.44 | PPP | 10.67 | 0.31 | 9.23 |
| J17045089+3448530 | 303.078.38 | 479.899.62 | 156.5430.62 | MMM | 300.3934.50 | 117.59 | 66.97 | PPP | 10.74 | 7.42 | 9.88 |
| J17045097+3449020 | 1310.338.38 | 1628.119.62 | 1808.0630.62 | MMM | 654.2836.22 | 298.3629.33 | 88.7916.17 | PPP | 10.99 | 24.71 | 10.21 |
| J20471908+0019150 | 1002.6063.17 | 1419.1054.45 | 3087.2074.43 | AAA | 2383.84 105.02 | 1214.4976.78 | 481.0532.56 | AAA | 11.09 | 1.83 | 10.18 |
Note. — Descriptions of Columns: (1) Galaxy ID, taken from 2MASS. (2) Herschel PACS 70m flux (mJy). (3) Herschel PACS 100m flux (mJy). (4) Herschel PACS 160m flux (mJy). (5) Herschel PACS photometric methods, ’A’: aperture, ’M’: model fitting, ’C’: compact. (6) Herschel SPIRE 250m flux (mJy). (7) Herschel SPIRE 350m flux (mJy). (8) Herschel SPIRE 500m flux (mJy). (9) Herschel SPIRE photometric methods, ’A’: aperture, ’P’: PSF fitting, ’G’: Gaussian fitting. (10) Stellar mass (log(M⊙)). (11) Star formation rate (M⊙/yr). (12) Total gas mass (log(M⊙)).
| (1) | (2) | (3) | (4) | (5) | (6) | (7) | (8) | (9) | (10) | (11) | (12) |
|---|---|---|---|---|---|---|---|---|---|---|---|
| Galaxy ID | F70m | F100m | F160m | P-PACS | F250m | F350m | F500m | P-SPIRE | logMstar | SFR | log |
| (2MASX) | (mJy) | (mJy) | (mJy) | (mJy) | (mJy) | (mJy) | (M⊙) | (M⊙/yr) | (M⊙) | ||
| J00202748+0050009 | 25.37 | 32.417.31 | 91.5912.06 | AAA | 55.5510.24 | 48.28 | 46.92 | APP | 10.75 | 0.06 | 8.62 |
| J03381299+0109414 | 326.7312.60 | 647.899.68 | 837.6922.90 | AAA | 32.20 | 67.56 | 62.95 | APP | 10.55 | 4.85 | 9.03 |
| J08083563+3854522 | 18.58 | 16.62 | 18.30 | AAA | 29.87 | 37.62 | 51.16 | PPP | 10.89 | 0.15 | 8.99 |
| J08385973+3613164 | 59.26 | 31.695.30 | 29.82 | AAA | 41.85 | 47.14 | 37.81 | PPP | 11.12 | 0.53 | 9.37 |
| J08415054+2642475 | 12.21 | 14.45 | 12.85 | AAA | 34.25 | 20.46 | 29.21 | PPP | 11.13 | 0.62 | 9.64 |
| J09060283+5144411 | 20.84 | 21.48 | 21.92 | AAA | 33.19 | 24.55 | 51.83 | AAP | 10.70 | 0.10 | 8.80 |
| J09123636+3547180 | 20.22 | 18.51 | 21.32 | AAA | 31.78 | 45.99 | 44.77 | PPP | 10.56 | 0.06 | 8.61 |
| J09134461+4742165 | 10.53 | 17.283.35 | 25.01 | AAA | 64.8011.55 | 44.858.38 | 32.64 | GGP | 11.10 | 0.25 | 9.46 |
| J09374506+0244504 | 49.45 | 57.59 | 65.53 | AAA | 129.5015.27 | 107.0216.36 | 80.0015.11 | AAA | 10.96 | 0.15 | 9.09 |
| J10155338+0657495 | 25.624.03 | 33.364.06 | 26.675.34 | AAA | 61.30 | 50.34 | 57.53 | PPP | 10.81 | 0.14 | 8.98 |
| J10205369+4831246 | 18.30 | 20.073.82 | 48.916.01 | AAA | 46.4510.62 | 33.10 | 36.51 | PPP | 10.99 | 0.31 | 9.37 |
| J10272970+0115170 | 46.39 | 45.08 | 58.29 | AAA | 76.12 | 42.78 | 49.04 | PPP | 10.76 | 0.12 | 8.88 |
| J10325321+5306477 | 17.50 | 16.11 | 20.65 | AAA | 50.9310.39 | 35.66 | 36.89 | PPP | 11.20 | 0.37 | 9.55 |
| J10364400+5447489 | 15.18 | 27.104.76 | 57.7211.39 | AAA | 30.85 | 23.60 | 41.35 | PPP | 11.12 | 0.31 | 9.11 |
| J10392515+3904573 | 14.47 | 16.22 | 21.51 | AAA | 38.05 | 21.70 | 33.19 | PPP | 10.79 | 0.16 | 9.13 |
| J10452496+3909499 | 28.51 | 38.90 | 34.46 | AAA | 35.64 | 36.29 | 31.78 | APP | 10.68 | 0.13 | 8.71 |
| J10514368+5101195 | 47.686.11 | 99.256.01 | 138.4017.17 | AAA | 55.8710.04 | 33.47 | 29.42 | PPP | 11.12 | 0.18 | 8.71 |
| J10595869+0857215 | 14.47 | 14.63 | 20.26 | AAA | 47.95 | 27.39 | 44.41 | PPP | 11.23 | 0.32 | 9.50 |
| J11014357+5720058 | 9.04 | 178.93 | 24.27 | AAA | 55.69 | 66.14 | 85.02 | PPP | 10.80 | 1.93 | 9.34 |
| J11375476+4727588 | 24.93 | 26.84 | 72.58 | AAA | 37.68 | 30.10 | 45.17 | PPP | 10.99 | 0.17 | 8.95 |
| J11440335+3332062 | 89.036.78 | 192.157.59 | 193.808.79 | AAA | 105.1311.00 | 62.13 | 34.15 | PPP | 10.73 | 0.48 | 9.04 |
| J11505844+1444124 | 20.46 | 19.35 | 22.64 | AAA | 25.34 | 28.65 | 33.72 | PPP | 11.24 | 0.32 | 9.18 |
| J11542307+4932456 | 14.52 | 15.08 | 16.62 | AAA | 33.47 | 33.82 | 32.59 | PPP | 11.35 | 0.43 | 9.48 |
| J12020537+5342487 | 14.04 | 12.79 | 13.48 | AAA | 34.01 | 33.20 | 43.16 | PPP | 11.09 | 0.30 | 9.40 |
| J12054073+0134302 | 16.63 | 20.56 | 17.76 | AAA | 43.02 | 36.57 | 39.41 | AAA | 10.52 | 0.04 | 8.57 |
| J12191719+1200582 | 24.65 | 25.10 | 33.60 | AAA | 35.82 | 39.65 | 28.11 | PPP | 10.53 | 0.09 | 8.73 |
| J12433936+4406046 | 14.76 | 15.11 | 16.20 | AAA | 46.90 | 38.94 | 27.56 | PPP | 10.88 | 0.14 | 9.16 |
| J12525212+4645294 | 47.544.72 | 59.275.71 | 80.758.80 | AAA | 47.9110.15 | 29.37 | 50.12 | PPP | 11.14 | 1.47 | 9.47 |
| J13131429+3910360 | 23.14 | 24.15 | 67.02 | AAA | 24.10 | 33.87 | 28.42 | PPP | 11.26 | 0.68 | 9.36 |
| J13462215-0325057 | 30.104.24 | 54.455.69 | 65.607.45 | AAA | 37.54 | 27.94 | 27.52 | AAP | 10.53 | 0.16 | 8.68 |
| J14055334+6542277 | 26.074.78 | 20.03 | 31.41 | AAA | 46.59 | 26.44 | 37.84 | APP | 10.62 | 0.10 | 8.96 |
| J14064127+5043239 | 204.35 | 138.04 | 124.38 | AAA | 45.17 | 51.68 | 70.05 | AAA | 10.30 | 0.04 | 7.85 |
| J14070720-0234402 | 22.89 | 24.17 | 20.88 | AAA | 53.97 | 36.13 | 35.11 | PPP | 10.76 | 0.41 | 9.46 |
| J14250552+0313590 | 59.566.02 | 101.377.03 | 97.4414.59 | AAA | 61.359.52 | 37.927.03 | 35.97 | PPP | 10.75 | 0.58 | 9.14 |
| J15002374+4316559 | 37.397.52 | 19.763.59 | 23.67 | AAA | 32.89 | 36.62 | 45.18 | PPP | 10.88 | 0.10 | 8.82 |
| J15053183+3427526 | 13.13 | 14.13 | 12.73 | AAA | 34.70 | 33.02 | 31.14 | PPP | 11.24 | 0.43 | 9.52 |
| J15233899+3748254 | 20.50 | 18.09 | 24.72 | AAA | 38.329.46 | 36.84 | 38.41 | APP | 10.19 | 0.05 | 8.67 |
| J15264892+5915478 | 14.01 | 12.35 | 15.42 | AAA | 25.85 | 25.94 | 28.87 | PPP | 10.91 | 0.14 | 9.04 |
| J15523258+4620180 | 15.23 | 14.07 | 17.84 | AAA | 35.36 | 40.27 | 32.18 | PPP | 11.17 | 0.28 | 9.36 |
| J15562738+4757302 | 16.61 | 15.53 | 16.63 | AAA | 40.91 | 47.06 | 39.00 | AAP | 10.17 | 0.03 | 8.58 |
| J16145421+3711136 | 22.82 | 19.59 | 22.74 | AAA | 31.27 | 43.27 | 50.60 | PPP | 11.16 | 0.36 | 9.30 |
| J16354366+2630505 | 14.64 | 15.37 | 16.04 | AAA | 40.94 | 40.90 | 41.63 | PPP | 11.27 | 0.44 | 9.55 |
| J17020320+1900006 | 20.26 | 18.22 | 55.4213.02 | AAA | 28.45 | 38.78 | 31.68 | PPP | 11.00 | 0.33 | 9.25 |
| J20472428+0018030 | 61.19 | 54.39 | 61.46 | AAA | 48.59 | 51.33 | 52.71 | AAA | 10.74 | 0.05 | 8.30 |
Note. — Descriptions of Columns: (1) Galaxy ID, taken from 2MASS. (2) Herschel PACS 70m flux (mJy). (3) Herschel PACS 100m flux (mJy). (4) Herschel PACS 160m flux (mJy). (5) Herschel PACS photometric methods, ’A’: aperture, ’M’: model fitting, ’C’: compact. (6) Herschel SPIRE 250m flux (mJy). (7) Herschel SPIRE 350m flux (mJy). (8) Herschel SPIRE 500m flux (mJy). (9) Herschel SPIRE photometric methods, ’A’: aperture, ’P’: PSF fitting, ’G’: Gaussian fitting. (10) Stellar mass (log(M⊙)). (11) Star formation rate (M⊙/yr). (12) Total gas mass (log(M⊙)).
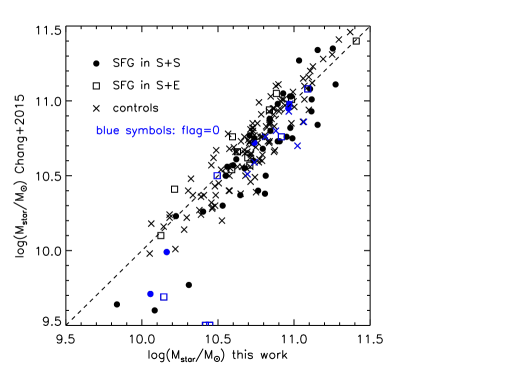
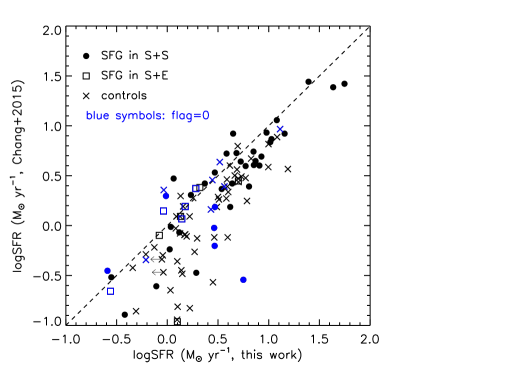
Chang et al. (2015) recently published stellar masses and SFRs for 1M galaxies from SDSSWISE, estimated based on 0.4 to 22m SEDs using MAGPHYS (da Cunha et al., 2008) energy balance SED fitting technique. 85 spirals in pairs and all 132 spirals in controls in our samples are also included in Chang et al.’s work. Comparisons on stellar masses and SFRs estimated in our work and in Chang et al. (2015) are shown in Figure 5 Figure 6, respectively.
From the comparisons, we found for most of the spirals with higher stellar masses, using 2MASS Ks band luminosities (our work) and SED model fitting (Chang et al., 2015) will results in very similar Mstar values. While only for spirals with the lowest stellar masses, Chang et al. (2015) estimated lower Mstar (0.3dex) than ours. For comparison on SFRs, Chang et al. (2015)’s values are systematically lower than ours, especially for spirals in the control sample. This may be caused by: (1) in our work, larger beams of Herschel FIR-to-submm bands resulting in more background contaminations, (2) in Chang et al. (2015), under-estimation of dust obscurations for optical-to-MIR bands using in MAGPHYS SED fittings. (3) Due to the fact that the sizes of our local paired and control galaxies are generally much larger than the PSFs of SDSS and WISE, therefore, using MODELFLUX for SDSS 5-bands and PSF model flux for WISE 4-bands (although applied a correction using Re) may still cause some flux loss in Chang et al. (2015), especially for the estimations of SFRs using WISE bands.
5. Control sample
The control sample was selected among 2MASS galaxies of redshift (from SDSS), found in four Level-5 HerMES fields: Bootes HerMES, EGS HerMES, ELAIS N1 HerMES, and Lockman SWIRE. Details of the Herschel PACS and SPIRE observations in these fields can be found in Oliver et al. (2012). Morphologies of these galaxies (S or E) were obtained from visual classifications by Galaxy Zoo (data release v1, Lintott et al. 2011). For those galaxies labeled as ’UNCERTAIN’ in the Galaxy Zoo catalog, two of us (C.C. C.K.X) visually re-classified them into S or E categories using SDSS optical images. For those galaxies with controversial classifications between us, we used an automatic classification algorithm as described in Xu et al. (2010) (ur color and R50/R90 ratio) as the third party. Then close pairs (have companions with projected distance 70kpc and dMstar 0.4 dex), peculiars (visually selected by C.C. C.K.X.), and objects at the edge of PACS or SPIRE images (with low coverage) were rejected from the sample. The resulting parent control sample was then 1-to-1 matched with H-KPAIRs. The matched control galaxies have: (1) the same morphology (S or E); (2) similar stellar mass: dex except for the match of J13082737+0422125, which is ; (3) with the closest z to that of corresponding H-KPAIR galaxy.
The Herschel PACS images at 100 160m (the 70m band was not included in the HerMES survey) and SPIRE images at 250, 350, 500m were taken from the HerMES data release (v2) for the 176 control sample galaxies. PACS SPIRE aperture photometries were made using IDL/phot and circular apertures. Fixed circular aperture sizes were used for most galaxies, with aperture radii of 12”, 18” for PACS 100 160m, 24”, 33.33”, 48” for SPIRE 250, 350, 500m, respectively. Larger apertures were used for a few extended galaxies. The background and error estimates are similar to those in the aperture photometry of H-KPAIR galaxies (Section 3). The total dust masses, SFRs and stellar masses of control sample galaxies were calculated using the same method as for the H-KPAIR galaxies (Section 4). In Table 4 we listed the galaxy ID (name), RA Dec, redshifts, the Herschel fluxes, stellar mass Mstar, the SFR, and total gas masses () of spiral galaxies in the control sample.
It should be noted in the following comparisonal analysis with the control sample, each galaxy in the pairs of our H-KPAIR sample was included independently, rather than the pair as whole, which would introduce a bias.
| (1) | (2) | (3) | (4) | (5) | (6) | (7) | (8) | (9) | (10) | (11) | (12) | (13) |
|---|---|---|---|---|---|---|---|---|---|---|---|---|
| Galaxy ID | RA | Dec | z | F100m | F160m | F250m | F350m | F500m | logMstar | SFR | log | Galaxy ID |
| (Control) | (J2000) | (J2000) | redshift | (mJy) | (mJy) | (mJy) | (mJy) | (mJy) | (logM⊙) | (M⊙/yr) | (logM⊙) | (Pair) |
| lk-096 | 164.74153 | 58.133747 | 0.0319167 | 146.437.43 | 253.139.49 | 168.3011.17 | 90.8115.02 | 65.03 | 10.58 | 0.49 | 9.61 | J00202580+0049350 |
| lk-416 | 158.55316 | 57.079830 | 0.0482240 | 113.786.87 | 244.5210.39 | 212.0316.14 | 107.1322.57 | 104.06 | 10.88 | 1.17 | 10.20 | J01183417-0013416 |
| lk-075 | 158.30994 | 56.741673 | 0.0468842 | 43.80 | 53.66 | 107.36 | 100.03 | 135.08 | 10.71 | 0.50 | 9.57 | J01183556-0013594 |
| egs-009 | 213.96425 | 51.856659 | 0.0456582 | 171.326.56 | 291.757.25 | 156.0712.94 | 79.3313.09 | 49.66 | 10.46 | 1.23 | 9.76 | J02110638-0039191 |
| en1-045 | 242.20769 | 53.997375 | 0.0627264 | 34.027.18 | 56.468.34 | 60.0710.28 | 67.36 | 58.72 | 10.58 | 0.72 | 9.59 | J02110832-0039171 |
| lk-244 | 161.47475 | 56.506535 | 0.0461360 | 83.708.18 | 161.288.62 | 112.319.62 | 49.6412.35 | 54.88 | 10.73 | 0.90 | 9.58 | J03381222+0110088 |
| lk-108 | 159.86114 | 57.662411 | 0.0719180 | 26.53 | 36.79 | 43.59 | 86.05 | 52.88 | 10.86 | 0.76 | 9.59 | J07543194+1648214 |
| lk-368 | 163.04863 | 58.438011 | 0.0315815 | 1061.6514.82 | 1822.3613.97 | 1049.9913.65 | 500.079.39 | 194.8612.86 | 11.06 | 3.29 | 10.28 | J07543221+1648349 |
| en1-016 | 242.03619 | 53.878147 | 0.0641164 | 135.566.36 | 238.767.81 | 118.1512.24 | 60.8712.12 | 90.64 | 10.69 | 1.80 | 9.92 | J08083377+3854534 |
| lk-290 | 165.13409 | 57.497932 | 0.0275216 | 26.97 | 41.11 | 53.30 | 41.20 | 84.54 | 10.18 | 0.11 | 8.91 | J08233266+2120171 |
| lk-148 | 164.15407 | 59.215527 | 0.0325229 | 40.957.85 | 114.7112.27 | 60.81 | 66.8311.68 | 64.11 | 10.38 | 0.22 | 9.09 | J08233421+2120515 |
| lk-390 | 160.60169 | 58.458820 | 0.0451383 | 25.89 | 65.228.39 | 36.63 | 55.28 | 57.79 | 10.65 | 0.28 | 9.16 | J08291491+5531227 |
| lk-248 | 162.23958 | 56.620098 | 0.0468625 | 79.007.22 | 175.5611.18 | 163.6413.32 | 102.5914.25 | 66.15 | 10.71 | 1.01 | 10.26 | J08292083+5531081 |
| lk-282 | 164.20754 | 57.412735 | 0.0468024 | 37.157.00 | 38.31 | 61.42 | 73.00 | 51.33 | 10.91 | 0.43 | 9.37 | J08364482+4722188 |
| lk-171 | 163.19229 | 60.094456 | 0.0697656 | 289.837.96 | 463.9211.13 | 279.4328.53 | 97.3720.75 | 126.28 | 11.06 | 4.95 | 10.24 | J08364588+4722100 |
| lk-405 | 159.23137 | 58.560928 | 0.0715059 | 31.49 | 78.568.87 | 54.77 | 63.28 | 55.17 | 10.71 | 0.88 | 9.66 | J08381759+3054534 |
| lk-271 | 161.58758 | 56.765396 | 0.0672263 | 142.127.21 | 177.088.76 | 145.229.67 | 89.749.71 | 53.52 | 10.94 | 3.52 | 10.32 | J08381795+3055011 |
| lk-009 | 163.78018 | 59.654129 | 0.0451426 | 858.2313.86 | 948.7217.93 | 531.3430.12 | 185.7436.85 | 156.50 | 10.81 | 5.39 | 10.03 | J08390125+3613042 |
| btsh-212 | 218.07066 | 33.590675 | 0.0847390 | 101.227.29 | 280.928.35 | 214.3512.92 | 112.6712.23 | 54.57 | 11.46 | 3.22 | 10.65 | J08414959+2642578 |
| lk-327 | 158.39201 | 57.133083 | 0.0466682 | 123.937.39 | 260.049.79 | 143.0521.06 | 112.46 | 120.05 | 10.66 | 1.34 | 9.67 | J09060498+5144071 |
| btsh-111 | 218.37558 | 34.561275 | 0.0287766 | 133.236.08 | 179.249.26 | 139.308.88 | 65.03 | 60.62 | 10.34 | 0.54 | 9.29 | J09123676+3547462 |
| egs-043 | 214.41007 | 52.693192 | 0.0631147 | 24.61 | 34.027.12 | 39.34 | 47.90 | 56.15 | 10.97 | 0.54 | 9.45 | J09134606+4742001 |
| lk-276 | 162.26814 | 56.911495 | 0.0718246 | 25.25 | 35.21 | 57.5513.64 | 88.9011.89 | 83.9816.52 | 10.73 | 0.72 | 9.69 | J09155467+4419510 |
| btsh-146 | 218.82675 | 35.118813 | 0.0284341 | 5395.3635.44 | 5274.4252.53 | 1902.3532.67 | 725.9433.25 | 254.4224.96 | 11.02 | 12.96 | 10.05 | J09155552+4419580 |
| lk-056 | 161.98213 | 57.188320 | 0.0898139 | 26.02 | 45.15 | 42.39 | 48.52 | 58.04 | 11.00 | 1.20 | 9.76 | J09264111+0447247 |
| lk-175 | 158.62358 | 59.784828 | 0.0905889 | 122.4315.91 | 109.5123.54 | 153.4224.42 | 111.2323.32 | 138.69 | 11.37 | 5.27 | 10.78 | J09264137+0447260 |
| en1-018 | 242.25880 | 53.743439 | 0.0643115 | 43.307.09 | 44.969.26 | 76.72 | 54.51 | 73.00 | 11.12 | 0.96 | 9.70 | J09374413+0245394 |
| en1-048 | 242.60513 | 53.779949 | 0.0658474 | 148.856.95 | 251.719.55 | 197.2917.72 | 107.1216.14 | 58.32 | 10.79 | 3.87 | 10.42 | J10100079+5440198 |
| lk-150 | 164.46387 | 59.365425 | 0.0461592 | 786.0311.98 | 863.6721.83 | 423.9619.93 | 200.2221.31 | 103.25 | 10.77 | 6.11 | 10.01 | J10100212+5440279 |
| lk-256 | 162.47282 | 56.647766 | 0.0459531 | 103.976.84 | 181.7410.33 | 112.729.52 | 51.0610.78 | 59.50 | 10.48 | 0.75 | 9.64 | J10155257+0657330 |
| btsh-148 | 218.99033 | 35.172455 | 0.0540843 | 74.9811.19 | 120.8311.79 | 85.8311.99 | 61.30 | 53.69 | 10.52 | 1.12 | 9.60 | J10205188+4831096 |
| lk-323 | 158.20479 | 56.945797 | 0.0569093 | 54.04 | 122.4915.06 | 105.94 | 122.96 | 111.23 | 10.61 | 0.91 | 9.72 | J10225647+3446564 |
| lk-155 | 158.16884 | 58.766632 | 0.0735668 | 28.58 | 40.19 | 57.93 | 62.76 | 55.66 | 10.93 | 0.86 | 9.71 | J10225655+3446468 |
| lk-014 | 161.36885 | 59.496750 | 0.0724664 | 42.327.49 | 97.269.76 | 75.358.81 | 54.8912.54 | 65.91 | 10.75 | 1.25 | 10.17 | J10233658+4220477 |
| lk-259 | 163.53919 | 56.821007 | 0.0464892 | 444.336.80 | 545.1410.77 | 293.3513.75 | 132.0216.50 | 62.0212.72 | 10.65 | 4.87 | 9.98 | J10233684+4221037 |
| lk-049 | 158.95834 | 56.568207 | 0.0437173 | 88.817.24 | 213.979.91 | 133.3017.40 | 99.0518.54 | 88.23 | 10.50 | 0.64 | 9.95 | J10272950+0114490 |
| lk-203 | 162.58281 | 56.347740 | 0.0683074 | 32.69 | 56.7012.84 | 104.4723.80 | 83.0813.14 | 50.25 | 10.92 | 0.83 | 9.86 | J10325316+5306536 |
| lk-082 | 159.70738 | 57.004242 | 0.0725609 | 100.167.13 | 145.679.50 | 74.338.73 | 57.07 | 66.15 | 11.07 | 2.74 | 9.79 | J10332972+4404342 |
| en1-046 | 242.37892 | 53.863384 | 0.0623371 | 92.447.53 | 150.819.32 | 109.83 | 63.50 | 88.18 | 10.84 | 1.84 | 9.81 | J10333162+4404212 |
| lk-311 | 163.57295 | 57.726276 | 0.0751972 | 30.52 | 102.6110.27 | 109.4112.00 | 74.6216.78 | 58.9214.05 | 10.85 | 1.21 | 10.75 | J10364274+5447356 |
| lk-048 | 158.79388 | 56.524883 | 0.0648007 | 35.42 | 46.16 | 97.36 | 135.89 | 100.23 | 10.72 | 0.80 | 9.79 | J10392338+3904501 |
| lk-210 | 164.78847 | 56.918480 | 0.0467608 | 116.479.11 | 125.7111.82 | 104.1210.38 | 59.94 | 56.94 | 10.46 | 1.27 | 9.56 | J10435053+0645466 |
| lk-006 | 161.48135 | 59.154591 | 0.0443921 | 115.517.66 | 144.939.13 | 140.1321.92 | 97.9423.19 | 71.20 | 10.46 | 1.26 | 10.04 | J10435268+0645256 |
| lk-294 | 158.20099 | 56.595795 | 0.0468146 | 125.2813.13 | 136.4823.07 | 129.0624.26 | 125.81 | 133.61 | 10.72 | 1.36 | 9.64 | J10452478+3910298 |
| lk-355 | 159.07225 | 57.611805 | 0.0734656 | 52.547.38 | 93.059.02 | 70.37 | 47.40 | 54.86 | 10.71 | 1.52 | 9.78 | J10514450+5101303 |
| egs-017 | 213.85736 | 52.332111 | 0.0738315 | 22.04 | 30.92 | 44.65 | 41.72 | 61.61 | 10.84 | 0.67 | 9.62 | J10595915+0857357 |
| lk-217 | 164.84148 | 56.605415 | 0.0478231 | 437.1115.59 | 288.9120.60 | 180.9617.65 | 79.1216.90 | 84.74 | 10.53 | 5.01 | 9.53 | J11014364+5720336 |
| lk-379 | 159.88892 | 58.362122 | 0.0711125 | 59.997.35 | 47.988.99 | 78.01 | 72.30 | 51.81 | 10.99 | 1.61 | 9.79 | J11064944+4751119 |
| lk-357 | 159.91113 | 57.933495 | 0.0743553 | 32.79 | 61.948.95 | 96.2910.65 | 60.1912.21 | 62.1411.12 | 11.12 | 0.76 | 10.73 | J11065068+4751090 |
| lk-030 | 162.42171 | 60.293438 | 0.0444752 | 130.947.59 | 231.7812.74 | 192.1412.74 | 118.2913.71 | 59.04 | 10.56 | 1.50 | 10.24 | J11204657+0028142 |
| lk-273 | 161.65997 | 56.893730 | 0.0739821 | 28.15 | 41.51 | 39.40 | 70.40 | 62.29 | 10.74 | 0.85 | 9.57 | J11204801+0028068 |
| lk-235 | 163.38641 | 56.303272 | 0.0719963 | 66.31 | 78.02 | 53.87 | 54.18 | 63.11 | 10.63 | 1.82 | 9.66 | J11251704+0227007 |
| lk-403 | 159.10716 | 58.556229 | 0.0271570 | 448.1714.58 | 844.3319.78 | 562.0034.14 | 335.3544.40 | 223.4932.19 | 10.88 | 1.87 | 10.33 | J11251716+0226488 |
| (1) | (2) | (3) | (4) | (5) | (6) | (7) | (8) | (9) | (10) | (11) | (12) | (13) |
|---|---|---|---|---|---|---|---|---|---|---|---|---|
| Galaxy ID | RA | Dec | z | F100m | F160m | F250m | F350m | F500m | logMstar | SFR | log | Galaxy ID |
| (Control) | (J2000) | (J2000) | redshift | (mJy) | (mJy) | (mJy) | (mJy) | (mJy) | (logM⊙) | (M⊙/yr) | (logM⊙) | (Pair) |
| lk-200 | 162.21944 | 56.336193 | 0.0457280 | 272.888.58 | 445.6612.10 | 232.1510.65 | 120.4813.54 | 64.9913.83 | 10.77 | 1.86 | 9.94 | J11273289+3604168 |
| lk-411 | 164.21436 | 59.534958 | 0.0564417 | 271.469.06 | 394.7015.80 | 233.7420.27 | 136.1825.48 | 104.61 | 11.10 | 3.99 | 10.19 | J11273467+3603470 |
| egs-005 | 213.76653 | 52.056580 | 0.0730016 | 140.236.04 | 237.957.26 | 124.579.91 | 54.80 | 64.39 | 10.76 | 3.82 | 9.98 | J11375801+4728143 |
| egs-064 | 215.64249 | 53.585861 | 0.0391728 | 23.97 | 26.64 | 65.0314.33 | 67.5314.67 | 56.35 | 10.30 | 0.20 | 9.25 | J11440433+3332339 |
| lk-143 | 161.00293 | 58.760281 | 0.0727644 | 409.637.16 | 501.079.47 | 266.599.86 | 128.548.99 | 54.95 | 10.84 | 9.91 | 10.25 | J11484370+3547002 |
| lk-054 | 160.78687 | 56.820522 | 0.0669273 | 52.306.56 | 79.2010.29 | 42.519.46 | 41.99 | 61.66 | 11.25 | 1.25 | 9.52 | J11484525+3547092 |
| lk-257 | 162.54466 | 56.727203 | 0.0480569 | 29.786.97 | 82.689.78 | 52.06 | 56.41 | 38.82 | 10.76 | 0.37 | 9.33 | J11501333+3746107 |
| lk-196 | 161.76175 | 56.254833 | 0.0460456 | 47.678.59 | 48.78 | 46.06 | 40.77 | 72.34 | 10.87 | 0.52 | 9.25 | J11501399+3746306 |
| en1-024 | 242.69853 | 53.422432 | 0.0630939 | 63.4214.58 | 116.8126.63 | 51.28 | 49.94 | 41.89 | 10.78 | 1.32 | 9.54 | J11505764+1444200 |
| lk-396 | 164.28052 | 59.031815 | 0.0738622 | 81.368.56 | 143.3610.04 | 122.0011.69 | 82.8914.02 | 77.19 | 10.87 | 3.08 | 10.57 | J11542299+4932509 |
| lk-267 | 161.13715 | 56.678345 | 0.0671536 | 493.377.34 | 454.3110.58 | 224.429.07 | 97.7014.05 | 49.95 | 10.79 | 12.11 | 9.99 | J12020424+5342317 |
| lk-306 | 162.71820 | 57.585117 | 0.0268691 | 188.756.88 | 194.899.89 | 116.8912.05 | 69.839.63 | 53.31 | 10.29 | 0.69 | 9.21 | J12054066+0135365 |
| egs-050 | 216.14351 | 53.639969 | 0.0305066 | 556.265.28 | 635.537.29 | 289.9914.49 | 133.6713.69 | 67.75 | 10.48 | 1.35 | 9.48 | J12115507+4039182 |
| egs-066 | 215.92018 | 53.915695 | 0.0337332 | 158.616.09 | 297.188.51 | 184.6916.18 | 113.6816.65 | 56.01 | 10.46 | 0.61 | 9.73 | J12115648+4039184 |
| lk-007 | 162.01831 | 59.344875 | 0.0285956 | 35.207.66 | 38.28 | 73.25 | 112.69 | 97.98 | 10.18 | 0.15 | 9.06 | J12191866+1201054 |
| lk-334 | 160.10893 | 57.439854 | 0.0471860 | 156.156.90 | 200.269.94 | 118.3213.26 | 64.1312.23 | 51.23 | 10.78 | 1.84 | 9.73 | J12433887+4405399 |
| lk-406 | 159.30702 | 58.571445 | 0.0710580 | 29.39 | 72.438.91 | 77.49 | 70.40 | 64.35 | 10.97 | 0.82 | 9.78 | J12525011+4645272 |
| lk-079 | 158.74356 | 56.912376 | 0.0467561 | 50.868.57 | 83.899.61 | 86.29 | 74.66 | 110.59 | 10.41 | 0.58 | 9.49 | J13011662+4803366 |
| en1-015 | 241.90225 | 53.958252 | 0.0297046 | 500.8810.97 | 563.4214.85 | 262.9719.24 | 107.8024.03 | 89.74 | 10.39 | 1.33 | 9.37 | J13011835+4803304 |
| lk-242 | 160.95529 | 56.281364 | 0.0240286 | 162.876.55 | 107.8710.17 | 71.1613.78 | 51.34 | 57.17 | 9.71 | 0.46 | 8.92 | J13082737+0422125 |
| lk-015 | 161.59250 | 59.595676 | 0.0309583 | 26.33 | 87.379.83 | 63.95 | 54.83 | 54.81 | 10.28 | 0.13 | 9.07 | J13082964+0422045 |
| btsh-094 | 216.88402 | 34.510860 | 0.0684431 | 56.617.59 | 144.6910.43 | 118.5913.21 | 78.8019.06 | 68.62 | 10.83 | 1.41 | 9.91 | J13131470+3910382 |
| en1-003 | 240.67156 | 54.337185 | 0.0653331 | 42.65 | 58.05 | 53.20 | 58.65 | 74.50 | 10.69 | 0.98 | 9.58 | J13151386+4424264 |
| btsh-049 | 218.32701 | 34.734619 | 0.0343026 | 160.076.58 | 259.888.81 | 142.839.14 | 70.3511.08 | 55.22 | 10.97 | 0.62 | 9.46 | J13151726+4424255 |
| lk-035 | 159.37373 | 60.002872 | 0.0281504 | 657.9130.36 | 1118.7739.53 | 552.6131.50 | 261.2335.17 | 179.53 | 10.71 | 1.66 | 9.89 | J13153076+6207447 |
| egs-040 | 214.24640 | 52.730427 | 0.0742157 | 18.28 | 24.81 | 43.90 | 60.95 | 57.34 | 10.84 | 0.57 | 9.61 | J13153506+6207287 |
| lk-332 | 159.63516 | 57.400383 | 0.0470770 | 132.217.70 | 101.679.57 | 85.5513.16 | 65.46 | 53.79 | 10.67 | 1.45 | 9.49 | J13325525-0301347 |
| lk-279 | 163.63444 | 57.159027 | 0.0676157 | 170.727.05 | 132.5610.32 | 69.3014.74 | 69.46 | 64.70 | 10.81 | 3.92 | 9.70 | J13325655-0301395 |
| lk-127 | 161.54971 | 58.449306 | 0.0496845 | 81.776.99 | 126.449.94 | 96.088.88 | 63.099.53 | 59.96 | 10.72 | 1.19 | 10.02 | J13462001-0325407 |
| btsh-063 | 217.60631 | 35.321106 | 0.0104899 | 7971.5034.10 | 10153.5049.49 | 4483.1551.59 | 2000.9840.83 | 778.1150.94 | 10.69 | 2.69 | 9.80 | J14003661-0254327 |
| lk-078 | 158.71724 | 56.837643 | 0.0438288 | 112.757.45 | 134.459.45 | 104.6219.58 | 72.55 | 73.73 | 10.62 | 1.07 | 9.51 | J14003796-0254227 |
| btsh-123 | 217.08795 | 35.405602 | 0.0292952 | 271.5813.39 | 417.5412.38 | 285.3416.88 | 143.7117.97 | 84.96 | 10.73 | 1.06 | 9.76 | J14005783+4251203 |
| lk-338 | 160.79364 | 57.647472 | 0.0467886 | 161.477.16 | 237.079.62 | 165.9810.06 | 66.6613.05 | 90.31 | 10.57 | 1.46 | 9.79 | J14005879+4250427 |
| lk-130 | 163.01991 | 58.599899 | 0.0317531 | 54.196.54 | 54.178.89 | 85.589.70 | 64.2012.10 | 50.77 | 10.32 | 0.34 | 9.78 | J14055079+6542598 |
| lk-409 | 161.11449 | 58.903076 | 0.0312686 | 185.497.64 | 266.4910.36 | 177.819.91 | 93.5414.95 | 55.48 | 10.15 | 0.92 | 9.65 | J14062157+5043303 |
| lk-170 | 161.25214 | 59.736507 | 0.0443880 | 74.046.60 | 130.728.45 | 93.149.62 | 60.19 | 55.10 | 10.91 | 0.74 | 9.48 | J14070703-0234513 |
| lk-119 | 159.54161 | 58.017307 | 0.0237380 | 77.946.04 | 153.6610.70 | 97.0311.75 | 76.1717.04 | 68.58 | 10.05 | 0.15 | 9.25 | J14234238+3400324 |
| btsh-004 | 217.07809 | 34.284489 | 0.0333809 | 178.357.68 | 213.489.38 | 134.037.29 | 72.169.97 | 54.91 | 10.06 | 1.15 | 9.51 | J14234632+3401012 |
| lk-270 | 161.44302 | 56.836800 | 0.0726175 | 27.74 | 40.26 | 46.23 | 57.17 | 65.56 | 10.82 | 0.81 | 9.62 | J14245831-0303597 |
| lk-140 | 159.77400 | 58.361572 | 0.0733310 | 60.417.80 | 186.0511.47 | 140.7010.95 | 72.1911.29 | 53.95 | 11.07 | 1.67 | 10.37 | J14245913-0304012 |
| lk-321 | 158.19514 | 57.005798 | 0.0435024 | 95.407.95 | 185.5310.26 | 163.27 | 116.77 | 120.75 | 10.39 | 0.90 | 9.67 | J14250739+0313560 |
| lk-383 | 160.20712 | 58.256981 | 0.0744073 | 30.14 | 39.98 | 57.00 | 72.24 | 58.32 | 10.87 | 0.92 | 9.71 | J14294766+3534275 |
| lk-221 | 164.12077 | 56.910526 | 0.0469288 | 33.467.51 | 129.719.38 | 95.8010.13 | 53.62 | 93.02 | 10.57 | 0.39 | 9.53 | J14295031+3534122 |
| lk-245 | 161.70120 | 56.567902 | 0.0449944 | 49.807.16 | 82.0510.14 | 65.799.69 | 53.06 | 48.52 | 10.85 | 0.52 | 9.36 | J14334683+4004512 |
| lk-115 | 161.89583 | 58.101940 | 0.0742169 | 33.16 | 41.34 | 74.73 | 70.31 | 57.00 | 10.86 | 1.01 | 9.81 | J14334840+4005392 |
| lk-055 | 161.28499 | 56.976227 | 0.0722381 | 175.596.84 | 211.699.60 | 114.397.90 | 50.18 | 83.80 | 10.71 | 4.63 | 9.94 | J14442055+1207429 |
| egs-006 | 213.82188 | 51.831017 | 0.0745795 | 46.675.32 | 54.837.23 | 72.3710.70 | 94.89 | 61.91 | 11.06 | 1.41 | 9.80 | J14442079+1207552 |
| btsh-110 | 217.33472 | 34.753334 | 0.0688272 | 63.966.98 | 78.009.44 | 79.168.47 | 45.69 | 64.54 | 10.68 | 1.60 | 9.77 | J15002500+4317131 |
| lk-156 | 158.50607 | 58.807034 | 0.0739712 | 31.01 | 41.82 | 49.94 | 48.82 | 72.75 | 10.94 | 0.94 | 9.66 | J15053137+3427534 |
| lk-392 | 161.18837 | 58.454979 | 0.0313002 | 711.5815.32 | 1074.6219.74 | 690.0022.86 | 386.1225.36 | 193.3124.17 | 10.84 | 3.94 | 10.37 | J15064391+0346364 |
| btsh-200 | 217.19626 | 33.387711 | 0.0424442 | 817.9619.21 | 767.7821.78 | 376.059.11 | 159.5612.17 | 46.2010.36 | 10.77 | 5.92 | 9.78 | J15064579+0346214 |
| btsh-102 | 218.83510 | 33.846039 | 0.0581498 | 168.616.19 | 209.078.98 | 127.3714.89 | 67.0816.65 | 54.1913.48 | 10.68 | 2.82 | 9.80 | J15101587+5810425 |
| lk-365 | 162.09343 | 58.195721 | 0.0465291 | 37.227.18 | 138.019.67 | 89.7315.62 | 48.2310.88 | 58.27 | 10.49 | 0.45 | 9.90 | J15101776+5810375 |
| (1) | (2) | (3) | (4) | (5) | (6) | (7) | (8) | (9) | (10) | (11) | (12) | (13) |
|---|---|---|---|---|---|---|---|---|---|---|---|---|
| Galaxy ID | RA | Dec | z | F100m | F160m | F250m | F350m | F500m | logMstar | SFR | log | Galaxy ID |
| (Control) | (J2000) | (J2000) | redshift | (mJy) | (mJy) | (mJy) | (mJy) | (mJy) | (logM⊙) | (M⊙/yr) | (logM⊙) | (Pair) |
| egs-044 | 214.52928 | 52.697277 | 0.0659781 | 61.255.59 | 95.408.69 | 47.40 | 50.54 | 63.38 | 10.73 | 1.40 | 9.55 | J15144544+0403587 |
| lk-169 | 159.02901 | 59.379044 | 0.0732209 | 104.477.13 | 168.328.29 | 80.0713.21 | 51.76 | 60.20 | 10.67 | 2.91 | 9.82 | J15144697+0403576 |
| btsh-050 | 218.26311 | 34.744881 | 0.0296272 | 75.028.03 | 187.0810.74 | 190.837.02 | 113.0214.13 | 54.1611.13 | 10.14 | 0.40 | 9.97 | J15233768+3749030 |
| lk-091 | 163.20827 | 57.747452 | 0.0730649 | 175.227.75 | 151.409.59 | 77.319.95 | 51.2511.66 | 36.18 | 10.70 | 5.03 | 9.61 | J15264774+5915464 |
| lk-106 | 159.34660 | 57.520683 | 0.0718920 | 397.727.14 | 376.1810.43 | 168.5216.53 | 64.12 | 61.08 | 10.87 | 9.96 | 10.07 | J15281276+4255474 |
| lk-164 | 163.10425 | 59.685532 | 0.0277227 | 1146.7312.16 | 1605.0117.47 | 875.3519.63 | 416.5335.14 | 132.2226.56 | 10.74 | 2.78 | 9.99 | J15281667+4256384 |
| lk-269 | 161.45438 | 56.701805 | 0.0672907 | 57.406.92 | 103.008.95 | 48.5410.61 | 54.29 | 58.99 | 10.84 | 1.38 | 9.57 | J15523393+4620237 |
| lk-146 | 162.65512 | 59.095657 | 0.0323721 | 290.867.64 | 259.0010.45 | 145.6613.88 | 64.38 | 61.28 | 10.22 | 1.43 | 9.40 | J15562191+4757172 |
| lk-040 | 162.04411 | 56.704330 | 0.0477595 | 74.636.81 | 125.2610.66 | 74.897.77 | 37.45 | 47.58 | 10.48 | 0.87 | 9.46 | J15583749+3227379 |
| lk-028 | 161.42595 | 60.067890 | 0.0719979 | 53.207.18 | 103.0711.01 | 71.9610.60 | 53.86 | 68.80 | 10.79 | 1.48 | 9.77 | J15583784+3227471 |
| egs-026 | 213.78456 | 51.613804 | 0.0742349 | 244.4110.83 | 287.8512.13 | 127.7714.48 | 71.02 | 62.44 | 10.75 | 6.71 | 10.00 | J16024254+4111499 |
| lk-224 | 165.37244 | 57.117775 | 0.0451835 | 303.197.74 | 467.5312.26 | 229.459.54 | 108.689.88 | 60.84 | 10.58 | 1.97 | 9.84 | J16024475+4111589 |
| lk-366 | 162.32683 | 58.345104 | 0.0280867 | 78.438.30 | 237.339.72 | 215.2510.28 | 112.6313.33 | 87.83 | 10.81 | 0.32 | 9.87 | J16080559+2529091 |
| lk-281 | 164.13226 | 57.347748 | 0.0675492 | 51.077.74 | 127.739.47 | 120.3712.37 | 65.8613.76 | 75.45 | 11.11 | 1.06 | 10.31 | J16080648+2529066 |
| btsh-028 | 218.14639 | 34.364929 | 0.0422711 | 30.396.33 | 68.868.07 | 57.419.14 | 53.69 | 70.53 | 10.47 | 0.29 | 9.27 | J16082261+2328459 |
| lk-345 | 162.32899 | 57.821774 | 0.0702557 | 128.207.22 | 176.909.49 | 66.9613.36 | 68.14 | 53.16 | 10.57 | 3.23 | 9.72 | J16082354+2328240 |
| lk-387 | 160.41603 | 58.317230 | 0.0722775 | 65.576.61 | 96.2610.94 | 84.7512.78 | 63.62 | 61.34 | 11.10 | 1.82 | 9.83 | J16145418+3711064 |
| lk-243 | 161.15924 | 56.369724 | 0.0240542 | 1293.3311.99 | 1304.8716.83 | 588.2321.66 | 286.6821.50 | 135.42 | 10.81 | 3.66 | 9.63 | J16282497+4110064 |
| lk-139 | 159.74431 | 58.376003 | 0.0679610 | 172.977.39 | 165.399.12 | 84.4810.98 | 62.3312.82 | 97.77 | 10.74 | 4.14 | 9.73 | J16282756+4109395 |
| lk-278 | 163.33688 | 57.242729 | 0.0802541 | 75.466.70 | 91.488.92 | 53.0613.16 | 71.33 | 54.35 | 11.19 | 2.60 | 9.75 | J16354293+2630494 |
| egs-038 | 213.91566 | 52.543880 | 0.0737351 | 61.645.41 | 143.097.66 | 164.1811.88 | 66.5314.99 | 48.53 | 11.29 | 2.04 | 10.52 | J16372583+4650161 |
| lk-227 | 162.26764 | 56.223995 | 0.0719589 | 549.858.26 | 538.5311.64 | 269.8810.05 | 115.6712.98 | 61.8710.89 | 10.90 | 15.46 | 10.19 | J16372754+4650054 |
| en1-041 | 241.28255 | 54.887733 | 0.0632211 | 27.27 | 45.90 | 58.7814.37 | 54.11 | 113.47 | 10.60 | 0.60 | 9.59 | J17020378+1859495 |
| lk-122 | 160.10104 | 58.155136 | 0.0720025 | 174.476.81 | 321.3510.52 | 175.959.86 | 73.9015.11 | 55.78 | 10.72 | 3.16 | 10.17 | J17045089+3448530 |
| lk-376 | 159.78526 | 58.231022 | 0.0729322 | 57.367.32 | 45.37 | 83.038.45 | 68.12 | 66.86 | 10.90 | 1.63 | 9.83 | J17045097+3449020 |
| lk-240 | 160.43297 | 56.250572 | 0.0704346 | 58.856.97 | 80.129.71 | 64.4011.86 | 43.86 | 55.05 | 10.98 | 1.55 | 9.71 | J20471908+0019150 |
Note. — Descriptions of Columns: (1) Control Galaxy ID. (2) Control Galaxy RA (deg, J2000). (3) Control Galaxy Dec (deg, J2000). (4) Control Galaxy redshift z taken from SDSS. (5) Herschel PACS 100m flux (mJy). (6) Herschel PACS 160m flux (mJy). (7) Herschel SPIRE 250m flux (mJy). (8) Herschel SPIRE 350m flux (mJy). (9) Herschel SPIRE 500m flux (mJy). (10) Stellar mass (log(M⊙)). (11) Star formation rate (M⊙/yr). (12) Total gas mass (log(M⊙)). (13) ID of matched H-KPAIR galaxy.
6. Specific Star Formation Rate Enhancement
Figure 7 is a scatter plot for the relation between Mstar and the sSFR for spirals in H-KPAIR and in the control sample. The maximum likelihood Kaplan-Meier (K-M) estimator (Kaplan & Meier (1958), see also Xu et al. (1998)), which exploits information in the upper-limits, was used to calculate the means of the sSFR of different populations. For spirals in H-KPAIR the mean is , and for spirals in the control sample it is nearly identical: . However, detailed inspections of Figure 7 reveal a mismatch between the H-KPAIR and the control sample: while none of the control galaxies has a value or upper-limit of below , many H-KPAIR spirals have their values/upper-limits below this threshold. This is due to the fact that control galaxies are more distant (median ) than H-KPAIR galaxies (median ), and their Herschel observations in the HerMES Level-5 survey (Oliver et al., 2012) are shallower than our H-KPAIR observations. Therefore their upper-limits are in general significantly higher than those of H-KPAIR galaxies, and none of them was detected below . This mismatch can bias the mean of the control sample toward higher value even though the K-M estimator is used, for the algorithm requires that the detections cover the entire data range and the detections and upper-limits are well mixed (Feigelson & Nelson, 1985). In order to confirm that this is indeed the case, the following test was carried out: a hybrid sample was constructed by replacing in the control sample those galaxies matching to the low sSFR H-KPAIR galaxies ( values/upper-limits below -11.3) by the H-KPAIR galaxies themselves. Using again the K-M estimator, we found a mean for such a sample, significantly lower than the result for the control sample. The implicit assumption in this test is that below the control and H-KPAIR samples have nearly identical sSFR distributions, which is reasonable if the red spirals with low sSFR are similar to early type galaxies that show no interaction induced star formation enhancement (Sulentic, 1989).
In Figure 7 we plotted the lines representing the blue sequence and the red sequence, taken from Figure 7 of Schiminovich et al. (2007), where it also shows that galaxies with belong to the red sequence.
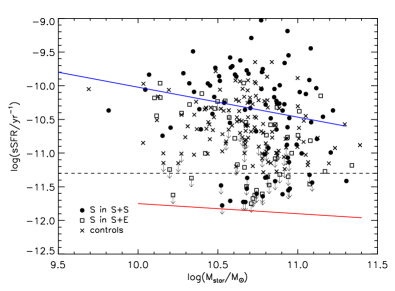
In order to minimize the bias due to the mismatch, we confined the star formation enhancement analysis to H-KPAIR galaxies with values/upper-limits of and the control galaxies matched to them. Among these 101 paired SFG galaxies, the sSFR of 5 galaxies are upper-limits; for their matches in the control sample, 19 have the sSFR in upper-limits. It is possible that the true values of some of the upper-limits are below the cutoff. However, they are only small fractions of both samples. Furthermore, because in the K-S estimator the probability distribution of the true values of the upper-limits are estimated using data points included in the analysis (none of them is below the cutoff), the possible contamination by low sSFR red spirals should not affect significantly the mean sSFR of SFGs in both H-KPAIR and control samples.
We found a mean of for SFGs in the H-KPAIR, and for their matches in the control sample. The corresponding sSFR enhancement (Xu et al., 2010) is . This indicates that the sSFR of paired SFGs is enhanced on average by a factor of compared to control galaxies, and the enhancement is significant at level. When paired SFGs are divided into subsamples of galaxies in SS pairs and in SE pairs, we found a mean of for the SS subsample and for the SE subsample. This shows that SFGs in SS pairs have strong sSFR enhancement (with ) and those in SE have no significant sSFR enhancement. The result is in very good agreement with that of (Xu et al., 2010) based on Spitzer observations of a smaller subsample of KPAIR. We further divided the SS and SE subsamples by the interaction morphology (INT/MER vs JUS), and found that the mean values for SFGs in SS pairs of INT/MER types and of JUS type are and , respectively. This suggests that SFGs in SS pairs of INT and MER types are slightly more enhanced (by 0.17 dex) than those in JUS pairs, though the significance of the difference is only at level. No significant sSFR enhancement is found for SFGs in SE pairs of either the INT/MER types (mean ) or the JUS type (mean ).
In Figure 8 we compared the sSFR of SFGs in SS pairs and SE pairs with the controls in four bins (log(Mstar/M⊙) 10.4, 10.4 log(Mstar/M⊙) 10.7, and 10.7 log(Mstar/M⊙). For SFGs in SS pairs we found a similar amount of sSFR enhancement in different bins. For SFGs in SE pairs no significant sSFR enhancement is found in any bin. It is worth noting that Xu et al. (2010) found that SFGs in SS pairs in their lowest bin (corresponding to for the calibration used in this paper) do not show any significant sSFR enhancement. These low mass galaxies are not included in H-KPAIR because of the exclusion of pairs of .

7. Star Formation Efficiency Enhancement
The total gas mass () can be estimated from according James et al. (2002): , where Z is the metallicity in solar units, e 0.456 the fraction of metals incorporated in dust in the ISM, and f 0.019 the metal mass fraction in gas of solar metallicity. Draine et al. (2007) found a very similar gas-to-dust ratio (/ 100) for SINGS galaxies, including interacting galaxies. Studies on gas-to-dust mass ratios in local galaxies (e.g., Rémy-Ruyer et al. 2014) show that for metal rich galaxies the ratios are uniformally distributed, and only very metal poor galaxies have significantly higher / ratios. In the local universe, only low mass galaxies have such low metalicities (Tremonti et al., 2004). All SFGs in H-KPAIR have , and the control galaxies are 1-to-1 matched to paired galaxies according to . Therefore we adopted a fixed gas-to-dust ratio of 100 for the conversion from to . Using the K-M estimator, we found that means of of SFGs in SS pairs, in SE pairs, and in the control sample are , , and , respectively. For both SFGs in SS pairs and in SE pairs, the mean differs from that of control galaxies only at level. In Figure 9 the means of of different samples in different mass bins are compared. No clear trend is found in the plot.
The SFE is defined as the ratio between the SFR and total gas mass: . The SFE analysis was confined to SFGs with detections. The means of of SFGs in SS pairs, in SE pairs, and in the control sample are found to be , , and , respectively. Figure 10 shows that the means of of SFGs in SS pairs are consistently above that of control galaxies at a 0.4 dex level in all mass bins. On the other hand, the means of of SFGs in SE pairs are seen both above and below that of control galaxies, consistent with no significant SFE enhancement.
In Figure 11 we plotted the mean against the gas fraction for the SS pair and control samples. Within the range of covered by SFGs in our samples, which is [0,0.25], there is no significant dependence of the SFE enhancement on . Taken at the face value, this does not confirm the results of theoretical simulations showing weaker merger-induced star formation enhancement for high (Hopkins et al., 2009; Perret et al., 2014; Scudder et al., 2015). However, it appears that the effect of on star formation enhancement is significant only when (Scudder et al., 2015), which is beyond the range covered by our samples.


| (1) | (2) | (3) | 4 |
|---|---|---|---|
| Type | sSFR enhancement | SFE enhancement | |
| (dex) | (dex) | (dex) | |
| S in SS | 0.460.08 | 0.410.07 | 0.070.06 |
| S in SE | 0.030.08 | 0.110.07 | 0.08 |
Note. — Mean values of sSFR & SFE enhancements (dex) and of the difference in , for SFGs in SS SE pairs.
8. Discussion
8.1. AGNs in H-KPAIR
In the H-KPAIR sample, some spiral galaxies are classified as Active Galactic Nuclei (AGNs) based on their optical spectra. J083645884722100, J112517160226488, J114845253547092, J131513864424264, J133256550301395, J142346323401012, J142947663534275, J152812764255474, J204719080019150 are sub-classified (SUBCLASS) as AGN or AGN Broadline in SDSS archive (using line ratios). J091346064742001 and J131517264424255 are classified as AGN in “Quasars and Active Galactic Nuclei” (13th Ed.) (Véron-Cetty & Véron, 2010). J134620010325407 is classified as Sy2 in Véron-Cetty & Véron (2010).
Identification of AGN has been successful through the use of WISE photometry (Jarrett et al., 2011; Stern et al., 2012; Mateos et al., 2012; Secrest et al., 2015). To apply the corresponding AGN color criteria of Mateos et al. (2012), the W1, W2 and W3 magnitudes are taken from the unWISE forced photometry catalog (Lang et al., 2014; Lang, 2014). The catalog apertures are chosen from SDSS photometry and are held constant for each identified object across the three WISE bands. The forced photometry should be sufficient to measure the magnitude differences W1-W2 and W2-W3 for the placement of the H-KPAIRs in the WISE color-color diagram. A comparison to manual aperture photometry is examined in Domingue et al. (2015, in prep.). From the full set of spirals in the H-KPAIRs, only J13151726+4424255 falls within the color-color diagram area associated with AGN in Mateos et al. (2012) and therefore this may be our only AGN candidate in addition to the optically determined AGNs. More details on discussions on WISE AGNs will be in Domingue et al. (2015, in prep.).
Lam et al. (2013) found that the FIR/sub-mm properties of galaxies with AGNs are similar to those of star-forming galaxies, and the AGN contribution to the FIR/sub-mm luminosity is in general insignificant. Even in the MIR band where the AGN contribution is much stronger, Nordon et al. (2012) found that only in two out of 18 AGN-hosting galaxies the emission is significantly enhanced by the AGN. Therefore, different from Xu et al. (2010), we choose to keep the AGN candidates in our analyses. Indeed we found that keeping or removing AGN candidates will not affect the major results of this paper.
8.2. Why is SFR enhancement absent in S+E pairs?
The significant sSFR enhancements of SFGs in SS pairs found in Xu et al. (2010) and in this work are due to a significant SFE enhancement in them, while they have the same mean gas content as the control galaxies. On the other hand, the lack of sSFR enhancement in SFGs in SE pairs can not be attributed to a deficiency of gas content, as speculated by Xu et al. (2010), but to a significantly lower SFE than that of SFGS in SS pairs (Table 5). It is difficult to understand the SFE difference between SFGs in SS pairs and those in SE pairs, if the enhancement is triggered by tidal effects (the tidal effects caused by a spiral companion and by a elliptical companion should be similar). It has been suggested that cloud-cloud collisions (Scoville et al., 1986; Tan et al., 2006) or cloud-squeezing by shock-heated diffuse gas in two colliding disks (Jog & Solomon, 1992; Saitoh et al., 2009; Hayward et al., 2014; Renaud et al., 2015) can trigger starbursts. Our results indicate that these mechanisms, associated with the collision between the ISM in two gas rich galaxies (which is absent in S+E pairs), may indeed be the major mode for the SFR enhancement in paired SFGs (mostly early stage mergers). Hwang et al. (2011) also found in the GOODS-Herschel fields, the SFR and sSFR increase as a late-type galaxy approaches a late-type neighbor (SS pairs), while the SFR and sSFR decrease or do not change much as the galaxy approaches an early-type neighbor (SE pairs). They argued for X-rays from the Ellipticals as the reason for the suppression of star formations in the spirals in SE pairs.
8.3. Separation and SFR Enhancement
In Section 5.7 of Xu et al. (2010), they discussed how the star formation enhancement is related to the projected separation between the two galaxies in pairs. Here we made a similar analysis using the normalized separation parameter: SEP s (r1r2) . Here s is the projected separation, and r1 and r2 are the K-band Kron radii (taken from 2MASS) of the primary and the secondary, respectively, in the same units as those of s (arcsec). Figures 12 and 13 are plots of mean log(SFR/Mstar) and log(SFR/Mgas) vs. log(Mstar) of star-forming spirals (SFGs) in SS pairs, separated into two subsamples of SEP ¡ 1 (39 SFGs) and SEP ¿ 1 (30 SFGs). Similar to Xu et al. (2010), we found for both subsamples, the log(SFR/Mstar) and log(SFR/Mgas) vs. log(Mstar) relations scatter around the means of the total sample without any obvious trend, and no significant differences between the two subsamples are detected. This confirms Xu et al. (2010)’s finding and suggests that, for early stage mergers in H-KPAIR, the separation is not an important parameter any more once the two galaxies are close enough. This is different from FIR selected late stage mergers for which Gao & Solomon (1999) found an anti-correlation between SFE and the pair separation.


8.4. ”Holmberg effect”
Figure 14 shows a correlation between the sSFR of primary galaxies and that of secondary galaxies in SS pairs with the Spearman’s rank correlation coefficient equal to 0.56, while for corresponding control galaxies there is no such correlation. This reconfirms the ”Holmberg effect” on the sSFR previously found by Xu et al. (2010) using Spitzer observations of a small subsample of KPAIR.

9. Summary future plan
In this paper we present Herschel observations for a large and complete sample of close major-merger pairs of galaxies selected from a 2MASS/SDSS-DR5 cross-match. The H-KPAIR sample includes 176 galaxies (132 spirals and 44 ellipticals) in 88 pairs (44 SS and 44 SE). Herschel maps, in the three PACS bands at 70, 100 and 160 and the three SPIRE bands at 250, 350 and 500 , show very diversified FIR-submm emission properties among H-KPAIR galaxies. The SFR (estimated using the IR luminosity), the sSFR, the total gas mass (estimated using the SED fitting resulted dust mass), and the SFE of the spiral galaxies in H-KPAIR are compared to those of single spirals in a control sample in order to study the interaction-induced enhancement. The control sample is selected from 2MASS galaxies with Herschel data obtained in HerMES Level-5 surveys. In order to minimize a bias due to different depths of the Herschel data of H-KPAIR and of the control sample, the enhancement analyses are confined to SFGs with . The following results are found:
-
(1) The mean of the SFGs in in SS pairs is significantly higher than that of the SFGs in the control sample, but that of SFGs in the SE pairs is not. The sSFR enhancement level for SFGs in SS pairs is 0.5 dex. This result is in very good agreement with Xu et al. (2010).
-
(2) SFGs in SS pairs of INT and MER types have enhancement of log(sSFR) (by 0.17 dex) above those in JUS pairs, though the significance of the difference is only at level. No significant sSFR enhancement is found for SFGs in SE pairs of either the INT/MER types or the JUS type .
-
(3) There is no significant difference among the means of of SFGs in SS pairs, in SE pairs, and in the control sample.
-
(4) The mean of the SFGs in SS pairs is higher than that of the SFGs in SE pairs and in the control sample. This indicates that star formation triggered by disc-disc collision may play an important role in the interaction-induced star formation activity.
-
(5) There is no dependence of the SFE enhancement on the gas fraction, fgas, in the range of fgas of our sample ().
In future works we will study the atomic and molecular gas contents in H-KPAIR galaxies using GBT HI and IRAM-30m CO observations (Lisenfeld et al., in preparatio). Using WISE mid-infrared images, we will analyze the PAH properties and AGN activities of paired galaxies (Domingue et al., in preparation). Analysis on the stellar populations and metallicity gradients in paired galaxies and detailed studies on SFGs in SE pairs will be carried out by using optical spectroscopic observations with the 2.16m telescope of National Astronomical Observatory of China (NAOC), and narrow-band Hα imaging observations with the 2.4m telescope of Yunnan Astronomical Observatory.
Acknowledgments: We thank the anonymous referee for helpful comments and suggestions. We acknowledge useful discussions with Dr. Yinghe Zhao, and thank Dr. Yuyen Chang for the help on data tables of 1M galaxies from SDSSWISE. C.C. and Y.G. are supported by NSFC-11503013, NSFC-11420101002, NSFC-10978014, NSFC-11173059, NSFC-11390373, and CAS-XDB09000000. UL acknowledges support by the research projects AYA2011-24728 and AYA2014-53506-P from the Spanish Ministerio de Economía y Competividad and the Junta de Andalucía (Spain). The Herschel spacecraft was designed, built, tested, and launched under a contract to ESA managed by the Herschel/Planck Project team by an industrial consortium under the overall responsibility of the prime contractor Thales Alenia Space (Cannes), and including Astrium (Friedrichshafen) responsible for the payload module and for system testing at spacecraft level, Thales Alenia Space (Turin) responsible for the service module, and Astrium (Toulouse) responsible for the telescope, with in excess of a hundred subcontractors. HCSS / HSpot / HIPE is a joint development (are joint developments) by the Herschel Science Ground Segment Consortium, consisting of ESA, the NASA Herschel Science Center, and the HIFI, PACS and SPIRE consortia. This research has made use of the NASA/IPAC Extragalactic Database (NED), which is operated by the Jet Propulsion Laboratory, California Institute of Technology, under contract with the National Aeronautics and Space Administration.
References
- Alonso et al. (2004) Alonso, M. S., Tissera, T. B., Coldwell, G., et al. 2004, MNRAS, 352, 1081
- Bahcall et al. (1995) Bahcall, J. N., et al. 1995, ApJ, 450, 486
- Barton et al. (2000) Barton, E. J., Geller, M. J., & Kenyon, S. J. 2000, ApJ, 530, 660
- Bergvall et al. (2003) Bergvall, N., Laurikainen, E., & Aalto, S. 2003, A&A, 405, 31
- Buat & Xu (1996) Buat, V., & Xu, C. 1996, A&A, 306, 677
- Bushouse et al. (1988) Bushouse, H., Lamb, S., & Werner, M. 1988, ApJ, 335, 74
- Calzetti (2013) Calzetti, D. 2013, Star Formation Rate Indicators, ed. J. Falcón-Barroso & J. H. Knapen, 419
- Chang et al. (2015) Chang, Y.-Y., van der Wel, A., da Cunha, E., & Rix, H.-W. 2015, ApJS, 219, 8, 1506.00648
- da Cunha et al. (2008) da Cunha, E., Charlot, S., & Elbaz, D. 2008, MNRAS, 388, 1595, 0806.1020
- Dale et al. (2012) Dale, D. A., Aniano, G., Engelbracht, C. W., et al. 2012, ApJ, 745, 95
- Dale et al. (2005) Dale, D. A. et al. 2005, ApJ, 633, 857, astro-ph/0507645
- Dasyra et al. (2006) Dasyra, K. M., Tacconi, L. J., Davies, R. I., et al. 2006, ApJ, 638, 745, astro-ph/0510670
- Domingue et al. (2003) Domingue, D. L., Sulentic, J. W., Xu, C., et al. 2003, AJ, 125, 555
- Domingue et al. (2009) Domingue, D. L., Xu, C. K., et al. 2009, ApJ, 695, 1559
- Draine et al. (2007) Draine, B. T. et al. 2007, ApJ, 663, 866, astro-ph/0703213
- Draine & Li (2007) Draine, B. T., & Li, A. 2007, ApJ, 657, 810, astro-ph/0608003
- Dunne & Eales (2001) Dunne, L., & Eales, S. A. 2001, MNRAS, 327, 697, astro-ph/0106362
- Ellison et al. (2008) Ellison, S. L., Patton, D. R., Simard, L., et al. 2008, AJ, 135, 1877
- Erwin (2014) Erwin, P. 2014, ArXiv e-prints, 1408.1097
- Feigelson & Nelson (1985) Feigelson, E. D., & Nelson, P. I. 1985, ApJ, 293, 192
- Gao & Solomon (1999) Gao, Y., & Solomon, P. M. 1999, ApJ, 512, L99, astro-ph/9812320
- Griffin et al. (2010) Griffin, M. J., Abergel, A., Abreu, A., et al. 2010, A&A, 518, L3
- Haynes & Herter (1988) Haynes, M., & Herter, T. 1988, AJ, 96, 504
- Hayward et al. (2014) Hayward, C. C. et al. 2014, MNRAS, 445, 1598, 1402.0006
- Hopkins et al. (2006) Hopkins, P. F., Hernquist, L., Cox, T. J., Di Matteo, T., Robertson, B., & Springel, V. 2006, ApJS, 163, 1, astro-ph/0506398
- Hopkins et al. (2009) Hopkins, P. F., et al. 2009, ApJ, 691, 1186
- Hwang et al. (2011) Hwang, H. S., Elbaz, D., Dickinson, M., et al. 2011, A&A, 535, 60
- James et al. (2002) James, A., Dunne, L., Eales, S., & Edmunds, M. G. 2002, MNRAS, 335, 753, astro-ph/0204519
- Jarrett et al. (2011) Jarrett, T. H. et al. 2011, ApJ, 735, 112
- Jog & Solomon (1992) Jog, C. J., & Solomon, P. M. 1992, ApJ, 387, 152
- Kaplan & Meier (1958) Kaplan, E. L., & Meier, P. 1958, J. Am. Statistical Association, 53, 457
- Kauffmann et al. (2003) Kauffmann, G., et al. 2003, MNRAS, 341, 33
- Kennicutt (1996) Kennicutt, R. C. 1996, in Saas-Fee Advanced Course, Vol. 26, Galaxies: Interactions and Induced Star Formation, ed. D. Friedli, L. Martinet, & D. Pfenniger (Berlin and Heidelberg: Springer-Verlag), 1
- Kennicutt (1998) Kennicutt, R. C. 1998, ARA&A, 36, 189
- Kennicutt et al. (1987) Kennicutt, R. C., Keel, W., van der Hulst, J., et al. 1987, AJ, 93, 1001
- Kormendy & Kennicutt (2004) Kormendy, J., & Kennicutt, R. C. 2004, ARA&A, 42, 603
- Lam et al. (2013) Lam, M. I., Wu, H., Zhu, Y.-N., & Zhou, Z.-M. 2013, Research in Astronomy and Astrophysics, 13, 179, 1301.4001
- Lambas et al. (2003) Lambas, D. G., Tissera, P. B., et al. 2003, MNRAS, 346, 1189
- Lang (2014) Lang, D. 2014, AJ, 147, 108, 1405.0308
- Lang et al. (2014) Lang, D., Hogg, D. W., & Schlegel, D. J. 2014, ArXiv e-prints, 1410.7397
- Lanz et al. (2013) Lanz, L. et al. 2013, ApJ, 768, 90, 1302.5011
- Larson & Tinsley (1978) Larson, R. B., & Tinsley, B. M. 1978, ApJ, 219, 46
- Li et al. (2008) Li, C., et al. 2008, MNRAS, 385, 1903
- Lintott et al. (2011) Lintott, C. et al. 2011, MNRAS, 410, 166, 1007.3265
- Mateos et al. (2012) Mateos, S. et al. 2012, MNRAS, 426, 3271, 1208.2530
- Mihos & Hernquist (1996) Mihos, J. C., & Hernquist, L. 1996, ApJ, 464, 641, astro-ph/9512099
- MOON & YOON (2015) MOON, J.-S., & YOON, S.-J. 2015, Publication of Korean Astronomical Society, 30, 469
- Nikolic et al. (2004) Nikolic, B., Cullen, H., & Alexander, P. 2004, MNRAS, 355, 874
- Nordon et al. (2012) Nordon, R. et al. 2012, ApJ, 745, 182, 1106.1186
- Oliver et al. (2012) Oliver, S., Bock, J., Altieri, B., et al. 2012, MNRAS, 424, 1614
- Ott (2010) Ott, S. 2010, in Astronomical Society of the Pacific Conference Series, Vol. 434, Astronomical Data Analysis Software and Systems XIX, ed. Y. Mizumoto, K.-I. Morita, & M. Ohishi, 139, 1011.1209
- Park & Choi (2005) Park, C., & Choi, Y.-Y. 2005, ApJ, 635, L29, astro-ph/0511385
- Park & Choi (2009) ——. 2009, ApJ, 691, 1828, 0809.2156
- Park et al. (2008) Park, C., Gott, III, J. R., & Choi, Y.-Y. 2008, ApJ, 674, 784, 0708.4118
- Patton et al. (2013) Patton, D. R., Torrey, P., Ellison, S. L., et al. 2013, MNRAS, 433, L59, 1305.1595
- Perret et al. (2014) Perret, V., Renaud, F., Epinat, B., Amram, P., Bournaud, F., Contini, T., Teyssier, R., & Lambert, J.-C. 2014, A&A, 562, A1, 1307.7130
- Poglitsch et al. (2010) Poglitsch, A. et al. 2010, A&A, 518, L2, 1005.1487
- Rémy-Ruyer et al. (2014) Rémy-Ruyer, A. et al. 2014, A&A, 563, A31, 1312.3442
- Renaud et al. (2015) Renaud, F., Bournaud, F., & Duc, P.-A. 2015, MNRAS, 446, 2038, 1410.5754
- Saitoh et al. (2009) Saitoh, T. R., Daisaka, H., Kokubo, E., Makino, J., Okamoto, T., Tomisaka, K., Wada, K., & Yoshida, N. 2009, PASJ, 61, 481, 0805.0167
- Schiminovich et al. (2007) Schiminovich, D. et al. 2007, ApJS, 173, 315, 0711.4823
- Scoville et al. (1986) Scoville, N. Z., Sanders, D. B., & Clemens, D. P. 1986, ApJ, 310, L77
- Scoville et al. (2007) Scoville, N. Z., et al. 2007, ApJS, 172, 1
- Scudder et al. (2015) Scudder, J. M., Ellison, S. L., Momjian, E., Rosenberg, J. L., Torrey, P., Patton, D. R., Fertig, D., & Mendel, J. T. 2015, MNRAS, 449, 3719, 1503.05194
- Scudder et al. (2012) Scudder, J. M., Ellison, S. L., Torrey, P., Patton, D. R., & Mendel, J. T. 2012, MNRAS, 426, 549, 1207.4791
- Secrest et al. (2015) Secrest, N., Dudik, R., Dorland, B., Zacharias, N., Makarov, V., Fey, A., Frouard, J., & Finch, C. 2015, ArXiv e-prints, 1509.07289
- Stern et al. (2012) Stern, D. et al. 2012, ApJ, 753, 30, 1205.0811
- Sulentic (1989) Sulentic, J. 1989, AJ, 98, 2006
- Surace et al. (1998) Surace, J. A., Sanders, D. B., Vacca, W. D., et al. 1998, ApJ, 492, 116
- Tan et al. (2006) Tan, J. C., Krumholz, M. R., & McKee, C. F. 2006, ApJ, 641, L121, astro-ph/0603278
- Telesco et al. (1988) Telesco, C., et al. 1988, ApJ, 329, 174
- Toomre & Toomre (1972) Toomre, A., & Toomre, M. 1972, ApJ, 178, 623
- Traficante et al. (2011) Traficante, A. et al. 2011, MNRAS, 416, 2932, 1106.0698
- Tremonti et al. (2004) Tremonti, C. A. et al. 2004, ApJ, 613, 898, astro-ph/0405537
- Véron-Cetty & Véron (2010) Véron-Cetty, M.-P., & Véron, P. 2010, A&A, 518, A10
- Woods & Geller (2007) Woods, D. F., & Geller, M. J. 2007, AJ, 134, 527
- Xu et al. (1998) Xu, C. et al. 1998, ApJ, 508, 576, astro-ph/9806194
- Xu & Sulentic (1991) Xu, C., & Sulentic, J. W. 1991, ApJ, 374, 407
- Xu et al. (2010) Xu, C. K., Domingue, D., Cheng, Y., et al. 2010, ApJ, 713, 330
- Xu et al. (2012a) Xu, C. K., Shupe, D. L., Béthermin, M., et al. 2012a, ApJ, 760, 72, 1210.2362
- Xu et al. (2004) Xu, C. K., Sun, Y. C., & He, X. T. 2004, ApJ, 603, L73
- Xu et al. (2012b) Xu, C. K., Zhao, Y., Scoville, N., et al. 2012b, ApJ, 747, 85, 1109.3693
- Yuan et al. (2012) Yuan, F.-T., Takeuchi, T. T., Matsuoka, Y., Buat, V., Burgarella, D., & Iglesias-Páramo, J. 2012, A&A, 548, A117, 1212.1956