A New Perspective of the Radio Bright Zone at The Galactic Center: Feedback from Nuclear Activities
Abstract
New observations of Sgr A have been carried out with the Jansky VLA in the B and C arrays using the broadband (2 GHz) continuum mode at 5.5 GHz. The field of view covers the central 13′ (30 pc) region of the radio-bright zone at the Galactic center. Using the multi-scale and multi-frequency-synthesis (MS-MFS) algorithms in CASA, we have imaged Sgr A with a resolution of 1″, achieving an rms noise of 8 Jy beam-1, and a dynamic range of 100,000:1. Both previously known and newly identified radio features in this region are revealed, including numerous filamentary sources. The radio continuum image is compared with Chandra X-ray images, with a CN emission-line image obtained with the SMA and with detailed Paschen- images obtained with HST/NICMOS. We discuss several prominent features in the radio image. The “Sgr A West Wings” extend 2′ (5 pc) from the NW and SE tips of the Sgr A West HII region (the ”Mini-spiral”) to positions located 2.9 and 2.4 arc min to the northwest and southeast of Sgr A*, respectively. The NW wing, along with several other prominent features, including the previously identified “NW Streamers”, form an elongated radio lobe (NW lobe), oriented nearly perpendicular to the Galactic plane. This radio lobe, with a size of 6.3′3.2′ (14.4 pc7.3 pc), has a known X-ray counterpart. In the outer region of the NW lobe, a row of three thermally emitting rings is observed. A field containing numerous amorphous radio blobs extends for a distance of 2 arc min beyond the tip of the SE wing; these newly recognized features coincide with the SE X-ray lobe. Most of the amorphous radio blobs in the NW and SE lobes have Paschen- counterparts. We propose that they have been produced by shock interaction of ambient gas concentrations with a collimated nuclear wind or an outflow that originated from within the circumnuclear disk (CND). We also discuss the possibility that the ionized wind or outflow has been launched by radiation force produced by the central star cluster. Finally, we remark on the detailed structure of a prominent radio emission feature located within the shell of the Sgr A East supernova remnant. Because this feature – the “Sigma Front” – correlates well in shape and orientation with the nearby edge of the CND, we propose that it is a reflected shock wave resulting from the impact of the Sgr A East blast wave on the CND.
Subject headings:
Galaxy: center — ISM: individual objects (Sagittarius A) — ISM: supernova remnants — ISM: outflows — ISM: H II regions — radio continuum: ISM1. Introduction
The prominent ray structures of 10 kpc scale, referred to as the Fermi bubbles (Su et al., 2010), are likely evidence of past AGN or starburst activity at the Galactic Center. Recent radio observations of the two giant, linearly polarized radio lobes with the Parkes telescope (Carretti et al., 2013) also show evidence of large scale manifestations of activity at the Galactic Center. The origin of the Fermi bubbles with a luminosity of erg s-1 and a total energy budget of 1055 erg has been discussed and reviewed by Ponti et al. (2013). Although Sgr A* is presently in an extremely sub-Eddington accretion state, it can apparently undergo dramatic increases in its luminosity (Ponti et al., 2013), thereby powering large-scale structures centered on it.
These features may well originate from a starburst phase in the Galactic center within the past few million years (Su et al., 2010) or to an intense AGN phase on the same time scale, with Sgr A* accreting near its Eddington limit (Zubovas et al., 2011). Whatever the mechanism for producing the Fermi bubbles, the inferred energy injection rate is consistent with the IR luminosity and -ray flux emerging from the central molecular zone (CMZ) (Crocker et al., 2011).
Within the inner 40 parsecs (17′), a remarkable bipolar X-ray lobe structure (10 pc) has been revealed in deep Chandra X-ray images (Baganoff et al., 2003; Morris et al., 2003); these lobes are aligned with the Fermi bubbles, but on an angular scale that is 200 times smaller than that of the bubbles. Morris et al. (2003) point out that a number of X-ray clumps detected in the bipolar lobes suggest a series of recurrent ejections from within the circumnuclear disk (CND), occurring on time scales of hundreds to thousands of years, depending on the velocities of the emitting clumps.
Although it has not been clear how the Fermi-bubbles can be related to past AGN and starburst activities in the Galactic center, the current activities from massive star formation produce significant feedback to the ISM in the central 40 parsecs via stellar winds as well as an intense UV radiation field originating from massive stars and supernova (SN). The SN of Sgr A East alone produces an output energy of 1052-53 erg (Mezger, et al., 1989; Mezger et al., 1996), substantially impacting the interstellar medium near Sgr A*, although the nature, location and environment of Sgr A East have not been fully determined. At 90 cm, the appearance of the Sgr A West Mini-spiral features in absorption against Sgr A East, conclusively shows that the former structure is situated in front of or is mixed with Sgr A East (Pedlar et al., 1989; Goss et al., 1989). Based on the kinematics of maser spots associated with the SNR (Yusef-Zadeh et al., 1999), the Sgr A East SN is located at a distance 5 pc from Sgr A*. If the central cluster with an IR luminosity of 4 L⊙ provides the heating of the SN dust in Sgr A East (Lau et al., 2015), best-fit models show the distance between the dust and Sgr A* to vary between 3.6 to 7.3 pc depending on the relevant physical parameters used in the model of Lau et al. (2015). The development and expansion of the Sgr A East shell (SNR) appear to be in a non-uniform density medium given the fact that a complex distribution of the +50 km s-1 GMC, dense molecular clumps in the CND and velocity shears have been observed in the Galactic center. Interactions between the molecular clouds with the Sgr A East SNR (Ekers et al., 1983; Serabyn et al., 1992) along with the presence of velocity shears (Uchida et al., 1998, e.g.) have been thought to be the cause of the apparent shape of the SNR shell that appears to be elongated in the Galactic longitude.
In this paper, in section 2 we summarize the setup of the Jansky Very Large Array (JVLA) observations. In section 3, we describe the new results conerning the central 13′, the radio bright zone (hereafter, RBZ) at the Galactic center region at 5.5 GHz. This description follows the radio detection of the Cannonball from the new 2 GHz-bandwidth images that has been reported earlier (Zhao, Morris & Goss, 2013). In section 4, the astrophysical implications of the radio observations are discussed.
| Observing date | Array | Calibrators | ||
|---|---|---|---|---|
| GHz | GHz | |||
| 2012-03-29 | C | 5.5 | 2 | J1331+3030 (DB) |
| J17331304 (CG) | ||||
| J1331+3030 (FD) | ||||
| 2012-04-22 | C | 5.5 | 2 | J0319+4130 (DB) |
| J17331304 (CG) | ||||
| J0137+3309 (FD) | ||||
| 2012-07-24 | B | 5.5 | 2 | J1331+3030 (DB) |
| J17331304 (CG) | ||||
| J1331+3030 (FD) | ||||
| 2012-07-27 | B | 5.5 | 2 | J0319+4130 (DB) |
| J17331304 (CG) | ||||
| J0137+3309 (FD) |
| For all the four epoch observations, the target field was centered at °00′17″.97, and the default correlator setup (subbandschannels=161024) for broadband continnum observations is used. The calibrator codes stand for delay & bandpass (DB), complex gain (CG) and flux density (FD) scale, respectively. |
2. Observations
The JVLA observations of the Galactic center at 6 cm were carried out on March 29, April 22, July 24 and July 27 of 2012 in the C and B configurations, positioned near the geometrical center of the Sgr A East shell, offset by (35″, 10″) from Sgr A*. Observations in each array configuration were scheduled with two four-hour observing blocks to cover a complete eight-hour uv-track with two separate observing dates. A standard continuum observing mode having a total bandwidth of 2 GHz in 16 subbands of 64 channels each was used for all four epochs of observations. The spectral resolution of each subband was 2 MHz. Table 1 summarizes the log of the JVLA observing program AZ198 or 12A-037. The details of the data reduction for broadband imaging are discussed in Appendix A.

Owing to the dramatic recent improvements in the Very Large Array, including hardware and software, we have obtained much deeper images than have heretofore been possible, achieving a dynamic range of 100,000:1.
3. Radio Bright Zone at the Galactic center
The new 2-GHz broadband images at 5.5 GHz reveal additional fine structure and faint sources in the RBZ, compared to our previous VLA images (Zhao et al., 2009) as well as those of many other investigators, e.g. (Ekers et al., 1983; Lo & Claussen, 1983; Ho et al., 1985; Yusef-Zadeh & Morris, 1987; Pedlar et al., 1989). In Zhao, Morris & Goss (2013), we have presented preliminary results of these new observations in a publication describing the radio counterpart of the X-ray “Cannonball”, a pulsar wind nebula surrounding the neutron star that was apparently launched in the explosion that created the Sgr A East supernova remnant. In addition, these data were used to report our imaging of the radio filaments (Northern Filaments) of the NuSTAR source G359.97-0.038 (Nynka et al., 2015).
3.1. Overall Radio Structure
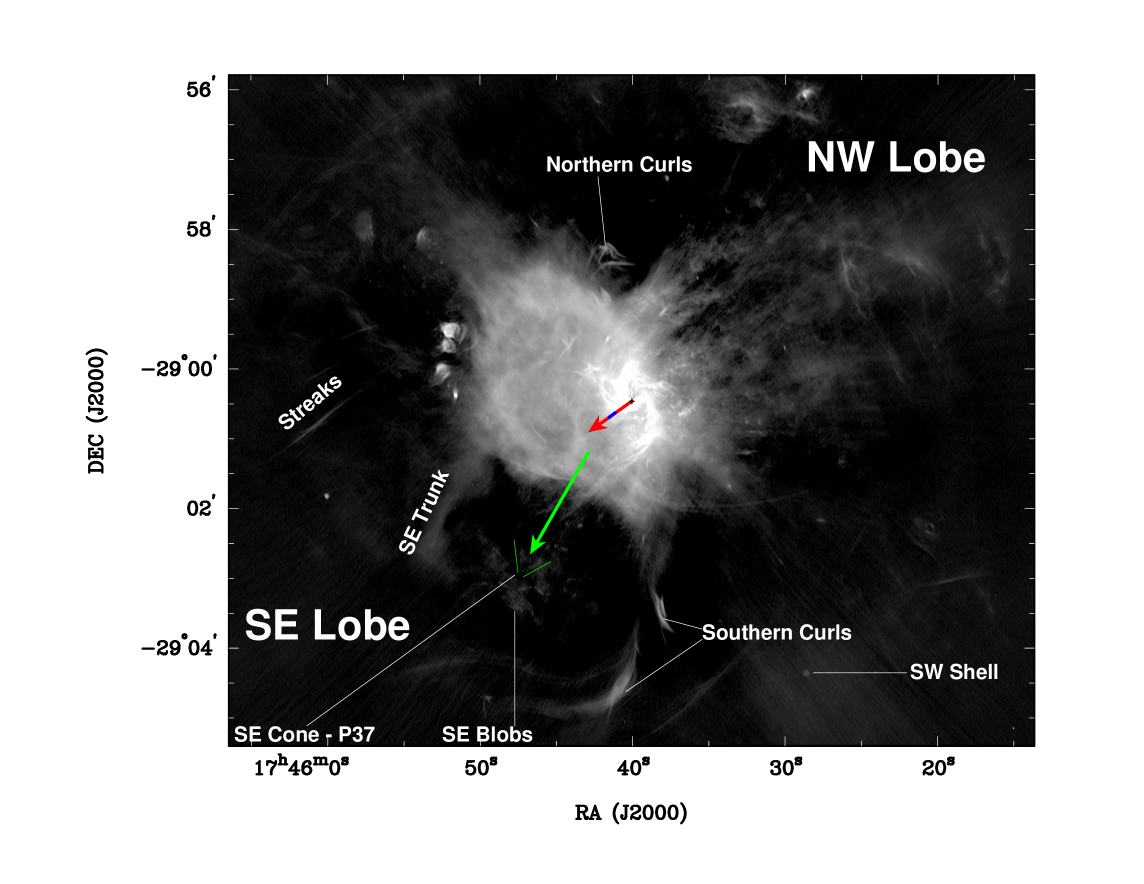
Fig. 1 shows the overall structure of the radio emission from the Sgr A Complex (Pedlar et al., 1989) observed at 5.5 GHz. In addition to the well-known sources such as Sgr A*, Sgr A West and Sgr A East (Ekers et al., 1983), the continuum image contains many prominent features, showing the details of the complex filamentary structure. As many as 129 compact radio sources outside of Sgr A East have been detected at 6 cm with peak flux densities ranging between 5 and 0.06 mJy beam-1 (8) (ZMG 2015 in preparation).

Within the shell of Sgr A East and the region near Sgr A*, numerous filamentary features are revealed in great detail. Their properties and astrophysical implications will be discussed in subsequent papers.
3.2. Extended Wings of the Mini-spiral
Bright thermal emission from Sgr A West – the “Mini-spiral” HII structure – dominates the 5.5 GHz image. As has been well established, e.g. (Morris & Serabyn, 1996), Sgr A West has three bright components lying inside the CND – the Northern Arm, Eastern Arm and the Bar – and its free-free emission also outlines the inner ionized edge of the CND, particularly toward the West, where it manifests as the Western Arc (see, e.g., Fig. 3). Yusef-Zadeh & Morris (1987), also observing with the VLA at 6 cm, noted that emission from the arms of Sgr A West extends out of the interior of the CND forming radio “streamers” oriented perpendicular to the Galactic plane (see their Figs. 4 & 5).
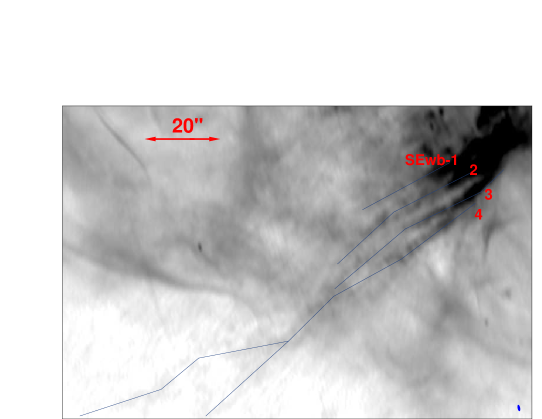
These extended emission features are particularly well characterized in our image (Figs. 2, 3, 5, and 6). They appear to be, in projection, continuations of the Mini-spiral arms, stretching linearly up to 3′ (7 pc in projection) along a position angle oriented at about +10 degrees in projection relative to the Galaxy’s rotation axis, or about +20 degrees relative to the normal to the CND (Güsten et al., 1987; Jackson et al., 1993; Zhao et al., 2010). We hereafter refer to these emission structures as the “NW and SE Wings”. The SE Wing (Fig. 2, bottom-left) appears to split into several branches. We identify four of them (SEb1-4), each of which is indicated by line segments in Fig. 2. The peak intensity of the SE wing branches is several mJy beam-1. They are slightly resolved, with a typical width of 2″. The length of SE wing branches ranges from 0.5′ to 2′. The longest one (SEb-4) appears to bifurcate further into two sub-branches in the middle, crossing the boundary of the Sgr A East shell. The bundle of SE wing filaments is clearly present in absorption at 90 cm against the Sgr A East shell (Pedlar et al., 1989; Goss et al., 1989), indicating that the SE Wing becomes optically thick at the lower frequency and is situated in front of, or is spatially mixed with, the Sgr A East shell. In addition, in the region around the SE Wing, a few compact radio components were detected. The radio properties of these sources are summarized in Table 2.
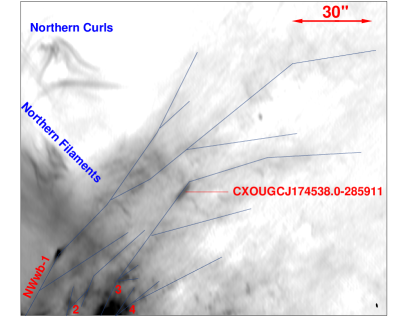
The bottom image in Fig. 2 (left for SE and right for NW) shows the region containing the NW Wing, which appears to split into more branches than the SE Wing. Four of them, with emission intensity similar to that of the SE Wing, are labelled. The lengths of the NW wing branches range from ′ (NWb-2) to 3′ (NWb-1), and they appear to bifurcate to more sub-branches with increasing distance from Sgr A West. The radio properties of NW wing branches are summarized in Table 2.
Yusef-Zadeh & Morris (1987) and Pedlar et al. (1989) pointed out the presence of an extended ionized halo around Sgr A East and West having a 90 cm optical depth of (or an emission measure of pc cm-6). Both the SE and NW wing features are present as features in the map of the optical-depth distribution across Sgr A East derived from VLA 6 and 90 cm data, c.f., Fig. 10 of Pedlar et al. (1989), indicating that the emission at 90 cm is attenuated by the ionized gas in Sgr A West. From the 90 cm optical depth, and using the angular width of a typical wing branch (), the electron density in the wing can be inferred to be
The electron density of the ionized gas in the wings therefore appears to be 1-2 orders of magnitude smaller than the high-density ionized clumps observed in Sgr A West (Zhao et al., 2010).


3.3. Sigma Front – a rebound shock from the CND?
Fig. 3 shows a detailed comparison between our 6 cm continuum images and CN line emission from the CND observed by Martín et al. (2012) with the Submillimeter Array (SMA). The CND surrounds the Sgr A West minispiral; the shell of the mixed-morphology supernova remnant, Sgr A East, appears to encircle both the CND and Sgr A West, although the western edge of Sgr A East is ill-defined behind the bright emission from Sgr A West. We fit an ellipse to the 150 (Jy) contour around the Sgr A East shell. The best fit yields a size of 3.3′ 2.3′ (7.8pc 5.5pc) (P.A.=35°) and places the apparent center at an offset of = from Sgr A*. Our results appear to be in good agreement with an earlier Sgr A East size determination of (P.A.40°) from lower resolution data (Pedlar et al., 1989).
That Sgr A East lies behind Sgr A West has been well established (Yusef-Zadeh & Morris, 1987; Pedlar et al., 1989), but there has been considerable discussion about their line-of-sight separation. A few groups have offered evidence that the Sgr A East blast wave has already passed over at least part of Sgr A West (Herrnstein & Ho, 2005; Rockefeller et al., 2005), and Morris & Serabyn (1996) had previously pointed out that the large-scale asymmetry of the CND could perhaps be attributed to the impact of the blast wave. The northeastern portion of the CND, which is closest to the centroid of Sgr A East, is truncated relative to the near-side southwestern portion.
Our images reveal another feature that could have resulted from the interaction of Sgr A East with the CND. Located 1′ southeast of Sgr A* or 0.6′ beyond the southeast boundary of the CND, there appears a emission feature crossing the middle of the Sgr A East shell at a mean , with P.A. °(Fig. 3). This radio feature, to which we hereafter refer as the “Sigma Front”, can be characterized as four linear segments, each about 0.5′ in length with a typical surface brightness of 1.5 mJy beam-1. As summarized in Table 2, the total length and total flux density of the Sigma Front are 2′ and 0.3 Jy, respectively. We also point out that the two “”-shaped structures of the Sigma Front bear some correspondence to the shape of the SE edge of the CND. More precisely, they are concave toward the most prominent CN-emitting clumps located northeast and south of Sgr A* (see Fig. 3). The Sigma Front is also clearly present in earlier VLA images obtained at 90, 20 and 6 cm with lower angular resolution, see Figs. 3, 4, 5 and 6 of Pedlar et al. (1989). Those authors also notice that this feature is visible on 90 and 20 cm crosscuts (their Fig. 7).
3.4. Bipolar Structure
Fig. 4 shows the radio contours overlaid on the Chandra X-ray image integrated over 1 Msec (Markoff, 2010), illustrating the bipolar X-ray lobes found in the Chandra broad-band X-ray image (3.3-4.7 KeV) by Baganoff et al. (2003) and Morris et al. (2003). The latter authors point out that the soft X-ray bipolar lobes are best seen in a map showing the ratio of soft to hard X-rays and remark that the shape of the diffuse synchrotron emission observed with the VLA at 90 cm (Pedlar et al., 1989; Nord et al., 2004) matches the X-ray structure quite well. Here, we compare the deep 5.5-GHz JVLA image with the Chandra image and with HST/NICMOS imaging of the Paschen- emission to investigate the physical characteristics and the origin of the bipolar lobes. We note that the 5.5 GHz JVLA image presented here is best suited for showing the fine structure of radio emission while the diffuse emission structure as observed on larger scales at 90 cm (′) is not well sampled in the current C+B array observations.
| Comp. | , | ,,PA | ||
|---|---|---|---|---|
| (1) | (2) | (3) | (4) | (5) |
| SE Wing | ||||
| SEwb-1 | … | 7.71.0 | –37.5,–46.0 | 25,2, –62 |
| SEwb-2 | … | 6.90.9 | –43.5,–48.2 | 45,2, –56 |
| SEwb-3 | … | 5.00.7 | –51.1,–46.9 | 56,2, –56 |
| SEwb-4 | … | 3.30.4 | –43.9,–56.3 | 124,2, –60 |
| NW Wing | ||||
| NWwb-1 | … | 3.50.6 | –3,20 | 171,2,–50 |
| NWwb-2 | … | 3.20.5 | –20,20 | 45,2,–35 |
| NWwb-3 | … | 9.61.5 | –31,20 | 129,2,–57 |
| NWwb-4 | … | 8.51.4 | –35,20 | 48,2,–59 |
| Sigma Front | ||||
| Sf-1 | 0.090.01 | 0.940.15 | 26.3, 10.6 | 30,6, –16 |
| Sf-2 | 0.090.01 | 1.510.22 | 22.3,–12.9 | 25,6, 41 |
| Sf-3 | 0.160.02 | 1.430.31 | 12.9,–38.3 | 32,6, 5 |
| Sf-4 | 0.110.01 | 1.360.27 | –4.3,–60.8 | 35,6, 68 |
| Overall | 0.450.06 | 1.510.22 | 22.3,–12.9 | 122,6,25 |
| Amorphous radio blobs & SE Trunk in SE Lobe | ||||
| SEblb-1 | 0.0370.006 | 0.60.1 | 59.9,–189.9 | 10,10, 0 |
| SEblb-2 | 0.0480.012 | 0.40.1 | 77.3,–166.5 | 16,9, 90 |
| SEblb-3 | 0.0600.012 | 0.50.1 | 42.9,–174.3 | 15,10, 90 |
| SEblb-4 | 0.0100.004 | 0.40.1 | 17.3,–163.1 | 14,11, 90 |
| SEblb-5 | 0.0640.013 | 0.40.1 | 44.3,–147.5 | 15,15, 0 |
| SEblb-6 | 0.0330.005 | 0.70.1 | 30.6,–134.8 | 16,11, 90 |
| SEblb-7 | 0.0360.007 | 0.40.1 | 38.0,–104.1 | 12.5,9, 90 |
| SEblb-8 | 0.020.004 | 0.50.1 | 9.5,–116.7 | 9,5.5, 90 |
| Overall | 1.10.2 | 0.70.1 | 30.6,–134.8 | 150,120,150 |
| SEtr | 0.540.05 | 0.50.1 | 136,–132 | 115,15,152 |
| Smoke Rings in NW Lobe | ||||
| NWstr-1a | 3.10.3 | 3.60.5 | –62.8,67.8 | 160,56,–58 |
| NWstr-1b | 0.510.08 | 0.70.1 | –200.7,124.4 | 86,22,-100 |
| NWstr-2 | 3.70.4 | 3.10.3 | –69.6,16.1 | 340,50,–67 |
| NWstr-3 | 2.50.2 | 10.00.5 | –76.2,-21.5 | 210,58,–78 |
| SmR-1 | 0.930.09 | 1.80.2 | –353.9,92.7 | 80,30,18 |
| SmR-2 | 1.00.1 | 1.80.2 | -283.5,107.4 | 80,30,55 |
| SmR-3 | 0.410.06 | 1.40.2 | -219.3,104.4 | 60,26,28 |
| Overall | 173 | 10.00.5 | –76.2,-21.5 | 380,190,–70 |
| Column 1 is the name of component sources; and Columns 2 – 5 respectively list their radio properties: flux density (Jy), peak intensity (mJy beam-1), position offsets (arcsec) from the field center (given in the footnote of Table 1), full width (arcsec) of a source along the maximum and minimum extents, and position angle of the longest extent (degrees); for a compact source. The flux density for each of the emission components is determined by integrating the emission intensity over the area given in Column 5 with a correction for background and/or foreground contaminations. The correction utilizes the mean intensity estimated from a nearby off-source area corresponding to each source. |
3.4.1 NW Radio Lobe
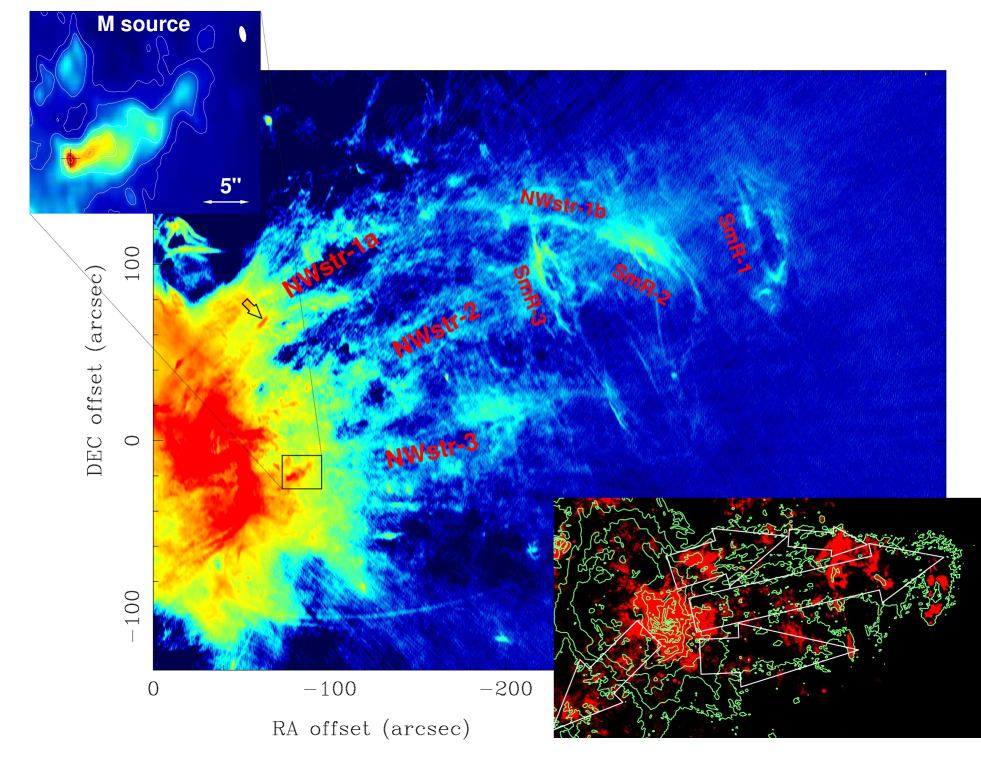
The 5.5 GHz image (Fig. 4) shows that the NW radio lobe is closely associated with the NW X-ray lobe that extends to positive latitudes, with a length in the radio of 360″ (14 pc) and a maximum width of 180″ (7 pc) at the base across Sgr A West. The NW radio lobe contains several elongated continuum emission streamers at distances from 100″ to 200″ from Sgr A* (Yusef-Zadeh & Morris, 1987), and bright ring-like emission nebulae – “Smoke Rings” – located at greater distances (Figs. 5 & 6). All but one of the NW streamers are generally perpendicular to the Galactic plane, PA=27°, (Binney & Merrifield, 1998), although they show some curvature. Four of these features are identified in Fig. 6. The northernmost streamer appears to consist of two segments; NWstr-1a appears to be a continuation of the NW Wing, with strong continuum emission (3.10.3 Jy) arising from a 2.7′1′ region oriented in PA –58°; this streamer apparently curves over to a weaker (0.50.1 Jy) and thinner segment, NWstr-1b, of size 1.5′0.4′, and PA –100°. The radio emission of NWstr-1a appears to be peaked at a short filament (NW Streak) in Fig. 2 of Zhao, Morris & Goss (2013) (marked with open arrow in Fig. 6 of this paper), which is associated with the compact X-ray source, CXOUGCJ174538.0-285911 (Muno et al., 2009).
The long, straight streamer NWstr-2 runs through the middle of the NW Lobe with a relative constant position angle of (–67°). NWstr-2 is therefore oriented within 4° of the Galaxy’s rotation axis, and is almost exactly co-aligned with Sgr A*. The flux density integrated over its 5.7′0.8′ size is 4.70.4 Jy. The highest-latitude extensions of NWstr-2 appear to intersect, and perhaps produce, the Smoke Rings.
The southernmost and least well-defined streamer is NWstr-3. The flux density is 2.50.2 Jy integrated within a region of size 3.5′1′, PA –78°. Near the base of NWstr-3, there is a bright head-tail source, source M, which might be physically related to NWstr-3. Source M was identified as a thermal emission arch based on observations of both the line (Serabyn, 1984) and radio continuum (Yusef-Zadeh & Morris, 1987). The compact emission in source M is identified with source 2 in Fig. 2 of Zhao, Morris & Goss (2013), which appears to be associated with the compact X-ray source CXOUGCJ174536.9-290039 (Muno et al., 2009). The radio intensity of the unresolved head of source M is 10 mJy beam-1. The tail extends toward positive latitudes, but the orientation is misaligned with NWstr-3 by 20°. We will present more detailed observations of source M in a subsequent publication.
Near the base of the NW Lobe, at distances from Sgr A* of 50″ – 180″ (2 – 7.5 pc), there is a field of amorphous radio blobs, or NW blobs, some of which have a bowshock morphology suggestive of a shock interaction between a wind and ambient gas clumps. The curvature of several of these apparent shocks is convex toward Sgr A*, indicating that the wind emanates from Sgr A* itself, from the central cluster of massive young stars, or from some combination of the two. A similar field of amorphous blobs occurs in the SE Lobe, described below. Such blobs, with typical surface brightnesses 0.5 mJy beam-1, are largely concentrated in the radio lobes, and there are far fewer instances of them elsewhere around Sgr A. This distribution is consistent with the hypothesis that the lobes have been sculpted by outflowing winds that are interacting with ambient density enhancements. Further investigation with shock diagnostics is needed to address the following questions concerning the origins of the radio blobs and streamers: is the emission from the amorphous blobs indeed a result of strong shocks; or alternatively, is the emission dominated by free-free radiation from gas clumps that have been ionized by the UV radiation from the massive young star cluster in the central parsec. In a subsequent paper, we will present a closer examination of the amorphous radio blobs in the lobes.
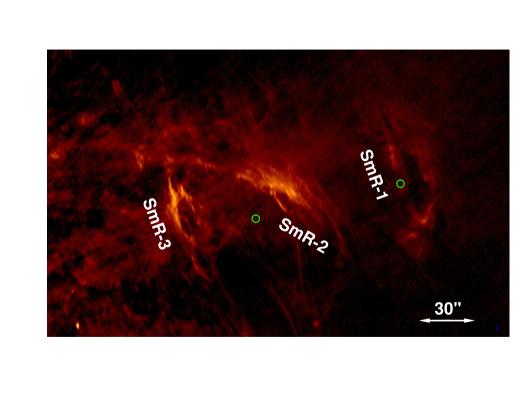
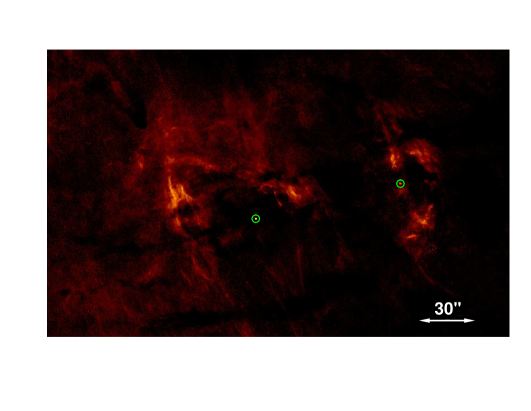
Most of the radio features within the lobes appear to have closely matching Paschen- (hereafter, P) counterparts, indicating that their emission is thermal free-free radiation. This correlation is broadly illustrated by the bottom-right inset of Fig. 6, which shows the HST/NICMOS image of P emission (Wang et al., 2010; Dong et al., 2011) overlaid with radio contours covering the region containing the NW radio lobe and the localized emission clumps in both the NW and SE lobes. Both the P and radio images in Fig. 6 are smoothed to a circular beam of 2″. The close correspondence of the radio and P in the outer portions of the NW Lobe is shown in detail in Fig. 7, which shows a succession of three nebulae, spaced along the central axis of the NW Lobe. In particular, the radio morphology of these three nebulae (“Smoke Rings”, see top image in Fig. 7), matches well with that observed in P (Fig. 7, bottom) when the patchy foreground extinction is taken into account.
The integrated flux densities of SmR-1, SmR-2 and SmR-3, respectively in order of decreasing distance from Sgr A*, are 0.930.09, 1.00.1 and 0.410.06 Jy. The extent of these nebulae along their major axes are in the range 1′ to 1.3′. The major axes of SmR-1 and SmR-3 appear to be nearly perpendicular to the central axis of the NW radio lobe while the major axis of SmR-2 appears to be tilted by 50° with respect to the central axis of the NW radio lobe. In addition, a few thin radio filaments can be matched with P filaments, indicating that not all of the radio filaments identified in this region are nonthermal emitters (Morris, Zhao & Goss, 2014). Two high-mass, X-ray-emitting emission-line stars (green circles in Fig. 7) have been identified in the vicinity of the Smoke Rings (Mauerhan et al., 2010; Dong et al., 2012), one located at the SE rim of SmR-1 (CXOGC J174516.7-285824, or P134) and the other located between SmR-2 and SmR-3 (CXOGC J174522.6-285844, or P39). These stars possibly contribute to the ionization of the Smoke Ring nebulae and perhaps the NW streamers. However, the NW and SW lobes have relatively soft, thermal X-ray counterparts (Morris et al. (2003); Ponti et al. (2015), and references therein; see Figs. 18 and 19 of the latter reference), indicating that at least some of the plasma in these nebulae is far hotter than expected for an HII region ionized only by hot stars. Consequently, strong shocks produced by high-velocity impacts of winds from the central region on ambient density enhancements seem to be a more likely mechanism for producing both the ionization and the X-ray emission.
The overall radio flux density from the NW Lobe is 173 Jy in a region of size 6.3′3.2′(15 pc 7.4 pc), with the long dimension at a position angle of –70°, and with the bottom of this rectangle located 0.3′ toward positive Galactic latitudes from Sgr A*.
3.4.2 SE Radio Lobe
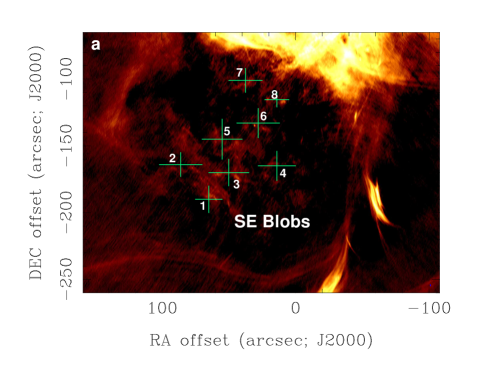
The radio counterpart of the SE X-ray lobe is much less prominent than that of the NW Lobe; indeed, without the clear presence of the SE X-ray lobe to help define it (Ponti et al., 2015), the physical coherence of the SE radio lobe is questionable. The X-ray emission from the SE Lobe appears to be outlined by the radio filaments labelled in Fig. 5 – the “Streaks” (a group of filaments) and the “Southern Curls” (Morris, Zhao & Goss, 2014), although this could be a chance superposition. Also, a ridge of emission (labelled SE Trunk in Fig. 5) cuts across the SE radio lobe and might be part of this structure, although its nature and origin are unclear. The amorphous radio blobs in the SE Lobe located between the SE Trunk and the filamentary Southern Curls show significant P, as illustrated in Figs. 8a (radio) and 8b (P). Here, the IR image has been smoothed to the same resolution as the radio of 2″.
The inset to Fig. 8b (top right) shows a detail of a presumably foreground shell source, the “SW Shell”, located to the southwest of Sgr A in our 5.5 GHz image and marked in Fig. 5. The close correspondence of the radio (color) with the P (contours) shows that the two coordinate frames are well aligned.
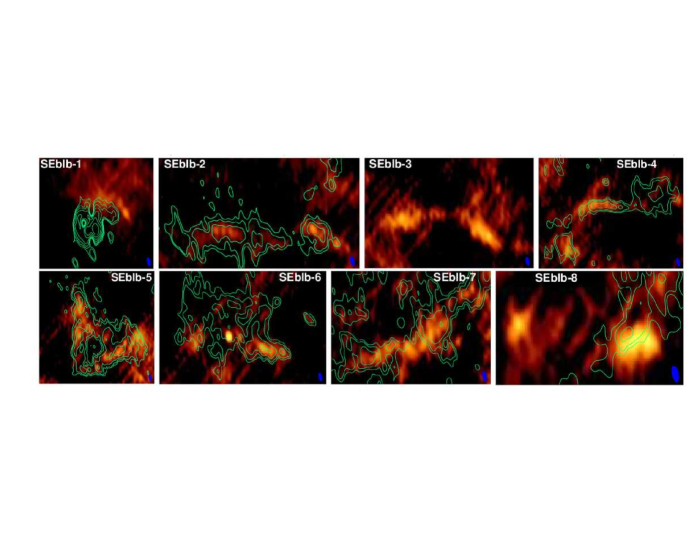
The eight panels at the bottom of Fig. 8 show the radio emission (color) from eight of the amorphous radio blobs, the “SE Blobs”, overlaid with P emission contours. SEblb-1 corresponds to the region surrounding the position of a bright star present in the 1.87 m images (but imperfectly removed in the continuum-subtracted image, Fig. 8b). A small arc of radio emission curves around the location of the star toward the NW, suggesting that SEblb-1 is locally produced by winds and/or radiation from this star.
The conical shape of SEblb-5 is present in both radio and P, suggesting the presence of a bow shock. The apex of this apparent cone (SE Cone) points away from Sgr A*, which raises the possibility that it has resulted from a collimated outflow from Sgr A*. However, the direction toward which the apex is pointing is offset by about 25° from that of the jet proposed by (Li et al., 2013) (see Fig. 5); no outflows have been observed or proposed in this direction.
A filamentary radio feature in SEblb-2 appears to be closely coincident with the P emission structure. On the other hand, SEblb-3 shows another filamentary radio structure, with no discernible P counterpart. The thin, curved radio filament of SEblb-4 also appears to be closely matched by the P emission over at least part of its length. SEblb-6 shows a complex radio morphology surrounding a compact source, and diffuse P emission permeates the entire structure. SEblb-7 has filamentary emission in both radio and P, but it is much more continuous in the radio. SEblb-8 consists of two clumps in the radio; only the western component has a P counterpart. The radio properties of the amorphous blobs are summarized in Table 2. The overall flux density of the blobs in the southern lobe is 1.10.2 Jy, within a region of angular size 2.5′2′.
The SE trunk (SEtr), located toward the NE of the SE Blobs (Fig. 5), subtends 115″15″ at a position angle of 152°) and has a total 5.5 GHz flux density of 0.540.05 Jy. This feature shows no significant counterpart in P emission, so it might be a nonthermally emitting structure. Indeed, the SEtr was also identified in the 90 and 20 cm images of Pedlar et al. (1989) as a 1′-scale structure at , in the Sgr A halo. At those wavelengths, the SEtr appears to have about the same spectral index as the supernova remnant, Sgr A East.

3.5. The Sgr A Halo
The SE and NW radio lobes lie within the radio halo of Sgr A, previously imaged by Yusef-Zadeh & Morris (1987) at 20 cm and by Pedlar et al. (1989) at 90 cm. To interpret the shallow turnover at frequencies below 500 MHz, Pedlar et al. (1989) argued that nonthermally emitting particles are uniformly mixed with the thermal gas, with a total halo mass of M. The diffuse continuum radiation of the halo, with a steep spectral index of and a flux density of 130 Jy at 6 cm, is dominated by nonthermal emission (Pedlar et al., 1989). This extended emission is not well sampled in the high resolution VLA observations of this paper. Comparison of our 5.5 GHz image with the P image indicates that most of the thermal gas appears to be in the amorphous gas clumps in the NW and SE lobes. From the measured flux density at 5.5 GHz, the NW Lobe alone appears to account for an HII mass of , where and are, respectively, the volume filling factor of free-free emitting gas and the thermal fraction of the total flux density at 5.5 GHz (see Appendix B).
4. Astrophysical Implications
4.1. A Reflected Blast Wave Front in The SNR
The iron enrichment of Sgr A East inferred from X-ray studies (Maeda et al., 2002; Park et al., 2005; Koyama et al., 2007), indicates that this nonthermal bubble originated as a type II supernova. Sgr A East appears to be a relatively old SNR with an age of 10,000 yrs (Maeda et al., 2002; Zhao, Morris & Goss, 2013), old enough that the reverse shock has propagated all the way back to the center of the remnant. The recent detection of a warm dust clump in Sgr A East has been interpreted as evidence that the dust produced in a SNR can survive the passage of the reverse shock (Lau et al., 2015). However, the rebound shock resulting from the presumed recent impact of the blast wave on the CND will not have had time to travel back to the center of the remnant. We hypothesize that the Sigma Front is the rebound shock resulting from the reflection of the SN blast wave (BW) off the massive CND. The CND consists of a relatively dense medium traced by molecular species such as HCN (Güsten et al., 1987; Jackson et al., 1993) and CN (Martín et al., 2012). The CND forms an annular ring between radii of 1.5 - 2.3 pc (Jackson et al., 1993) and up to a radius 5 pc for low excitation lines (Güsten et al., 1987).
The interaction of a BW and a dense cloud in the ISM has been studied over the past four decades, using both theoretically calculations, e.g., by McKee & Cowie (1975), Sgro (1975), Silk & Solinger (1973) and Spitzer (1982), and interpretations of SNR observations, e.g. Miyata & Trunemi (2001) for the Cygnus Loop. As a supernova blast wave strikes an interstellar gas cloud, two shocks are produced: (1) a reflected shock propagating back into the medium of the SNR and (2) a transmitted shock propagating into the cloud (Sgro, 1975). In this paper, we investigate this possibility with a simple geometrical model for the location of the Sgr A East SN with respect to the CND and Sgr A West. Based on the geometrical model, we sketch in the bottom-right panel of Fig. 3 a cartoon graphic to illustrate the geometrical configuration of the reflected/transmitted SN BWs relative to the CND and the SNR shell. In order to further assess the applicability of this geometrical model to the Galactic center, the following caveats must be considered:
First, the relative physical placements of Sgr A East and the CND, and of the BW and the CND, constrain the location of the SN explosion site to be a projected distance of 2 pc east of the CND, and relatively close in the background (Herrnstein & Ho, 2005). But because the Sigma Front is east of the CND indicating that the BW has been reflected back toward the center of the SNR in projection, and because the eastern side of the CND is the far side, the Sigma Front can only be accounted for in this model if the BW has rebounded. Our model assumes that the BW has recently passed over Sgr A* (Herrnstein & Ho, 2005; Rockefeller et al., 2005), in which case the maximum 3D separation of the center of the SNR from Sgr A* is pc, which is the semi-major axis of the SNR. This is consistent with the lower limit of the distance pc between the SN dust clumps and Sgr A* determined from the best-fit models for the observed dust SED (Lau et al., 2015), if the 1 pc projected offset of the dust concentration from the apparent center of the SNR is taken into account. The distance of the SN behind the sky plane containing Sgr A* is then pc.
Second, the interaction can deform the projected shell of the BW front from a circular shape, but the predicted minor to major axis size ratio, or the compression factor, of 0.85 based on a simple geometrical model assuming an interaction between the BW and the CND appears to be insufficient to explain the observed ratio of ; this could be caused by stretching of the major axis by the strong tidal shear in this region (Uchida et al., 1998).
Third, the distribution of the dense clumps in the CND may be responsible for the observed -shape of the Sigma Front. Both the northern and southern “” features likely correspond to the BWs reflected from the two high-density ( cm-3) molecular regions in the CND situated at projected distances of pc NE and SW of Sgr A*, as shown in the papers by Jackson et al. (1993) and Martín et al. (2012); see also the CN intensity image depicted in Fig. 3.
Fourth, the inclination () and major axis position angle () of the CND were determined by fitting the observed radial velocities with a circular rotation model (Güsten et al., 1987; Jackson et al., 1993) while mean values of and are found by fitting the radial velocities of radio recombination line images with Keplerian orbits around the central black hole (Zhao et al., 2009, 2010). The results from molecular line and RRL observations appear to be in good agreement. We adopt and ° in the simple geometrical model considered here. Thus in the illustration (bottom-right of Fig. 3), a position angle of 19° is used for the major axis of the CND, and 35° for that of the SNR shell.
Fifth, this model suggests that the interactions of the BWs with the CND separate the radio emitting gas energized by the BWs into two parts: (1) the reflected BW manifested as the Sigma Front, and (2) the transmitted BW lying behind and west (to north) closer to the CND, likely responsible for the emission arc around the Sgr A West absorption feature as observed at 90 cm, best viewed in color as shown in Fig. 1 of Goss et al. (1989). The overall structure of the Sgr A West absorption against Sgr A East, as observed at 90 cm with resolutions of 12″ (Pedlar et al., 1989; Goss et al., 1989) and 43″24″ (LaRosa et al., 2000), can be explained by a simple geometrical model in which most of the radiation from the transmitted BW that is located NW of Sgr A* and behind the CND, is absorbed by the thermal gas in Sgr A West located in front of the transmitted BWs.
Finally, we address the question of whether the SE and NW Wings might have been affected by the BW. As described in section 3.2, these features are associated with the ionized gas of the Western Arc and Northern Arm in Sgr A West, respectively. Both the Western Arc and Northern Arm are co-planar with the CND (Paumard et al., 2004; Zhao et al., 2009, 2010). The relatively low-density ionized gas in the SE and NW wings appears to have been expelled, probably by the nuclear wind, from the CND to move outward along bipolar direction (see section 4.2). For a large inclination angle of the CND, the dominant motion of the expelled material would then be in the sky plane. Given °, then for the observed projected length of the wings, ′(5 pc), the corresponding scale along the line of sight is ′(3 pc). Thus, the SE Wing would be situated sufficiently in front of the SN shell to not have been disturbed by the BW, while the NW Wing might have already interacted with the transmitted BW.
4.2. Ionized Outflow from The CND
One of the prominent features in the RBZ at the Galactic center is the bipolar structure. Although the SE Lobe is nearly engulfed in the Sgr A East SNR, the radio emission from the NW Lobe delineates a collimated outflow structure that appears to be dominated by free-free emission at 6 cm. Ionized outflows are an ubiquitous phenomenon in the nuclear regions of galaxies, from QSOs (Villar et al., 2014; Liu et al., 2013; Villar et al., 2011) to ultraluminous infrared galaxies (ULIRGs) (Arribas et al., 2014). The properties of the ionized winds observed in ULIRGs seem to differ from those observed in X-ray selected QSOs or type 2 QSOs. For ULIRGs with a mean velocity km s-1 and a mean electron density 460 cm-3, the mass loss rate from ionized outflows fall in the range 0.1yr-1 for a typical size of 1 kpc (Arribas et al., 2014). The ionized outflows associated with type 2 QSOs show a larger mean velocity and the physical quantites varying over a larger range (Villar et al., 2014; Rupke & Veilleux, 2013; Liu et al., 2013).
With a size of pc (at least 100 times smaller than those found in the extreme external galaxies referred above), the bipolar lobes in the RBZ of the Galactic center appear to be a mini-version of the ionized outflow, found in ULIRGs and type 2 QSOs. The bipolar flows in the lobes appear to be sub-Alfvnic bipolar of Alfvnic Mach number (see Appendix B). Then, if the SE Lobe contributes the same amount in as the NW Lobe, the total mass ejection rate into the lobes is , which falls at the lower end of the range for ULIRG (Arribas et al., 2014). The total ionized mass in the bipolar lobes is a few hundred times smaller than the lowest value found for outflow masses in the ULIRG sample (Arribas et al., 2014). The scale of the radio lobes is small compared to the scale of the central molecular zone (CMZ, 400 pc diameter), throughout which star formation is taking place. So in the case of our Galaxy, we can conclude that the nuclear outflow emanates from within the central parsec, rather than from star formation throughout the CMZ. Thus, while the CMZ has been implicated in cosmic ray outflows that might have created the Fermi Bubbles (Su et al., 2010; Crocker et al., 2011), the bipolar lobes must be attributed to energy released within the CND.
A comparison of Fig. 3 with Figs. 4, 5 and 6 suggests that the NW Lobe originates from the inner cavity or the inner edge of the CND. The possibility that the NW ionized outflow consists of material that has been driven by a jet is unlikely because of the relatively large opening angle of the lobe, and because of the absence of a well-collimated X-ray jet in the NW Lobe or of a counterpart to the putative parsec-scale X-ray jet in the SE Lobe (Li et al., 2013).
Another process to consider is radiation-pressure driving of the outflow. For the individual massive stars in the central stellar cluster, it is indeed likely that radiation pressure drives their winds, and that happens very close to the photospheres of those individual stars. Then, the winds from all the stars, with velocities that can be 1000 - 2000 km s-1, coast outward and merge, creating an outflowing collective wind that leaves the central cluster on a scale 0.5 pc. The central gravity of Sgr A* and the concentrated central stars will substantially decelerate the collective wind. The location and orientation of the wings suggest that the lobes could occur as a result of the deflection of a wind from the central regions off the CND.
How is the outflow collimated? The magnetic field of the CND may play a role, as it appears to be predominantly toroidal, or perpendicular to the outflow (Hildebrand et al., 1993). Furthermore, if the magnetic field in the volume around the CND is oriented perpendicular to the Galactic plane or to the CND, as it appears to be in the rest of the central molecular zone (Morris, 2006, 2014), then the deflected, ionized wind would be guided to follow the vertical field lines, and would naturally assume the orientation of the wings. Given such a scenario, we are left with a puzzle of why each of the wings extends in only one direction from its interaction point in the CND. In a perfectly axisymmetric situation, one might expect the wings to be deflected in both directions out of the plane of the CND. If the predominant magnetic field direction in the region ovelying the CND is indeed perpendicular to the Galactic plane, and if the final direction of the outflowing wind is indeed aligned with ambient magnetic field then perhaps the 20° tilt of the CND with respect to the Galactic plane strongly favors an acute deflection angle over an obtuse one.
Is radiation-pressure driving an important contributor to the outflow? The role of nuclear radiation in driving ionized outflow winds has been studied in galaxy formation and AGN, e.g. (Silk & Rees, 1998; Fabian, 1999; Krumholz & Thompson, 2013; Thompson et al., 2015; Ishibashi & Fabian, 2015). In the context of the Galactic center, the radiation from the central cluster needs to be assessed for its role in pushing out the ionized gas to a farther distance from the CND as well as sustaining the bipolar structure against the central gravity. From an hydrodynamic approach, the further motion of the gas is governed by the following equation (Osterbrock, 1974),
| (1) |
where the first term on the right is due to the pressure gradient; the second and the third terms are the forces per unit mass of the central gravity and the radiation pressure from the central cluster, respectively. In the following analysis, we will adopt the distribution of stellar mass given by Genzel et al. (2010), which has been described as a power-law outside the central cluster core ( pc); adding a mass of Sgr A* at the center (Ghez et al., 2005; Gillessen et al., 2009), an enclosed mass at is
A luminosity of from the Galactic center cluster has been derived from the Spitzer data at 4.5 m (Schödel et al., 2014). On other hand, Mezger et al. (1996) argues that the early B or late-type O stars produce a total ultra-violet luminosity in the central parsec of . The total luminosity from the central cluster (Mezger et al., 1996) is considered as an upper limit in our following analysis.
For the process of electron scattering, where and are the Thomson cross section and the proton mass, respectively, the force due to radiation pressure () is indeed much smaller than the central gravity. However, dust grains in the gas are partially charged in the environment of the nuclear regions (Fabian, 2012) and HII regions (Osterbrock, 1974); therefore, the electrical force effectively binds dust particles to the surrounding ionized gas. The strong coupling between the dust and gas will transmit the central repulsive force of radiation pressure to the entire ionized gas distribution. The effective dust cross section equivalent to is for radius of a dust particle and an abundance of dust grains by number with respect to hydrogen. Thus the actual radiation force is boosted by a factor of as compared to that of electron scattering. The boost factor appears to be 1000 assumed for AGNs (Fabian, 2012), which is equivalent to m and , a mean value of the ISM, e.g. Li (2005). For a dust-grain radius of m and used in modeling HII regions (Mathews, 1967), cm-2 and . The parameters used in Mathews (1967) appear to be too optimistic for radiation pressure, in which the dust abundance is five times higher than the the mean value of the ISM. In our assessment, we assume m, a value near the peaks of size distributions for carbonaceous-silicate grain model of the Galaxy (Draine, 2003), and the mean abundance of for the ISM, . Thus, we derive the ratio of radiation force to gravity as follows,
| (2) |
where is the luminosity of central cluster in units of (Schödel et al., 2014) and is the radial distance from Sgr A* in units of 1 pc. The Eq.(2) indicates that at for , implying that the radiation pressure may accelerate the ionized outflow within before the radiation force drops drastically compared to the gravity. Solving for the velocity in the hydrodynamic equation Eq.(1) assuming , we discuss two models: A) () and the initial radial velocity of the gas km s-1 at in comparison to B) () and km s-1 at . For Model A, the ionized gas can be accelerated by the radiation forces to a velocity 142 km s-1 up to ; beyond 3.6 pc, the gravity exceeds the radiation force and then the gas is decelerated. The outward velocity drops to km s-1 at 25, giving a mean velocity 120 km s-1. If the collimated outflow starts at as suggested in Model B, the primary acceleration zone by the radiation force from the central cluster occurs in 0.25 to 1; at , the outward velocity reaches its peak 144 km s-1; and a maximum travel distance 10 and a mean velocity 105 km s-1 are expected.
However, the models appear to be sensitive to the size of dust grains as well as their abundance in addition to the luminosity of the central cluster. The property of dust grains at the Galactic center is the key issue to nail down the role of the radiation pressure. The process of radiation pressure in driving the ionized outflow may merit further attention based on some known facts. With 100+ O/WR stars of 4 - 6 Myr age concentrated around Sgr A* (Genzel et al., 2010; Lu et al., 2013), the environment around Sgr A* is essentially a super HII region mixed with the warmer dust ( 70 – 130 K) as well as the hot dust (300 K) associated with the Bar and Northern Arm (Mezger et al., 1996). The co-existence of dust particles along the Mini-spiral structure (Gezari, 1992; Aitken et al., 1998; Mezger et al., 1996; Lau et al., 2013) implies that the dust grain particles are strongly coupled with the ionized gas. In addition, the OB stars outside the central cluster core contribute a meaningful luminosity besides that from the central stellar core, given the average surface density of early type stars a few hundredth stars arcsec-2 at (0.5 pc) (Buchholz et al., 2009; Støstad et al., 2015). Furthermore, the directions of the SE and NW Wings’ extension appear not to point back to Sgr A*, implying that the radiation from the central cluster may play an appreciable role at to 1 pc in driving out the ionized gas from the CND to the radio lobes.
Finally, major events from Sgr A* happen episodically along with large flares that likely add a substantial flux of high-energy photons up to erg s-1 at the Galactic center. The 100-year events suggested by the front of fluorescent X-rays propagating away from Sgr A*, as shown e.g. in Ponti et al. (2010) and Clavel et al. (2013), provide evidence for such past activity. Extraodinary X-ray flares are also expected from the statistical analysis of the flux-density fluctuations observed in the near infrared (Witzel et al., 2012).
5. Summary and Conclusion
Using the Jansky VLA in the B and C arrays, we have observed Sgr A using the broadband (2 GHz) continuum mode at 5.5 GHz covering the central 13′ (30 pc) region of the RBZ at the Galactic center. Using the CASA multi-scale and multi-frequency-synthesis clean algorithm, we have constructed a sensitive image, achieving an rms noise level of 8 Jy beam-1 and a dynamic range of 100,000:1. The high dynamic range allows us to unambiguously distinguish critical emission features in the radio. The new broadband VLA image shows a vast number of filamentary structures in the Sgr A complex surrounding the supermassive black hole, Sgr A*. The image provides unprecedented detail on several prominent emission features, including the NW and SE “Wings” of the Mini-spiral in Sgr A West, a -shaped band of emission – the Sigma Front – that lies within the shell of the Sgr A East supernova remnant, and the radio blobs and streamers in the radio lobes situated at positive and negative Galactic latitudes from Sgr A*.
We have compared the structures of the radio sources at 6 cm with molecular line images and X-ray images, finding that the Sigma Front appears to mimic the shape and orientation of the high-density molecular gas in the adjacent CND. A simple geometrical model is examined to demonstrate that the Sigma Front can be created by the impact and reflection of the blast waves from Sgr A East. This model constrains the location of the SN explosion site to be at its projected distance of 2 parsec east of Sgr A* and less than 3.3 pc behind the sky plane containing Sgr A*. The observation that Sgr A West is seen in absorption against Sgr A East at 90 cm is consistent with this model.
The new 5.5-GHz image provides considerable detail on the radio counterpart of the bipolar structure observed in X-rays, centered on Sgr A* (Baganoff et al., 2003; Morris et al., 2003; Ponti et al., 2015). With a detailed comparison of the radio image with the HST/NICMOS P image, we find that most of the radio continuum emission in the NW bipolar lobe is thermal free-free emission.
Appendix A A. Data Reductions
A.1. Basic Calibrations
The data reduction was carried out using the software package of CASA-Common Astronomy Software Applications (http://casa.nrao.edu) of the NRAO. The standard calibration procedure for continuum VLA data was applied. J1733-1304 (NRAO 530) was used for complex gain calibrations. The flux density scale was calibrated using the primary calibrators, either 3C 286 (J1331+3030) or 3 C48 (J0137+3309). Corrections for the bandpass shape of each baseband and the delay across the 2GHz band were determined based on the primary calibrator data.
A.2. Removal of Time Variation of Sgr A*
We investigated the time variation of the flux density from Sgr A* by creating lightcurves with the vector averaged visibilities for all baselines in the range between 60 and 300 k in 5-min time bins, phased at the position of Sgr A* using AIPS task DFTPL. The high-S/N central 85% of the data channels in each of the 16 spectral subbands are used in the calculations of the lightcurves. The variabilities of Sgr A*, defined numerically as , where and are the maximum and minimum flux densities, respectively, measured during the observation, are up to 20% within each of the four observing dates, and 50% between the dates. The effect of flux density variations of Sgr A* on the imaging quality is discussed by Zhao et al. (1991). We have developed a CASA/AIPS procedure to remove the time variation of Sgr A* prior to further data reduction in order to achieve a high-dynamic range image. Given an epoch of observation, the corresponding data set is broken down into numerous subsets of UV data, each consisting of data within a 5-min time interval. The variable component at the position Sgr A* in each subset of data was modeled using a CASA module Addcomponent assuming a Gaussian shape of Sgr A*. The major and minor axis sizes as well as the position angle of the major axis were determined from the scattering shape of Sgr A*, , , PA=80°, e.g., Lo et al. (1998) and Bower et al. (2004), and the flux density for a given 5-min time interval was determined from the lightcurve using DFTPL. Then, the variable component models were Fourier-transformed (FT) to the UV domain and attached to their corresponding UV subsets. The variable component Sgr A* are subtracted from the UV subsets with UVSUB to create the residuals without Sgr A*. With CASA task CONCAT, we concatenate the subsets back to the four observing-epoch sets. Finally, the Gaussian source at the position of Sgr A* with a constant value of 0.8 Jy (the average flux density) is added back to the residual data sets with FT and UVSUB in CASA. Therefore, the time-variable component at the position of Sgr A* has been removed from the visibility data. Fig. A1 outlines the procedure of correcting for the time-variable flux density of Sgr A* in CASA. The relevant CASA tasks and modules are scripted in a Python program.

1. SPLIT - split an original data set D into subsets d(t);
2. Addcomponent - create a model of Sgr A* at time t;
3. FT - FFT the Sgr A* model into the UV plane;
4. UVSUB - subtract Sgr A* from d(t) to obtain a residual data rd(t);
5. CONCAT - concatenate the rd(t) files together to assemble RD;
6. Addcomponent - create a Sgr A* model with its mean flux;
7. FT - FFT the mean flux model into the UV plane, attaching it to RD;
8. UVSUB - add Sgr A* back to RD to produce D*.
The time variation of the flux-density from Sgr A* has been removed in the final dataset D* produced from this procedure.
| Source | Name | Description | Ref. |
|---|---|---|---|
| J174542.00290018.0 | Sgr A Complex | Complex of numerous radio sources in the RBZ in an angular diameter of 13′ | 1,2,3 |
| J174540.04290028.1 | Sgr A* | Compact radio source, associated with the supermassive black hole (SMBH) | 4,5,6 |
| J174542.88290018.2 | Sgr A East | Shell of radio emission 3.3′2.3′(35°), possible supernova remnant (SNR) | 7,8 |
| J174543.65290040.0 | Sigma Front | -shaped radio feature, consisting of four segments, located within Sgr A East | 9 |
| J174540.04290029.7 | Sgr A West | Radio structure, 40″75″, characterized as the Mini-spiral | 7,8,13 |
| J174540.04290031.4 | Bar | Central bright part of Mini-spiral, 8″4″, ° | 8 |
| J174540.43290013.2 | Northern Arm | Feature located NE of Sgr A*, extended ″ to north | 8 |
| J174541.04290033.4 | Eastern Arm | Feature located SE of Sgr A*, extended ″ to northeast | 8 |
| J174538.74290043.4 | Western Arc | Feature located SW of Sgr A*, arc extended ″ | 8 |
| J174540.05290027.3 | CND | Circum-nuclear disk, characherized by dense molecular ring 80″40″, ° | 10,11,12 |
| J174537.82285902.1 | NW Wing | Northwestern wing of the Mini-spiral, extended | 9 |
| J174537.99285911.0 | NW Streak | Short filament in the NW Wing, counterpart of CXOUGCJ174538.0285911 | 1,3,14,15 |
| J174526.00285915.0 | NW Lobe | Complex extended emission region (6.3′3.2′, °), located NW of Sgr A* | 1,9 |
| J174521.65285826.2 | Smoke Rings | Three ring-like emission features, located in NW Lobe | 9 |
| J174545.53285828.7 | Cannonball | Radio counterpart of the X-ray Cannonball, pulsar wind nebula (PWN) | 14,15,16 |
| J174541.74285856.1 | Northern Filaments | Radio counterpart of the NuSTAR source in hard X-ray, G359.970.038 | 17 |
| J174541.73285816.6 | Northern Curls | Source I1/I2, a bundle of filaments, located at northern edge of Sgr A East | 1,3,18 |
| J174536.84290039.3 | M | Head-tail source, head corresponding to CXOUGCJ174536.9290039 | 1,9,14 |
| J174528.60290421.9 | SW Shell | Shell-like source, 6″5″ (28°) | 9 |
| J174541.71290126.0 | SE Wing | Southeastern wing of Mini-spiral, extended | 9 |
| J174545.00290300.0 | SE Lobe | Radio counterpart of the SE X-ray lobe | 9 |
| J174547.82290305.6 | SE Blobs | Amorphous radio blobs, located SE of Sgr A* | 9 |
| J174547.22290253.6 | SE Cone | Cone shaped emission feature, apex pointing away from Sgr A* | 9 |
| J174553.21290227.9 | SE Trunk | Trunk emission, 115″15″ (), located SE of Sgr A East | 1,2,9 |
| J174540.97290437.3 | Southern Curls | Sources E and F, bundle of filaments, located ′ south of Sgr A* | 18,19 |
| J174600.73290048.3 | Streaks | Group of filaments, in length, located east of Sgr A East | 1,3 |
| J174540.00290000.0 | CMZ | Central molecular zone, strong gas concentration in central °(400 pc) | 20 |
| 1. Yusef-Zadeh & Morris (1987); 2. Pedlar et al. (1989); 3. Yusef-Zadeh, Hewitt & Cotton (2004); 4. Balick & Brown (1974); 5. Reid (2009); 6. Genzel (2010); 7. Ekers et al. (1975); 8. Ekers et al. (1983); 9. Zhao, Morris & Goss (this paper); 10. Güsten et al. (1987) 11. Jackson et al. (1993) 12. Martín et al. (2012) 13. Lo & Claussen (1983); 14. Muno et al. (2009); 15. Zhao, Morris & Goss (2013); 16. Park et al. (2005); 17. Nynka et al. (2015); 18. Morris, Zhao & Goss (2014); 19. Ho et al. (1985); 20. Morris & Serabyn (1996). |
A.3. Self-Calibrations
The residual errors were further corrected in two steps with self-calibration techniques using a clean component model created from the MS-MFS clean process. First, we calculated gain corrections using the CASA task GAINCAL with phase only for a few cycles until the phase errors in the visibility data were minimized. Then, we corrected for amplitude using GAINCAL with the calmode=’ap’, employing the gain table produced from the last application of the phase-only step. Thus, the gain corrections calculated from the second step were only for amplitudes. Again, a few cycles for amplitude corrections were carried out until the corrections converged.
A.4. RFI Rejection
Rejection of radio frequency interference (RFI) was the most time-consuming task, but was critical to achieve a high-dynamic-range image. The procedure of RFI rejection occurred in three steps. First, the interactive tool PLOTMS was used to identify and then flag obvious RFI from the data. RFI in the calibrators with simple structure can be easily identified and rejected. More subtle RFI was then edited using the CASA modules TFCROP and RFFLAG for the calibrated data of the target source with complex visibility structure. Finally, during each of the self-calibration cycles, the low-level RFI was identified and flagged using PLOTMS for the residual visibilities (the calibrated visibility subtracted with the clean component model) for each baseline.
A.5. MS-MFS Imaging
After eliminating the RFIs and calibrations, we constructed an image with the four-epoch broadband data sets. The dirty image was cleaned using the MS-MFS algorithm (Rau & Cornwell, 2011) by fitting the amplitude change across the 2 GHz band with the first two terms in a Taylor expansion of the intensity spectrum at each pixel. The first term, the zeroth order Taylor expansion (tt0), corresponds to the Stokes-I image at the reference frequency (5.5 GHz), the center frequency in the 2-GHz band. The spectral index image, image, is generated from the second term in the first-order Taylor expansion (tt1). Two images were then produced. One is constructed with all the C and B (C+B) array data with a weighting of , to image overall emission structure. The rms noise of the Stokes-I image prior to the primary-beam corrections is 8 Jy beam-1, determined from areas with no sources. The second image was made from the B array data only with uniform weighting () in order to detect compact sources. The rms noise of this image is 15 Jy beam-1.
A.6. Primary-Beam Correction
We have corrected for the primary beam attenuation up to the level of 10% of the value at the pointing center, corresponing to a diameter of 13′.1 for the field of view in the final image.
A.7. List of Prominent Radio Sources
In Table A1, we list the prominent radio sources that are discussed in the text. The corresponding J2000 coordinates of the sources and their nomenclatures adopted or created in this paper are given in Columns 1 and 2, respectively. A discription for each of the sources are supplied in Column 3 along with relevant references (Column 4).
Appendix B B. Power of The Bipolar Outflow
The well-defined NW radio lobe, consisting primarily of free-free emission, might represent a significant feedback from the region surrounding Sgr A* via an ionized wind driven by the overwhelming radiation pressure from the central cluster; and the wind is possibly collimated by the local poloidal magnetic field anchored on the CND. In the following, we will assess the power of the possible bipolar ionized outflow, utilizing the NW radio lobe as an exercise. The power transported from a non-relativistic outflow wind can be estimated,
| (B1) |
where is the radius of a cross section of the collimated outflow wind with its velocity and volume ; and the energy density including kinetic (), internal () and magnetic field () is:
| (B2) |
The free-free () flux density from the ionized outflow can be expressed as where is a dilution factor owing to contamination from the diffuse non-thermal synchrotron component (Pedlar et al., 1989) and the non-outflow f-f emission from foreground/background nebulae; and is the total flux density from a lobe. With the radio measurements, we are able to assess the physical quantities of the ionized outflow. The mean electron density () and HII mass () can be estimated with the formula deduced from Mezger & Henderson (1967) using cylindrical geometry () with volume filling factor of the ionized gas and proton mass :
| (B3) | |||||
| (B4) |
Thus, we have and with the measured quantities from the VLA observations at 5.5 GHz: Jy, , K and kpc. The expansion time scale of the NW Lobe can be estimated assuming a constant velocity along the rotational axis of the CND, which has an inclination angle of °(Güsten et al., 1987; Zhao et al., 2010),
| (B5) |
given the outflow velocity being scaled with Alfvnic Mach number with an Alfvnic velocity:
| (B6) |
Taking the ion mass and assuming solar abundances, the mass loss rate via the NW Lobe is
| (B7) | |||||
The kinetic energy of bulk motion () and internal enery () can be derived as follows:
| (B8) | |||||
| (B9) | |||||
where we take the thermal pressure and , adiabatic coefficient and assuming a cylindrical geometry for the outflow. For a typical magnetic field strength 1 mG with a volume filling factor of the magnetized region, the magnetic energy stored in the flow is
| (B10) | |||||
Then, from the physical quantities of the NW lobe determined from the VLA observations at 5.5 GHz and other observations, we estimate the kinetic energy . The Model B discussed in section 4.2 gives the mean outflow velocity 105 km s-1, implying a mean Alfvnic Mach number for the NW lobe. For , and , we estimate ergs, ergs, and ergs. The internal energy appears to be two orders in magnitude below the others. A total energy budget appears to be ergs. Thus, the total power of the NW outflow wind with a travel distance approximately equals to
| (B11) |
The total power transported into the NW and SE lobes is about three orders of magnitude less than the stellar luminosity emerging from the central few parsecs. If the ionized bipolar outflow is powered by the radiation produced by the central star cluster (, and also see section 4.2), the efficiency of powering the outflow by the radiation luminosity is .
References
- Aitken et al. (1998) Aitken D.K., Smith, C. H., Moore, T. J. T. & Roche, P. F. 1998, MNRAS, 299, 743
- Arribas et al. (2014) Arribas, S., Colina, L., Bellochi, E., Maiolino, R. & Villar-Martin, M. 2014, arXiv:1404.1082v1
- Baganoff et al. (2003) Baganoff, F.K., Maeda, Y., Morris, M., Bautz, M.W., Brandt, W.N., Cui, W., Doty, J.P., Feigelson, E.D., Garmire, G.P., Pravdo, S.H., Ricker, G.R., Townsley, L.K. 2003, ApJ, 591, 891
- Balick & Brown (1974) Balick, B. & Brown, R. L. 1974, ApJ, 194, 265
- Binney & Merrifield (1998) Binney, J., & Merrifield, M. 1998, Galactic Astronomy (Princeton: Princeton Univ. Press)
- Bower et al. (2004) Bower, G. C., Falcke, H., Herrnstein, R. M., Zhao, J-.H., Goss, W. M., & Backer, D. C. 2004, Science, 304, 704
- Buchholz et al. (2009) Buchholz, R. M., Schödel, R. & Eckart, A. 2009 AA, 499, 483
- Carretti et al. (2013) Carretti, E., Crocker, R. M., Staveley-Smith, L., Haverkorn, M., Purcell, C., Gaensler, B. M., Bernardi, G., Kesteven, M. J., Poppi, S. 2013, Nature, 493, 66
- Clavel et al. (2013) Clavel, M., Terrier, R., Goldwurm, A., Morris, M. R., Ponti, G., Soldi, S., Trap, G. 2013, AA, 558, 32
- Crocker & Aharonian (2011) Crocker, R. M., Aharonian, F. 2011, Phys. Rev. Lett., 106, 101102
- Crocker et al. (2011) Crocker, R. M., Jones, D. I., Aharonian, F., Law, C. J., Melia, F., Oka, T., Ott, J. 2011, MNRAS, 413, 763
- Dong et al. (2011) Dong, H., Wang, Q.D., Cotera, A., Stolovy, S, Morris, M.R., Mauerhan, J., Mills, E.A., Schneider, G., Calzetti, D, & Lang, C. 2011, MNRAS, 417, 114
- Dong et al. (2012) Dong, H., Wang, Q.D. & Morris, M.R. 2012, MNRAS, 425, 884
- Draine (2003) Draine, D. T. 2003, ARA&A, 41, 241
- Ekers et al. (1975) Ekers, R. D., Goss, W. M., Schwarz, U. J.,Downes, D., & Rogstad, D. H. 1975, AA, 43, 159 1983, AAp, 122, 143
- Ekers et al. (1983) Ekers, R. D., van Gorkom, J. H., Schwarz, U. J., & Goss, W. M. 1983, AAp, 122, 143
- Fabian (1999) Fabian, A. C. 1999, MNRAS, 308, L39
- Fabian (2012) Fabian, A. C. 2012, ARA&A, 50, 455
- Genzel et al. (2010) Genzel, R., Eisenhauer, F., Gillessen, S. 2010, Reviews of Modern Physics, 82, 3121
- Gezari (1992) Gezari, D. 1992, in The center, bulge, and disk of the Milky Way, ed. L. Blitz (Dordrecht: Kluwer), p23
- Ghez et al. (2005) Ghez, A. M., Salim, S., Hornstein, S. D., Tanner, A., Lu, J. R., Morris, M., Becklin, E. E., Duchêne, G. 2005, ApJ, 620, 744
- Gillessen et al. (2009) Gillessen, S., Eisenhauer, F., Trippe, S., Alexander, T., Genzel, R., Martins, F., Ott, T. 2009, ApJ, 692, 1075
- Goss et al. (1989) Goss, W. M., Anantharamaiah, K. R., van Gorkom, J. H., Ekers, R. D., Pedlar, A., Schwarz, U. J. & Zhao, J.-H., 1989, in The Center of The Galaxy, IAUS 136 ed. by Mark Morris, Kluwer Academic Publishers, Dordrecht, p345
- Güsten et al. (1987) Güesten, R., Genzel, R., Wright, M. C. H., Jaffe, D. T., Stutzki, J., Harris, A. I. 1987, ApJ, 318, 124
- Herrnstein & Ho (2005) Herrnstein, R. & Ho, P. T. P. 2005, ApJ, 620, 287
- Hildebrand et al. (1993) Hildebrand, R. H., Davidson, J. A., Dotson, J., Figer, D. F., Novak, G., Platt, S. R. & Tao, L. 1993, ApJ, 417, 565
- Ho et al. (1985) Ho, P. T. P., Jackson, J. M., Barrett, A. H., & Armstrong, J. T. 1985, ApJ, 288, 575
- Irons et al. (2012) Irons, W. T., Lacy, J. H., & Richter, M. J. 2012, ApJ, 755, 90
- Ishibashi & Fabian (2015) Ishibashi, W. and Fabian, A. C. 2015, MNRAS, 451, 93
- Jackson et al. (1993) Jackson, J. M., Geis, N., Genzel, R., et al. 1993, ApJ, 402, 173
- Koyama et al. (2007) Koyama, K. et al. 2007, PASJ, 59, 245
- Krumholz & Thompson (2013) Krumholz, M. R. and Thompson, T. A. 2013, MNRAS, 434, 2329
- LaRosa et al. (2000) LaRosa, T. N., Kassim, N. E., Lazio, T. J. W., Hyman, S. D. 2000, ApJ, 119, 207
- Lau et al. (2013) Lau, R. M., Herter, T. L., Morris, M. R., Becklin, E. E., Adams, J. D. 2013, ApJ, 775, 37
- Lau et al. (2015) Lau, R. M., Herter, T. L., Morris, M. R., Li, Z. Adams, J. D. 2015, Science, 348, 413
- Li (2005) Li, A. 2005, in Interstellar grains the 75th anniversary, Journal of Physics: Conf. Series 6, 229
- Li et al. (2013) Li, Z., Morris, M. R. & Baganoff, F. K. 2013, ApJ, 779, 154
- Liu et al. (2013) Liu, G., Zakamska, N. L., Greene, J. E., Nesvadba, N. P. H., Liu, X. 2013, MNRAS, 436, 2576
- Lo & Claussen (1983) Lo, K. Y. & Claussen, M. J. 1983, Nature, 306, 647
- Lo et al. (1998) Lo, K. Y., Shen, Z. Q., Zhao, J.-H., & Ho, P. T. P. 1998, ApJ, 508, L61
- Lu et al. (2013) Lu, J.R., Do, T., Ghez, A.M., Morris, M.R., Yelda, S. & Matthews, K. 2013, ApJ, 764, 155
- Maeda et al. (2002) Maeda, Y., Baganoff, F. K., Feigelson, E. D., Morris, M., Bautz, M. W., Brandt, W. N., Burrows, D. N., Doty, J. P., Garmire, G. P., Pravdo, S. H., Ricker, G. R. & Townsley, L. K. 2002, ApJ, 570, 671
- Markoff (2010) Markoff, S. 2010, Proc. Natl. Acad. Sci. USA, 107 (16), 7196
- Martín et al. (2012) Martín, S., Martín-Pintado, J., Montero-Castano, M., Ho, P. T. P., Blundell, R. 2012, AA, 539, 29
- Mathews (1967) Mathews, W. G. 1967, ApJ, 147, 965
- Mauerhan et al. (2010) Mauerhan, J.C., Muno, M.P., Morris, M.R., Stolovy, S.R. & Cotera, A. 2010, ApJ, 710, 706
- McKee & Cowie (1975) McKee, C. F. & Cowie, L. L. 1975, ApJ, 195, 715
- Mezger & Henderson (1967) Mezger, P. G. & Henderson, A. P. 1967, ApJ, 147, 471
- Mezger, et al. (1989) Mezger, P. G., Zylka, R., Salter, C. J., Wink, J. E., Chini, R., Kreysa, E., & Tuffs, R. 1989, AA, 209, 337
- Mezger et al. (1996) Mezger, P. G., Duschl, W. J., & Zylka, R. 1996, AAR, 7, 289
- Miyata & Trunemi (2001) Miyata, E. & Trunemi, H. 2001, ApJ, 552, 624
- Morris & Serabyn (1996) Morris, M. & Serabyn, E. 1996, ARA&A, 34, 645
- Morris et al. (2003) Morris, M., Baganoff, F., Muno, M, Howard, C., Maeda, Y. Feigelson, E., Bautz, M., Brandt, N., Chartas, G., Garmire, G., & Townsley, L. 2003, Astron. Nachr. Suppl. 324, 167
- Morris, Zhao & Goss (2014) Morris, M. R., Zhao, J.-H. & Goss, W. M. 2014, IAUS 303, 369
- Morris (2006) Morris, M. R. 2006, JPhCS, 54, 1
- Morris (2014) Morris, M. R. 2014, arXiv:1406.7859
- Muno et al. (2009) Muno, M. P., Bauer, F. E., Baganoff, F. K., et al. 2009, ApJS, 181, 110
- Nord et al. (2004) Nord, M. E., Lazio, T. J. W., Kassim, N. E. et al. 2004, ApJ, 128, 1646
- Nynka et al. (2015) Nynka, M., Hailey, C. J., Zhang, S. et al. 2015, ApJ, 800, 119
- Park et al. (2005) Park, S., Muno, M. P., Baganoff, F. K., Maeda, Y., Morris, M., Chartas, G., Sanwal D., Burrows D. N., Garmire, G. P. 2005, ApJ, 631, 963
- Paumard et al. (2004) Paumard, T., Maillard, J. P. & Morris, M. 2004, AAp, 426, 81
- Osterbrock (1974) Osterbrock, D. E. 1974, Astrophysics of Gaseous Nebulae, w. H. Freeman and Company, San Francisio
- Pedlar et al. (1989) Pedlar, A., Anantharamaiah, K. R., Ekers, R. D., Goss, W. M., van Gorkom, J. H., Schwarz, U. J. & Zhao, J.-H. 1989, ApJ, 342, 769
- Ponti et al. (2010) Ponti, G., Terrier, R., Goldwurm, A., Belanger, G. & Trap, G. 2010, ApJ, 714, 732
- Ponti et al. (2013) Ponti, G., Morris, M. R., Terrier, R. & Goldwurm, A. 2013, in Cosmic Rays in Star-Forming Environments, ASS Proceedings, 34, p331
- Ponti et al. (2015) Ponti, G., Morris, M.R., Terrier, R. et al. 2015, MNRAS, 453, 172.
- Rau & Cornwell (2011) Rau, U. & Cornwell, T. J. 2011, AA, 532, A71
- Reid (2009) Reid, M. J. 2009, IJMPD, 18, 889
- Rockefeller et al. (2005) Rockefeller, G., Fryer, C. L., Baganoff, F. K., Melia, F. 2005, ApJ, 635, L141
- Rupke & Veilleux (2013) Rupke, D. S. & Veilleux, S. 2013, ApJ, 768, 75
- Schödel et al. (2014) Schödel, R., Feldmeier, A., Kunneriath, D., Stolovy, S., Neumayer, N., Amaro-Seoane, P. & Nishiyama, S. 2014, AA, 566, 47
- Serabyn (1984) Serabyn, E. 1984, Ph. D. Thesis, University of California, Berkeley
- Serabyn et al. (1992) Serabyn, E., Lacy, J. H., & Achtermann, J. M. 1992, ApJ, 395, 166
- Sgro (1975) Sgro, A. G. 1975, ApJ, 197, 621
- Silk & Solinger (1973) Silk, J. & Solinger, A. 1973, Nature Phys. Sci., 244, 101
- Silk & Rees (1998) Silk, J. & Rees, M. J. 1998, AA, 331, L1
- Spitzer (1982) Spitzer, L. 1982, ApJ, 262, 315
- Støstad et al. (2015) Støstad, M., Do, T., Murray, N., Lu, J. R., Yelda, S., & Ghez, A. 2015, ApJ, 808, 106
- Su et al. (2010) Su, M., Slatyer, T. R. & Finkbeiner, D. P. 2010, ApJ, 724, 104
- Thompson et al. (2015) Thompson, T. A., Fabian, A. C., Quataert, E. and Murray, N. 2015, MNRAS, 449, 147
- Uchida et al. (1998) Uchida, K. I., Morris, M., Serabyn, E., Fong, D. & Meseroll, T. 1998, in The central regions of the Galaxy and galaxies, IAU Sympo. 184, ed. by Y. Sofue, Dordrecht: Kluwer, p.317
- Villar et al. (2014) Villar Martin, M., Emonts B., Humphrey, A., Cabrera Lavers, A. & Binette, L. 2014, MNRAS, 440, 3202
- Villar et al. (2011) Villar Martin, M., Humphrey, A., Gonzalez Delgado, R., Colina, L., Arribas, S. MNRAS, 418, 2032
- Wang et al. (2010) Wang, Q. D., Dong, H., Cotera, A., Stolovy, S., Morris, M., Lang, C.C., Muno, M. P., Schneider, G., Calzetti, D. 2010, MNRAS, 402, 895
- Witzel et al. (2012) Witzel, G., Eckart, A., Bremer, M. et al. 2012, ApJS, 203, 18
- Yusef-Zadeh & Morris (1987) Yusef-Zadeh, F. & Morris, M. 1987, ApJ, 320, 545
- Yusef-Zadeh et al. (1999) Yusef-Zadeh, F., Roberts, D. A., Goss, W. M., Frail, D. A. & Green, A. J. 199, ApJ, 512, 230
- Yusef-Zadeh, Hewitt & Cotton (2004) Yusef-Zadeh, F., Hewitt, J. W., & Cotton, W. 2004, ApJ, 155, 421
- Zhao et al. (1991) Zhao, J.-H., Goss, W. M, Lo, K. Y. & Ekers, R. D. 1991, Nature, 354, 46
- Zhao et al. (2009) Zhao, J.-H., Morris, M. R., Goss, W. M. & An, T. 2009, ApJ, 699, 186
- Zhao et al. (2010) Zhao, J.-H., Blundell, R., Moran, J. M., Downes, D., Schuster, K. F., Marrone, D. P. 2010, ApJ, 723, 1097
- Zhao, Morris & Goss (2013) Zhao, J.-H., Morris, M. R., & Goss, W. M. 2013, ApJ, 777, 146
- Zubovas et al. (2011) Zubovas, K., King, A. R., & Nayakshin, S. 2011, MNRAS, 415, L21