later
Andromeda IV, a solitary gas-rich dwarf galaxy
Abstract
Observations are presented of the isolated dwarf irregular galaxy And IV made with the Hubble Space Telescope Advanced Camera for Surveys and the Giant Metrewave Radio Telescope in the 21 cm HI line. We determine the galaxy distance of Mpc using the Tip of Red Giant Branch method. The galaxy has a total blue absolute magnitude of –12.81 mag, linear Holmberg diameter of 1.88 kpc and an HI-disk extending to 8.4 times the optical Holmberg radius. The HI mass-to-blue luminosity ratio for And IV amounts . From the GMRT data we derive the rotation curve for the HI and fit it with different mass models. We find that the data are significantly better fit with an iso-thermal dark matter halo, than by an NFW halo. We also find that MOND rotation curve provides a very poor fit to the data. The fact that the iso-thermal dark matter halo provides the best fit to the data supports models in which star formation feedback results in the formation of a dark matter core in dwarf galaxies. The total mass-to-blue luminosity ratio of makes And IV among the darkest dIrr galaxies known. However, its baryonic-to-dark mass ratio ( is close to the average cosmic baryon fraction, 0.15.
keywords:
galaxies: dwarf - galaxies: kinematics and dynamics - galaxies: individual (Andromeda IV)1 Introduction
The larger fraction of baryonic matter in spiral and elliptical galaxies is concentrated in stars. A typical ratio of neutral hydrogen-to-stellar mass in spiral galaxies amounts %, while in elliptical and lenticular galaxies the ratio does not exceed 1% (Roberts 1969). In this sense, E,S0 and early-type S galaxies are situated at the finish line of their gas-dynamic evolution. However, there are late-type galaxies, with still significant reserves of neutral gas remaining, and they will be fertile over the next cosmic Hubble time, .
Among about 800 galaxies in the Local Volume with distances Mpc recorded in the “Updated Nearby Galaxy Catalog” (= UNGC, Karachentsev et al. 2013), 163 galaxies, i.e. 20% of the sample, have a ratio . As it is seen from Figs. 14–19 in UNGC, the high ratios occur most frequently among dwarf galaxies of dIrr, dIm, and Sm types. The galaxies with high gas-to-stellar mass ratio are usually isolated objects, with a low optical surface brightness and low metallicity.
In the literature, there are instances of dwarf systems with hydrogen mass-to-blue luminosity ratios of in solar units (Begum et al. 2005, Warren et al. 2007, Karachentsev et al. 2008, Chengalur & Pustilnik, 2013). Such gas-dominated objects must be at an initial stage of their evolution, and can be called “laggard” galaxies. At the same time, the specific star formation rate of the laggard dwarfs has a typical value of , i.e. they are able to reproduce their observed stellar mass during the cosmological time with their observed current star formation rate (Karachentsev & Kaisina 2013).
The subject of the present paper is the isolated dwarf galaxy Andromeda IV (= And IV) at (J2000) 00 42 32.3 +40 34 19, one of the three most HI-rich objects known within the Local Volume. This dwarf system of low surface brightness was found by van den Bergh (1972) as a candidate open stellar cluster at the periphery of M 31. However, deep observations of And IV with the WFPC2 camera aboard Hubble Space Telescope by Ferguson et al. (2000) established it to be a background dIrr galaxy at a distance of 6.31.5 Mpc. Distribution of neutral hydrogen in And IV as well as the radial velocity field were studied by Begum et al. (2008) using the Giant Metrewave Radio Telescope (GMRT). The authors found that the HI- envelope around And IV extends to 8 times its optical Holmberg diameter, and its ratio exceeds .
Below, we present the analysis of new HST imaging and a more detailed analysis of archival GMRT 21 cm data of Andromeda IV.
2 HST/ACS observations and TRGB distance
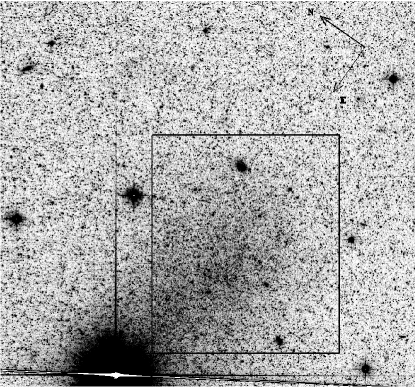
The galaxy And IV was observed aboard HST using Advanced Camera for Surveys (ACS) on August 3, 2014 (SNAP 13442, PI R. Tully). Two exposures were made in a single orbit with the filters F606W (1200 s) and F814W (1200 s). The F606W image of the galaxy And IV is shown in Fig. 1.
The photometry of resolved stars in the galaxy was performed with the ACS module of the DOLPHOT package111http://americano.dolphinsim.com/dolphot/ for crowded field photometry (Dolphin 2002) using the recommended recipe and parameters. Only stars with photometry of good quality were included in the final compilation, following recommendations given in the DOLPHOT User’s Guide. We have selected the stars with signal-to-noise (S/N) of at least five in the both filters. To exclude possible nonstellar objects we used in the analysis only stars with .
Artificial stars were inserted and recovered using the same reduction procedures to accurately estimate photometric errors, including crowding and blending effects. A large library of artificial stars was generated spanning the full range of observed stellar magnitudes and colours to assure that the distribution of the recovered photometry is adequately sampled. The DOLPHOT package contains quite powerful and flexible procedure to perform artificial star experience. For an adequate estimation of completeness we have taken the amount of artificial stars 10 times the number of real stars. Number of artificial stars in a particular part of the image depends on the distribution of real stars, and it is greater, the greater the real star number in the area. Thus, the completeness was adequately estimated in the most densely populated areas of the frame.
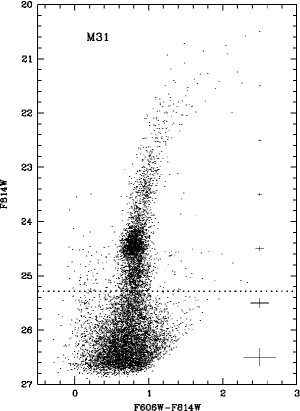
Figure 2 shows colour-magnitude diagrams (CMDs) for the detected stars. The left panel presents CMD for stars within a box of 40\arcsec 50\arcseccentered on And IV itself. The contamination from M31 is extreme. Most resolved stars are associated with M31 centered 42 arcmin away. The middle panel corresponds to the ACS field of the same area chosen outside the And IV boundary, hence samples the M31 halo. The right panel reproduces a CMD for stars of And IV itself obtained by statistical subtraction of “AndIV+M31” — “M31” diagrams. The CMDs reveal a prominent red giant branch (RGB), a red clump, and a weak blue plume belonging to M31 in the foreground, and a fainter RGB attributed to the more distant And IV. The measured TRGB position for And IV is marked by the dotted line.
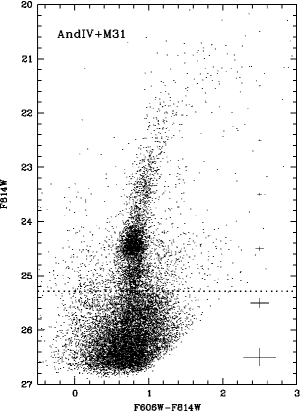
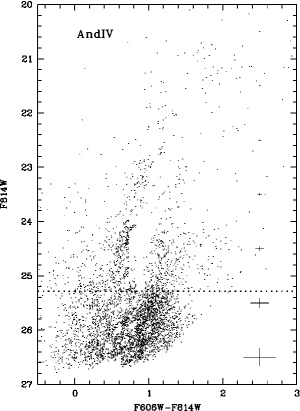
We have determined the And IV distance with our trgbtool program which uses a maximum-likelihood algorithm to determine the magnitude of the tip of the red giant branch (TRGB) from the stellar luminosity function (Makarov et al. 2006). The estimated value of the TRGB is F814W = mag in the ACS instrumental system. Following the calibration of the TRGB methodology developed by Rizzi et al. (2007), we have obtained the true distance modulus mag and the distance of Mpc. This measurement assumes foreground reddening of (Schlafly & Finkbeiner 2011).
3 HST/ACS surface photometry
Surface photometry of And IV was made with fully processed distortion-corrected HST/ACS F606W and F814W images. Some bright foreground stars were removed from the frames by fitting a first order surface in a rectangular pixel-area in the nearest neighbourhood of the star. The sky background in the ACS images is insignificant, but, to remove possible slight large scale variations, the sky was approximated by a tilted plane, created from a two-dimension polynomial, using the least-squares method. The accuracy of the sky background determination is about 2% of the original sky level. The main source of the background uncertainty was the bright red star east of And IV seen in Fig. 1.
To measure total galaxy magnitude in each band, the galaxy image was first fitted with concentric ellipses. Then integrated photometry was performed in these ellipses with parameters defined from the centre to the faint outskirts (Bender & Moellenhoff 1987). The total magnitude was then estimated as the asymptotic value of the radial growth curve. The measured total magnitude and colour are equal to and . The estimated errors include the photometry and sky background uncertainties, as well as the transformation errors from instrumental ACS magnitudes to the standard and magnitudes (Sirianni et al. 2005).
Azimuthally averaged surface brightness profiles for And IV were obtained by differentiating the galaxy growth curves with respect to semiaxes. The resulting profiles in (upper line) and bands are displayed in Fig. 3. The low surface brightness of the galaxy makes the profiles rather noisy.
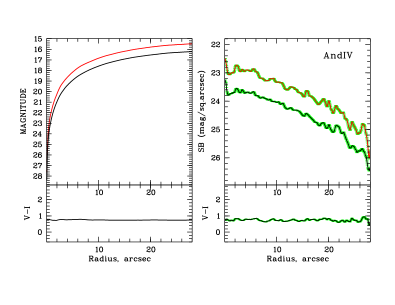
As known, surface brightness profiles of dwarf irregular and spheroidal galaxies can be fitted by an exponential intensity law of brightness distribution in magnitudes per square arcsec (de Vaucouleurs 1959):
where is the central surface brightness and is the exponential scale length. The surface brightness profiles of And IV are moderately well fitted by an exponential law. The unweighted exponential fits to the profiles yield the central surface brightness of and . The scale lengths are and .
Some basic photometric parameters of And IV are given in Table 1, where the transformation from band to one was done using the standard relation
valid for dIrr galaxies (Makarova, 1999).
4 GMRT HI- observations and data analysys
The moment maps for And IV have been previously published in Begum et al. (2008). We summarize briefly below the observational and data reduction details, and refer the reader to the earlier paper for more details. The GMRT (Swarup et al. 1991) observations of And IV were conducted on 2nd Jan 2007. An observing bandwidth of 1 MHz centered at 1418.65 MHz (which corresponds to a heliocentric velocity of ) was used . The band was divided into 128 spectral channels, giving a channel spacing of 1.65 . Absolute flux calibration was done using scans on the standard calibrator 3C48, which were observed at the start and end of the observing run. Phase calibration was done using 0029+349, which was observed once every 50 minutes. Bandpass calibration was done in the standard way using the 3C48 observations. The total on-source time was 8.6 hours. Data analysis was done using the classic AIPS package, and data cubes made at spatial resolutions of and .
Fig. 4 shows the integrated HI emission from And IV at 44 resolution, overlayed on the digitised sky survey (DSS) image. As can be seen, the HI distribution of And IV is regular; the total HI extent at a column density of 5 cm-2 is 7.2′. The total extent at a column density of 1 cm-2 is 7.6′ (or times the Holmberg diameter). The integrated HI flux obtained from this data is 17.4 Jy km/s, which is slightly less than the value of 22.4 Jy km/s reported by Braun et al. (2003).
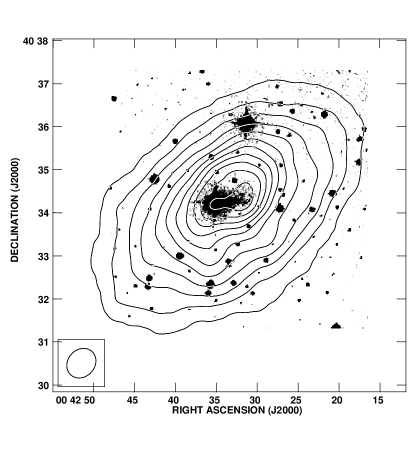
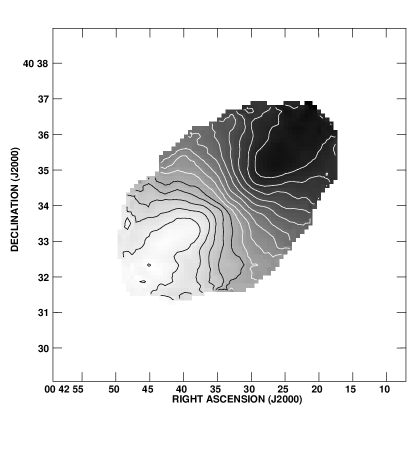
Fig. 5 shows the velocity field of And IV at 26 resolution. The velocity field is regular and a large scale velocity gradient, consistent with systematic rotation, is seen across the galaxy. The velocity field of this galaxy is lopsided; the isovelocity contours in the south-eastern half of the galaxy are more closed than the north-western half. However, on the whole, in comparison with the galaxies in the FIGGS survey (Begum et al 2008) the velocity field for And IV is one of the most symmetric and undisturbed velocity fields of a faint dwarf galaxy.
4.1 HI rotation curve
Rotation curves of And IV were derived using 44, 26 and 12 resolution velocity fields, using tilted ring fits. The center and systemic velocity for the galaxy obtained from a global fit to the various resolution velocity fields matched within the error bars; the best fit systemic velocity of 234.01.0 matches well with the value obtained from the global HI profile of the galaxy. Keeping the center and systemic velocity fixed, we fitted for the inclination and position angle (PA) in each ring. For all resolution velocity fields, the PA was found to vary from and the inclination varied from . Keeping the PA fixed to 310∘ at all radii and inclination fixed to 62∘ in the inner regions (upto 100) and 52∘ in the outer regions, the rotation curves at various resolutions were derived. Fig. 6 shows the rotation curve of the galaxy derived at various resolutions the rotation curves at various resolutions match within the errorbars. A hybrid rotation curve for And IV is obtained by using the 12 resolution velocity field in the inner regions and the low resolution velocity fields in the outer regions. The rotation curves were also derived at different resolutions using the approaching and receding halves of the galaxy separately. The rotation curve in the inner regions of the galaxy, derived for each half, was found to be somewhat different from the curve derived using the whole galaxy (Fig. 7). For the purpose of mass modelling we have used a mean of the rotation curves for the two sides. The adopted hybrid mean rotation curve is shown as a solid line in Fig. 7. The errorbars on the mean rotation curve were obtained by adding quadratically the uncertainty reported by the tilted-ring fit as well as the difference in rotation velocities between the approaching and receding side. The ”asymmetric drift correction” (see e.g. Begum et al. (2003) for a discussion of the asymmetric drift correction to rotation curves of dwarf galaxies) was found to be small compared to the errorbars at all radii and hence ignored. The rotation curve shows a flattening beyond 150′′; And IV is one of the faintest known dwarf galaxy to show a clear flattening of the rotation curve.


4.2 Mass Models
Mass models for the galaxy were constructed using the GIPSY task rotmas. The galaxy was modelled as consisting of 3 components, a stellar disk, a gas disk and dark matter halo. The structural parameters of the stellar disk were fixed using the photometry in I-band presented in this paper. The remaining parameter required for mass modelling is the mass to light ratio of the stellar disk. Leaving this as a free parameter in the fit lead to unphysical results. We hence fix it to a value of 0.7, which is reasonable given the colors of the galaxy (The M/L ratio derived from the B-V color and from the Bell & de Jong (2001) model with low metallicity (Z=0.02), Bruzual Charlot SPS model using a modified Salpeter IMF, is 0.74). In any case, the stellar disk is dynamically not dominant, and varying the mass to light ratio by a factor of 2 changes the deduced parameters of the dark matter halo by . The rotation velocity of the gas disk was determined from the measured surface density of the disk. The HI surface density was multiplied by a factor of 1.3 to account for the presense of primordial helium. The molecular gas content of dwarf galaxies is expected to be small (see e.g. Taylor et al. 1998; Cormier et al. 2014) and we hence neglect it in the mass modelling. Two different mass models were constructed, one which assumed that the halo profile is that of a modified iso-thermal halo, and the other which assumes that the halo has an NFW type profile. The two fits are shown in Figs. 8 and 9. The reduced for the iso-thermal profile fit (0.37) is more than a factor of two smaller than that for the NFW halo. For the iso-thermal halo the best fit core density and core radius are 52.4 Msun/pc-2 and 0.953 kpc, while for the NFW halo the best fit gives a concentration parameter and R kpc. From the scaling relations for LCDM halos (see e.g. Bullock 2001; Bottema 2015) the expected concentration parameter is
| (1) |
From the rotation curve the maximum rotation velocity is which gives the expected value of , significantly different from what we get from the best fit. In fact a concentration parameter is unable to give a reasonable fit the rotation curve for any value of R200. We also note that the fact that the iso-thermal halo provides the best fit to the rotation curve supports models in which feed back from star formation leads to the formation of cores in the centres of dwarf galaxies (e.g. Governato et al. 2010). Since the biggest difference between the fit of the isothermal and the NFW profile usually seen in the galaxy center, we analyzed also the effect of the HI data resolution on this difference as well as the effect of a separate fit for the approaching and receeding sides. Both the effects are found to be negligible to explane the discussed difference.
Finally, in Fig. 10 we show the expected rotation curve under the MOND hypothesis (Milgrom, 1983). As can be seen, the fit is quite poor, even though the Mass to Light ratio of the stellar disk has been left as a free parameter in the fit. The best fit values of the mass to light ratio are (in solar units), and the best fit MOND a0 parameter is cm s-2. Although the fit quality is very poor compared to that for the Isothermal and NFW halos (the reduced is 2.2), we note that the best fit value for a0 agrees within error bars with the fiducial value of cm s-2 (Begeman, Broeils & Sanders, 1991).
From the rotation curve, the total dynamical mass of And IV is Msun. The total hydrogen mass is given by where in Mpc and the total galaxy flux in Jy km/s ( Roberts & Haynes, 1994). Using the measurement of Jy km/s by Braun et al. (2003) we derive the hydrogen mass to be Msun. The total gas mass (including the mass of helium) is Msun. This quantity is more than one order larger than the total stellar mass of And IV, viz. (UNGC). Within the last measured point of the rotation curve, the ratio of the baryonic mass to the total mass is . With the new estimates of apparent blue magnitude and the distance, the absolute magnitude of And IV equals to that yields the hydrogen mass-to-blue luminosity ratio and the total mass-to-luminosity ratio . Both quantities are among the highest for any known galaxy. The basic observed and distance-dependent properties of And IV are summarized in Table 1.


One can ask whether the extremely gas rich dwarf galaxies have abnormally small baryon fractions, i.e. have they just been inefficient at forming stars, or did they end up with less than the typical baryon fraction? The ratio of baryonic-to-dark matter is expected to systematically vary with halo mass, since small halos are both inefficient at capturing hot baryons during the epoch of reionization and also because small halos easely loose baryons as a consequence of energy input from star formation. Taking into account a correction for abundance of helium and molecular gas we obtain the baryon fraction (as determined at the last measured point of the rotation curve) to be . As can be seen, the baryonic fraction in And IV is fairly close to the average cosmic baryon fraction (cosmic) = 0.15 (Planck collaboration, 2015). As such, the And IV has got its “fair share” of baryons, but for some reason has been unable to convert them into stars.
5 Spatial environment and SFR.
The dwarf system And IV resides in a region of low spatial density by number of galaxies. Its nearest neighbors are the Sc galaxy NGC 7640 with absolute magnitude at a 3D-separation of 2.0 Mpc, and the pair of galaxies NGC 672/ IC 1727 with separated by 2.2 Mpc. The mean density of stellar matter in a sphere of 1 Mpc radius around And IV consists of 1/25 of the mean cosmic stellar density, which indicates the severe isolation of And IV.
Observations in the line by Ferguson et al. (2000) and Kaisin & Karachentsev (2006) found five emission knots, with integral flux corresponding to a star formation rate of log /yr). The estimate of via a flux in the far ultraviolet (Gil de Paz et al. 2007, Lee et al. 2011) is 5 times greater: /yr) that is typical for dIrr of low mass (Lee et al. 2011, Fumagalli et al. 2011, Weisz et al. 2012). This difference is partially caused by stars of different age (temperature), depending on the details of starformation history on scales of 10 and 100 Myrs (Calzetti 2013). The corresponding estimates of the specific star formation rates are and /yr) being comparable with the value of Hubble parameter, /yr.
Pustilnik et al (2008) carried out spectral observations of two HII-regions in And IV and found their metallicity to be 1/14 the solar value. The presence of a significant amount of neutral hydrogen, a moderate activity of star formation and a low metallicity are typical features of isolated dwarf irregular galaxies (Huang et al. 2012, Karachentsev & Kaisina 2013, Cannon et al. 2015).
6 And IV among other gas-rich galaxies in the Local Volume.
At present, the UNGC catalog is the most representative sample of galaxies limited by galaxy distance, but extending to faint apparent magnitudes and HI-flux. Dwarf galaxies, in particular gas-rich systems, are the major constituent of the UNGC. Among eight hundred UNGC galaxies we selected 16 that satisfy the condition:
where is the apparent blue magnitude of a galaxy corrected for Galactic extinction, and is its 21-cm line flux in magnitudes as defined in HyperLeda (Paturel et al. 1996). Assuming the stellar mass of a galaxy expressed via its luminosity in the K-band is (Bell et al. 2003), we derive
For the dwarf galaxies of dIrr, dIm types there is a relation (Jarrett et al. 2003). Therefore, for dIrr galaxies, the condition corresponds to the ratio:
In other words, the hydrogen mass of these galaxies exceeds their stellar mass by at least a factor three.
Basic observables of the 16 galaxies selected from UNGC and ranked by the value are given in Table 2. Its columns contain: (1) galaxy name, (2) apparent blue magnitude, (3) Galactic extinction in the B-band (Schlafly & Finkbeiner, 2011), (4) the mean surface brightness in the B-band within the Holmberg radius, (5) radial velocity (km/s) in the Local Group rest frame, (6) the 21-cm line flux in magnitudes, (7) HI line width (km/s), measured at the 50% level from the maximum, (8) distance in Mpc, (9) stellar mass in solar units, (10) hydrogen mass in solar units, (11) the tidal index, used in UNGC, with negative values corresponding to isolated galaxies, (12) hydrogen-to-stellar mass ratio, (13) difference of the optical and 21-cm magnitudes used for the object selection. We excluded from this list 4 dwarf galaxies: BK3N, Holmberg IX, d0226+3325 and DDO 169NW, having but locating in contact with brighter neighbors, because their HI-flux is difficult to separate from the HI-dominant galaxy.
It should be mentioned, that apparent magnitudes of some faint galaxies (for instance, AGC208387, AGC208399) have been estimated visually with a typical error of . Note also, that the present list of HI-richest galaxies in the Local Volume may be still incomplete.
The last line in Table 2 presents the mean observables for the 16 objects that are discussed. Gas-rich galaxies are dwarf systems with a characteristic stellar mass of = 7.14 dex, HI-line width of 45 km/s, a low surface brightness of 25.5, and the HI-mass-to-stellar mass ratio of 5.0. Judging by the mean value of the tidal index, , the majority are well isolated galaxies. The isolated dIrr galaxy And IV is one of the three most gas-rich galaxies in the Local Volume. Some other galaxies from Table 2: ESO215-009, KK144, DDO143, KK195, have been already studied in HI with high angular resolution (Warren et al. 2004, Begum et al. 2008). It will be interesting to obtain detailed maps of HI-density and velocity fields for other objects of the sample.
Acknowledgements.
The Space Telescope Science Institute provided support in connection with observations on Hubble Space Telescope with program GO–13442. We thank the staff of the GMRT who made these observations possible. The GMRT is operated by the National Center for Radio Astrophysics of the Tata Institute of Fundamental Research. The work in Russia is supported by the grant of the Russian Scientific Foundation 14–12–00965 and the RFBR grant 15–52–45004. LNM acknowledge the support from RFBR grant 13–02–00780 and Research Program OFN of the Division of Physics, Russian Academy of Sciences.References
- [1] Begeman K.G., Broeis A.H., Sanders R.H., 1991, MNRAS, 249, 523
- [2] Begum A., Chengalur J.N., Karachentsev I.D., Sharina M.E., Kaisin S.S., 2008, MNRAS, 386, 1667
- [3] Begum A., Chengalur J.N., Karachentsev I.D., 2005, A&A, 433, 1
- [4] Begum A., Chengalur J.N., Hopp U., 2003, NewA, 8, 267
- [5] Bell E.F., McIntosh D.H., Katz N., Weinberg M.D., 2003, ApJS, 149, 289
- [6] Bell E.F., de Jong R.S., 2001, ApJ, 550, 212
- [7] Bender R., Moellenhoff C., 1987, A&A, 177, 71
- [8] Bottema R., Pestaña J. L. G., 2015, MNRAS, 448, 2566
- [9] Braun R., Thilker D., Walterbos R.A.M., 2003, 406, 829
- [10] Bullock J. S., Kolatt T. S., Sigad Y., Somerville R. S., Kravtsov A. V., Klypin A. A., Primack J. R., Dekel A., 2001, MNRAS, 321, 559
- [11] Calzetti D., 2013, in ”Secular evolution of galaxies”, eds. J.Falcon-Barroso & J.H. Knapen, p. 419
- [12] Cannon J.M., Martinkus C.P., Leisman L., Haynes M.P., Adams E.A., Giovanelli R., 2015, AJ, 149, 72
- [13] Chengalur J.N., Pustilnik S.A., 2013, MNRAS, 428, 1579
- [14] Chengalur J.N., Begum A., Karachentsev I.D., Sharina M., Kaisin S., 2008, in ”Galaxies in the Local Volume”, Springer, eds. Koribalski B.S.& Jerjen H., p.65
- [15] Cormier D., et al., 2014, A&A, 564, A121
- [16] de Vaucouleurs G., 1959, Handbuch der Physik, 53, 275
- [17] Dolphin A. E., 2002, MNRAS, 332, 91
- [18] Ferguson A.M., Gallagher J.S., Wyse R.F., 2000, AJ, 120, 821
- [19] Fumagalli M., Da Silva R.L., Krumholz M.R., 2011, ApJL, 741, L25
- [20] Gil de Paz A., et al., 2007, ApJS, 173, 185
- [21] Governato F., Brook F., Mayer L. et al., 2010, Nature, 463, 203
- [22] Huang S., Haynes M.P., Giovanelli R., Brinchmann J., Stierwalt S., Neff S.G., 2012, AJ, 143, 133
- [23] Jarrett T.H., Chester T., Cutri R., Schneider S. E., Huchra J. P., 2003, AJ, 125, 525
- [24] Kaisin S.S., Karachentsev I.D., 2006, Ap, 49, 287
- [25] Karachentsev I.D., Makarov D.I., Kaisina E.I., 2013, AJ, 145, 101
- [26] Karachentsev I.D., Kaisina E.I., 2013, AJ, 146, 46
- [27] Karachentsev I.D., Makarov D.I., Karachentseva V.E., Melnyk O.V., 2008, AstL, 34, 832
- [28] Lee J.C., Gil de Paz A., Kennicutt R.C., et al. 2011, ApJS, 192, 6
- [29] Makarov D., Makarova L., Rizzi L., Tully R. B., Dolphin A. E., Sakai S., Shaya E. J., 2006, AJ, 132, 2729
- [30] Makarova L.N., 1999, A&AS, 139, 491
- [31] Milgrom M., 1983, ApJ, 270, 365
- [32] Paturel G., Bottinelli L., Fouque P., Gouguenheim L., 1996, Catalogue of Principal Galaxies: PGC-ROM, Observatoire de Lyon
- [33] Planck Collaboration, 2015, arXiv:1502.01589
- [34] Pustilnik S.A., Tepliakova A.L., Kniazev A,Y., Burenkov A.N., 2008, AstBu, 63, 102
- [35] Rizzi L., Tully R. B., Makarov D., Makarova L., Dolphin A. E., Sakai S., Shaya E. J., 2007, ApJ, 661, 815
- [36] Roberts M.S., Haynes M.P., 1994, ARA&A, 32, 115
- [37] Roberts M.S., 1969, AJ, 74, 859
- [38] Schlafly E. F., Finkbeiner D. P., 2011, ApJ, 737, 103
- [39] Sirianni M., Jee M. J., Ben´ıtez N., Blakeslee J. P., Martel A.R., Meurer G., Clampin M., De Marchi G., Ford H. C., Gilliland R., Hartig G. F., Illingworth G. D., Mack J., McCann W. J., 2005, PASP, 117, 1049
- [40] Swarup G., Ananthakrishnan S., Kapahi V. K., Rao A. P., Subrahmanya C. R., Kulkarni V. K., 1991, CuSc, 60, 95
- [41] Taylor C. L., Kobulnicky H. A., Skillman E. D., 1998, AJ, 116, 2746
- [42] van den Bergh S., 1972, ApJ, 171, L31
- [43] Warren B.E., Jerjen H., Koribalski B.S., 2007, AJ, 134, 1849
- [44] Warren B.E., Jerjen H., Koribalski B.S., 2004, AJ, 128, 1152
- [45] Weisz D.R., Johnson B.D., Johnson L.C., et al. 2012, ApJ, 744, 44
| Parameter | Value (error) | Reference |
|---|---|---|
| R.A.,Dec.(J2000.0) | 004232.3+403418 | van den Bergh S., 1972 |
| Galactic extinction in B, mag | 0.22 | Schlafly & Finkbeiner, 2011 |
| Internal extinction in B, mag | 0.04 | UNGC |
| Morphological type | Ir–LSB | UNGC |
| Tidal Index, | –1.9 | UNGC |
| , mag | 16.64 (0.10) | this study |
| 0.46 (0.05) | this study | |
| , mag arcsec-2 | 24.1 (0.1) | this study |
| Holmberg diameter, arcmin | 0.90 (0.03) | this study |
| Scale length, arcsec | 13 (1) | this study |
| , km/s | 234 (1) | this study |
| , km/s | 90 (2) | Begum et.al, 2008 |
| S(HI), Jy km/s | 22.4 (0.5) | Braun et.al, 2003 |
| HI-diameter, arcmin | 7.6 (0.5) | Begum et.al, 2008 |
| HI-axial ratio | 0.61 (0.02) | this study |
| , mag | 2.38 (0.15) | this study |
| m(FUV) | 17.90 (0.10) | Lee et al, 2011 |
| flux, erg/cm2 sec | –13.88 (0.07) | Kaisin & Karachentsev, 2006 |
| Distance, Mpc | 7.17 (0.31) | this study |
| , mag | -12.91 (0.10) | this study |
| Holmberg diameter, kpc | 1.88 (0.06) | this study |
| 7.44 | UNGC | |
| 8.43 | Braun et.al, 2003 | |
| 9.53 | this study | |
| –3.12 (0.07) | Kaisin & Karachentsev, 2006 | |
| –2.42 (0.04) | Lee et al, 2011 |
| Galaxy | SB | |||||||||||
|---|---|---|---|---|---|---|---|---|---|---|---|---|
| ESO215-009 | 16.0 | 0.95 | 25.6 | 290 | 12.4 | 65 | 5.25 | 7.74 | 8.82 | -1.2 | 1.08 | 2.65 |
| AGC208399 | 20.0 | 0.12 | 24.6 | 561 | 17.3 | 31 | 10.1 | 6.94 | 8.04 | -2.3 | 1.10 | 2.58 |
| And IV | 16.6 | 0.26 | 25.6 | 503 | 14.0 | 90 | 7.17 | 7.44 | 8.43 | -1.9 | .99 | 2.38 |
| VCC0169 | 17.7 | 0.08 | 25.9 | 2094 | 15.6 | 24 | 9.4 | 7.16 | 8.04 | -0.3 | .88 | 2.02 |
| KKH38 | 17.4 | 0.40 | 26.5 | 518 | 15.4 | 58 | 10.2 | 7.46 | 8.18 | -2.6 | .72 | 1.60 |
| LeoT | 16.5 | 0.13 | 26.6 | -97 | 14.9 | 15 | 0.42 | 4.94 | 5.63 | 0.7 | .69 | 1.47 |
| AGC205268 | 17.4 | 0.13 | 23.8 | 1001 | 15.9 | 70 | 10.4 | 7.38 | 8.03 | 1.1 | .65 | 1.37 |
| KK195 | 17.1 | 0.27 | 24.8 | 345 | 15.5 | 24 | 5.22 | 6.96 | 7.56 | 0.9 | .60 | 1.33 |
| DDO143 | 16.0 | 0.08 | 26.2 | 616 | 14.6 | 50 | 9.1 | 7.80 | 8.43 | -0.5 | .63 | 1.32 |
| LV J0926+3343 | 17.8 | 0.08 | 25.9 | 492 | 16.4 | 47 | 10.3 | 7.85 | 8.37 | -1.5 | .52 | 1.32 |
| KK144 | 16.5 | 0.09 | 25.3 | 449 | 15.1 | 38 | 6.2 | 7.27 | 7.86 | -0.9 | .59 | 1.31 |
| AGC208397 | 19.7 | 0.17 | 24.3 | 573 | 18.3 | 33 | 10.2 | 7.28 | 7.83 | -3.0 | .55 | 1.23 |
| LSBC D564-08 | 17.9 | 0.12 | 25.7 | 366 | 16.7 | 49 | 8.67 | 7.02 | 7.52 | -0.3 | .50 | 1.08 |
| KDG192 | 16.6 | 0.06 | 25.3 | 544 | 15.5 | 69 | 7.4 | 7.38 | 7.88 | -0.1 | .50 | 1.04 |
| UGCA292 | ф 16.1 | 0.07 | 24.7 | 306 | 15.0 | 27 | 3.61 | 6.73 | 7.44 | -0.6 | .71 | 1.03 |
| KDG215 | 16.9 | 0.09 | 25.8 | 362 | 15.8 | 25 | 4.83 | 7.01 | 7.50 | -0.7 | .49 | 1.01 |
| Mean | 17.2 | 0.19 | 25.5 | 557 | 15.5 | 45 | 7.40 | 7.14 | 7.84 | -1.0 | .70 | 1.55 |