The Blazhko phenomenon
Abstract
In spite of the accumulating high quality data on RR Lyrae stars, the underlying cause of the (quasi)periodic light curve modulation (the so-called Blazhko effect) of these objects remains as mysterious as it was more than hundred years ago when the first RR Lyrae observations were made. In this review we briefly summarize the current observational status of the Blazhko stars, discuss the failure of all currently available ideas attempting to explain the Blazhko effect and finally, we contemplate on various avenues, including massive 2-3D modeling to make progress. Somewhat unconventionally to a review, we present some new results, including the estimate of the true incidence rate of the fundamental mode Blazhko stars in the Large Magellanic Cloud, and tests concerning the effect of the aspect angle on the observed distribution of the modulation amplitudes for Blazhko models involving nonradial modes.
Konkoly Observatory, Budapest, Hungary
1. Introduction
Cepheids and RR Lyrae stars have always played an invaluable role in mapping the Universe and tracing the kinematical and physical properties of various stellar populations. With the advance of the Gaia mission, in a few years’ time we will be able to fix the zero points of the period-luminosity-color or period - near infrared magnitude relations with an error lower than mag (Windmark et al. 2011) and thereby measure distances in the nearby Universe with an unprecedented accuracy. Although the physics behind the basic properties (such as their self-excitation mechanism) of these vital objects are well known for more than half of a century, there is a nearly complete lack of understanding two, well-populated subgroups of these variables. These subgroups are those of the double-mode pulsators (both among Cepheids and RR Lyrae stars) and the Blazhko variables (characteristically among RR Lyrae stars). Although the modes occurring in the ‘classical’ double-mode variables are well-identified with the low-order modes from the linear theory111Although this statement is true for the fundamental/first overtone pulsators, the nature of the newly discovered class with period ratios of – is a mystery (see Netzel et al. 2015, and references therein)., the clear cause of the sustained double-mode state is still unknown and nonlinear modeling is controversial (see Kolláth et al. 2002 vs. Smolec & Moskalik 2010). The situation with the Blazhko stars (RR Lyrae variables showing periodic amplitude and phase modulations) is even worse. As of this writing, we do not have a clue why many RR Lyrae stars vary their amplitudes that leads in some cases nearly ceasing pulsation in the low-amplitude states. This is not just a minute wrinkle spoiling the classical and simple picture on these old stars. On the opposite, with no physically justified and testable idea/model we miss some basic ingredient not just in the pulsation models but most likely in the evolutionary models, too.
No detailed accounts are to be given in this summary on the observational properties and failed modeling of these objects. On these we refer to the review by Kovács (2009) from the pre-Kepler era and those by Kolenberg (2011) and Szabó (2014) more recently, already incorporating the results of the Kepler mission. We list some obvious (but strenuous) avenues for future works, including detailed spectroscopic studies and higher dimension hydrodynamical surveys of RR Lyrae models. Unconventionally, we present some new results concerning the simple consequences of the observed distributions of modulation amplitudes.
2. How many are they?
Here we focus on the fundamental mode (RRab) variables, since their considerably larger number and higher amplitudes yield statistically more reliable samples than those available for the first overtone stars. The basic rates and related data are summarized in Table 1.
| System | Rate | # stars | Note |
|---|---|---|---|
| Galactic field | 5% | 1435 | ASAS; Szczygiel & Fabrycky (2007)1 |
| 47% | 30 | ground-based; Jurcsik et al. (2009) | |
| 39% | 44 | Kepler; Szabó (2014)2 | |
| 60% | 13 | CoRoT; Szabó et al. (2014) | |
| 34% | 268 | ASAS & WASP; Skarka (2014) | |
| Galactic bulge | 23% | 215 | OGLE-I; Moskalik & Poretti (2003) |
| 25% | 1942 | OGLE-II; Mizerski (2003) | |
| 30% | 11756 | OGLE-III; Soszynski et al. (2011)3 | |
| M3 | 50% | 200 | ground-based; Jurcsik et al. (2014) |
| LMC | 12% | 6135 | MACHO; Alcock et al. (2003) |
| 8% | 478 | OGLE-III; Chen et al. (2013)4 | |
| 20% | 17693 | OGLE-III; Soszynski et al. (2009)3 | |
| SMC | 22% | 1933 | OGLE-III; Soszynski et al. (2010)3 |
Notes:
1 The low incidence rate is most probably accounted for by the lower
sampling rate and the higher noise in the then available release of the
ASAS database.
2 See Benkő et al. (2014) for a slightly lower incidence rate.
3 No details are given.
4 Strange low incidence rate in spite of the high-quality data selection.
What is clear from this table is that Blazhko (BL) stars are numerous in various stellar populations and the actual figures suggest internal differences among them (e.g., LMC vs. Galactic field). It is interesting that traditional ground-based surveys yield rates close to the ones derived by the orders of magnitude more accurate space missions.222Note that the Konkoly BL survey by Jurcsik and co-workers was based on the observations made by a cm telescope, whereas wide-field transit/variability surveys operate – cm-class telescopes. This suggests that the relative number of BL stars with low modulation amplitudes is small. Indeed, from the BL stars of the Kepler sample discussed by Benkő et al. (2014) only two show modulation amplitudes lower than mag. This is a remarkable property, indicating the existence of some lower floor of the amplitude modulation and suggesting that reliable statistics can be derived also from the today’s ground-based surveys capable of hitting the detection limit for sinusoidal signals with amplitudes of – mag.
2.1. The debiased incidence rate in the LMC
We see from Table 1 that the incidence rates in both Magellanic Clouds are systematically lower that those derived in the Galactic bulge and, especially, in the Galactic field (GF). There is also a significant difference between the MACHO and OGLE rates. Since both rates are based on fairly large samples, we suspect that the difference is due to the higher accuracy of the OGLE data as they evolved over the years after the MACHO project was abandoned. In the following we correct the MACHO statistics for the lower detection rates and examine if it leads to an agreement with the OGLE rates.
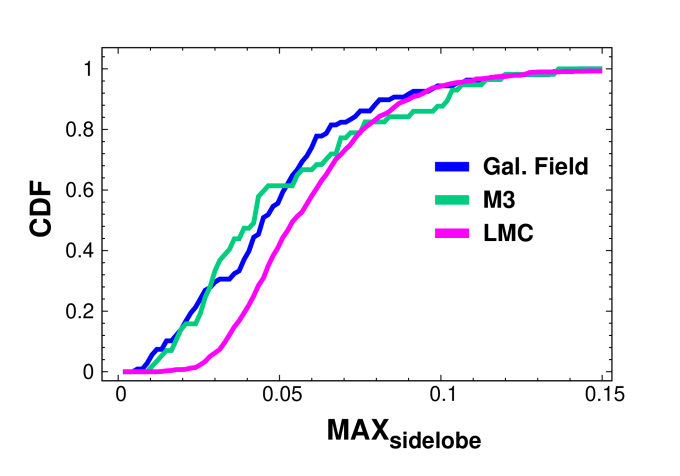
First we compute the Cumulative Distribution Function (CDF) of the maximum Fourier side lobes available from the published data (Alcock et al. 2003 [LMC]; Jurcsik et al. 2014 [M3] and Skarka 2014 [GF]). Recall that CDF denotes the probability that the modulation amplitude is smaller than a given value, i.e., . Figure 1 shows the resulting CDFs, clearly indicating a want of the low-amplitude BL stars in the LMC sample. With similar observational noise, the BL stars in M3 and in the GF seem to follow the same distribution (we do not deal with the small differences at this stage).
We test the hypothesis that BL stars both in the LMC and in the GF follow the same intrinsic CDF and the difference is entirely attributed to the lower detection efficiency on the noisier MACHO data. In a simple approach the test can be performed by injecting sinusoidal signals in the time series consisting the Gaussian noise, generated according to the standard deviations of the residuals (particular to each star) in the single mode RR Lyrae sample. Instead of generating and then analyzing these time series, we estimate the signal-to-noise ratio (SNR) of a sinusoidal component with amplitude , data point number and noise standard deviation
| (1) |
We tested the applicability of this formula by comparing the above parameter with the S/N of the frequency spectra. We found good correlation, and set the lower limit of SNR to to fix the detection rate equal to the one obtained directly from the frequency spectra.
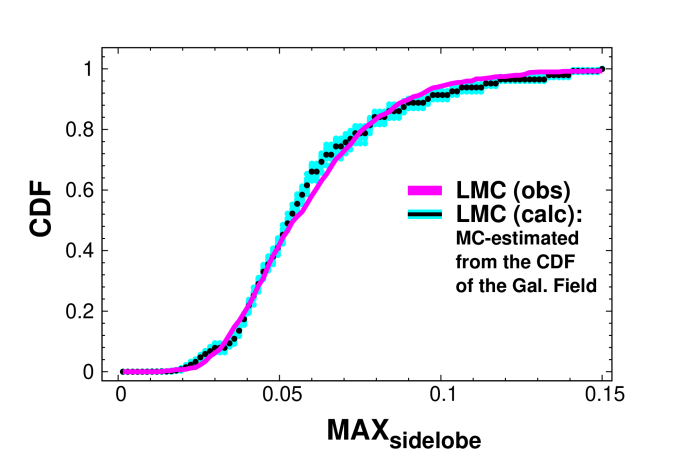
After generating amplitudes following the CDF of the GF BL stars, many realizations are tested by using the standard deviations of the residuals in some monoperiodic stars from the MACHO LMC sample. Each star is checked for the detection criterion and flagged as ‘detected’ or ‘not detected’ accordingly. Since the amplitudes are known, we are able to construct the CDF for the detected cases. The result is shown in Fig. 2. We see that using the noise properties of the MACHO data on the CDF of the GF BL stars, the resulting CDF becomes very similar to the observed CDF of the LMC. This suggests that the distribution of the modulation amplitudes is likely the same in the two populations.
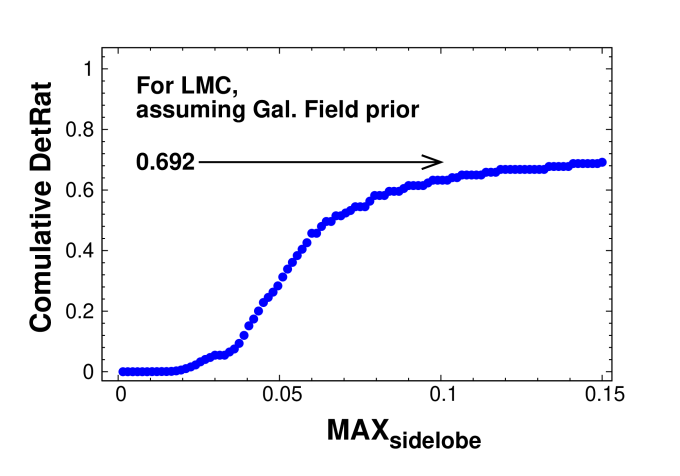
The true incidence rate for the LMC can be calculated from the unnormalized version of the CDF based on the amplitude distribution of the GF (black dots in Fig. 2). This cumulative detection rate (see Fig. 3) yields a factor of for the total detection rate. This, with the observed rate of % of Alcock et al. (2003) results in an unbiased incidence rate of %. Considering the values listed in Table 1, we see a better (though not perfect) agreement with the values obtained from the more accurate OGLE data for both Clouds. This test supports the idea that the lower incidence rate in the Magellanic Clouds is real and that there is a likely population dependence of the occurrence of BL stars.
2.2. Modeling the distribution of the modulation amplitudes
With the recent sample of the GF BL stars by Skarka (2014) and the already existing large amount of data on the Magellanic Clouds, we are in a position to test a simple BL model involving the nonradial components. We recall that in the basic model of the BL effect this nonradial mode is the one that is most viable for a resonant interaction with the fundamental radial mode (see Van Hoolst et al. 1998). The coupling gives rise to a steady (constant amplitude) triple-mode pulsation with the radial fundamental, and the , and nonradial modes (see Nowakowski & Dziembowski 2001). The interaction leads to a phase-locked, that is single-period pulsation. The amplitude modulation is due to the changing sky-projected area with the nonradial component of the rotating star. Although in this simple form this model is unable to explain asymmetric modulation side lobes, it is still interesting how the observed distribution of the modulation amplitudes look like if the above mode pattern played some role in the BL phenomenon.
Following Dziembowski (1977), the observed luminosity variation of a nonradially pulsating star can be written in the following form (the abbreviated form of his Eq. 6)
| (2) |
Here , and are, respectively, the surface amplitude, frequency and phase of the nonradial mode. The factor is the associated Legendre polynomial, depending on the mode order, degree and the inclination angle ( if the rotational axis is perpendicular to the line of sight). In the simple case of the mode, this factor is just a sine function. Below we examine the effect of this factor on the observed distribution of the amplitude modulation, assuming different priors for the distributions of the underlying nonradial mode amplitudes and a uniform prior for inclination angle.
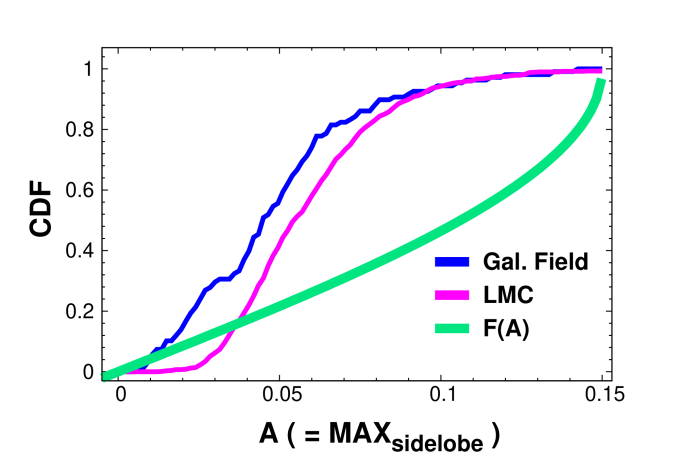
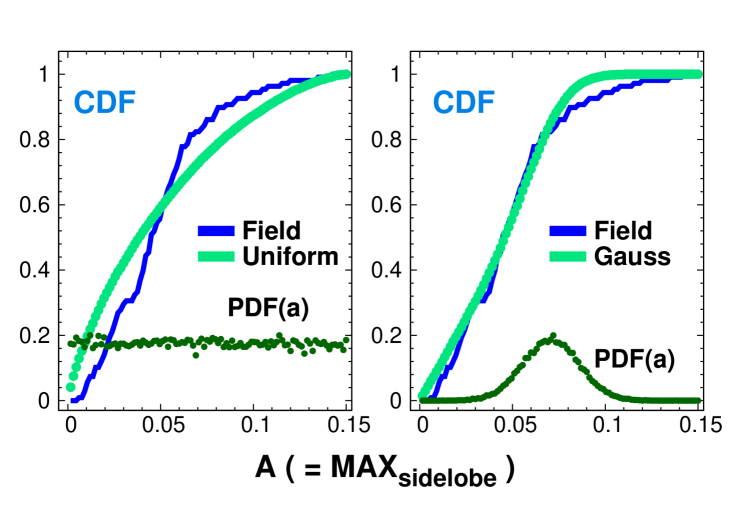
First we assume that all BL stars have the same modulation amplitude and the observed amplitude is merely affected by the aspect angle. This, admittedly not too likely scenario leads to the theoretical CDF shown in Fig. 4. It is comforting that we can clearly exclude the extreme mechanism that might lead to such a particular amplitude distribution. Next, we consider the physically more likely setting, when all amplitudes in occur with the same probability (here is the maximum possible modulation amplitude – which, as noted earlier, we take as the maximum sidelobe in the Fourier spectra). As shown in Fig. 5, this is a better-fitting model but still shows characteristic deviations by under/over-estimating the observed distribution at high/low modulation amplitudes.
Finally, we assume that low/high modulation amplitudes are intrinsically of low probability. This situation is modeled by a Gaussian distribution peaked at . We see on the right panel of Fig. 5 that this assumption yields a considerably better fit, although the high-amplitude part of the distribution is now overestimated. From these results we conclude that even if the BL phenomenon is affected by an aspect-dependence, there should exist some mechanism that prefers mid-size modulations and makes low/high modulations much less likely.
3. Properties to be explained and the failure to do so
There are many intriguing properties of the BL stars and it is obviously impossible to list them all here. What might perhaps still be useful is to focus on the more general, robust properties, that are inescapable to deal with in any future modeling. We list these properties in Table 2 with some sort of ranking based on a mixture of the size and/or the commonality of the given property. We do not know which feature will finally unveil the secret of the BL phenomenon but at this stage our preference goes to those ideas/models that offer some solution to reproduce the first three/four properties.
| # | Property | Referencea |
|---|---|---|
| 1 | High (–%) incidence rate | these proceedings |
| 2 | Cases of high modulations () | Sódor et al. (2012) |
| 3 | High rates of strongly asymmetric side lobesb | Alcock et al. (2003) |
| 4 | Range of modulation time scales (– d) | Benkő et al. (2014) |
| 5 | Intermittent amplitude alternationc | Szabó et al. (2010) |
| 6 | Role of the 1st overtone and multimodality | Smolec et al. (2015) |
| 7 | Occurrence of multiperiodic modulations | Skarka (2013) |
| 8 | Chaotic/stochastic effects? | Plachy et al. (2014) |
Notes:
a The references are not complete. They are merely shown for guidance.
b By the loose term ‘strongly asymmetric’ we mean those cases when
one of the side lobes is close to the noise level. The number of these
stars may also depend on the stellar population (i.e., for the LMC this
ratio is %, whereas for the GF it is % – see Skarka 2014).
At lower noise level they may exhibit both side lobes but they remain
quite different.
c The phenomenon is commonly called in the RR Lyrae community as
‘period doubling’. We think that unless it can be clearly related to the
first step on the route of bifurcation to chaos, it is more appropriate
to call ‘amplitude alternation’, since the expression ‘period doubling’ is
specifically attached to the process mentioned (Feigenbaum 1983).
We also note the systematic frequency displacements at the positions of
the expected half integer resonances in some well-studied cases
(Bryant 2015) are also atypical of period doubling.
For the currently available models/ideas, here is a brief summary of the main reasons of their failure in their present forms.333We list only the most striking deficiencies of the models/ideas and refer to earlier reviews for a more extended discussion.
Magnetic oblique rotator/pulsator: Shibahashi (2000): symmetric sidelobes only, lack of strong magnetic field.
Nonresonant radial/nonradial double-mode pulsator: Cox (2013): questions about the strength of the excitation of the nonradial mode and about the reasons why the close radial and nonradial modes are not phase-locked, leading to monoperiodic pulsation.
Resonant nonradial rotator/pulsator: Nowakowski & Dziembowski (2001): symmetric sidelobes only, questions concerning the current forms of amplitude equations in the case of nonradial modes in RR Lyrae models (Nowakowski & Dziembowski 2003).
Radial mode resonance of 9:2 : Buchler & Kolláth (2011): lack of modulation in the RR Lyrae nonlinear hydrodynamical models.
Magnetic dinamo-driven convection: Stothers (2011): lack of mathematical/physical rigor and any modeling444See Smolec et al. (2011) and Molnár et al. (2012) for some negative hydrodynamical tests of this idea..
Periodic energy dissipation driven by shock wave dynamics: Gillet (2013): the idea is based on the analysis of standard 1D hydrodynamical models showing no amplitude modulation, therefore it is unclear what kind of mechanism could be deciphered from these models that might be relevant for future modeling.
4. Future progress: Can further observations or 3D modeling help?
Because of the lack of any, physically sound idea, it is hard to point toward any direction in which progress can be made. Nevertheless, we can mention two areas that are still not investigated with the depth required for getting useful information for model building. From the side of the observations, it would be vital to find out if there is any nonradial component. If yes, then does its size correlate with the amplitude of the Blazhko effect? It is a hard observational project (faint objects, long-term data acquisition, need for high-dispersion spectroscopy, difficulties in disentangling the nonradial component in the presence of the large radial, time-dependent component, etc.). From the side of modeling – again, due to the lack of any better guidance – one may try to conduct some expensive survey of the already existing 2D/3D hydrodynamical models (e.g., Mundprecht et al. 2015 and Geroux & Deupree 2015), and investigate the effect of better modeled convection or that of the rotation. Of course, due to the well-known attribute of serendipity of scientific discoveries, it might well be that we find something completely unexpected in the course of other studies that will finally lead to the long-waited understanding of this exceptional hydrodynamical phenomenon.
Acknowledgements
My life-long appreciation and gratitude go out to my mentor and long-time friend Wojtek who introduced me into the exciting field of nonlinear stellar pulsations and gave me his support and encouragement over the years.
References
- Alcock et al. (2003) Alcock, C., Alves, D. R., Becker, A., et al. 2003, ApJ, 598, 597
- Benkő et al. (2014) Benkő, J. M., Plachy, E., Szabó, R., et al. 2014, ApJS, 213:31
- Bryant (2015) Bryant, P. H. 2015, arXiv1501.06485
- Buchler & Kolláth (2011) Buchler, J. R., Kolláth, Z. 2011, ApJ, 731, 24
- Chen et al. (2013) Chen, B.-Q., Jiang, B.-W., Yang, M. 2013, Res. in Astron. & Astroph., 13, 290
- Cox (2013) Cox, A. N. 2013, ASSP, 31, 77
- Dziembowski (1977) Dziembowski, W. 1977, AcA, 27, 203
- Feigenbaum (1983) Feigenbaum, M. J. 1983, Physica D, Vol. 7, Issues 1-3, p. 16
- Geroux & Deupree (2015) Geroux, C. M., Deupree, R. G. 2015, ApJ, 800:35
- Gillet (2013) Gillet, D. 2013, A&A, 554, 46
- Jurcsik et al. (2009) Jurcsik, J., Sódor, Á., Szeidl, B., et al. 2009, MNRAS, 400, 1006
- Jurcsik et al. (2014) Jurcsik, J., Smitola, P., Hajdu, G., et al. 2014, ApJ, 797:L3
- Kolenberg (2011) Kolenberg, K. 2011, RR Lyrae Stars, Metal-Poor Stars, and the Galaxy, Ed. Andrew McWilliam, Carnegie Observatories Astrophysics Series, Vol. 5., p.100
- Kolláth et al. (2002) Kolláth, Z., Buchler, J. R., Szabó, R., et al. 2002, A&A, 385, 932
- Kovács (2009) Kovács, G. 2009, AIPC, 1170, 261
- Mizerski (2003) Mizerski, T. 2003, AcA, 53, 307
- Molnár et al. (2012) Molnár, L., Kolláth, Z., Szabó, R. 2012, MNRAS, 424, 31
- Moskalik & Poretti (2003) Moskalik, P., Poretti, E. 2003, A&A, 398, 213
- Mundprecht et al. (2015) Mundprecht, E., Muthsam, H. J., Kupka, F. 2015, MNRAS, 449, 2539
- Netzel et al. (2015) Netzel, H., Smolec, R., Moskalik, P. 2015, MNRAS, 453, 2022
- Nowakowski & Dziembowski (2001) Nowakowski, R. M., Dziembowski, W. A. 2001, AcA, 51, 5
- Nowakowski & Dziembowski (2003) Nowakowski, R. M., Dziembowski, W. A. 2003, Ap&SS, 284, 273
- Plachy et al. (2014) Plachy, E., Benkő, J. M., Kolláth, Z., et al. 2014, MNRAS, 445, 2810
- Shibahashi (2000) Shibahashi, H. 2000, ASPC, 203, 299
- Skarka (2013) Skarka, M. 2013, A&A, 549, 101
- Skarka (2014) Skarka, M. 2014, A&A, 562, 90
- Smolec & Moskalik (2010) Smolec, R., Moskalik, P. 2010, A&A, 524, 40
- Smolec et al. (2011) Smolec, R., Moskalik, P., Kolenberg, K., et al. 2011, MNRAS, 414, 2950
- Smolec et al. (2015) Smolec, R., Soszynski, I., Udalski, A., et al. 2015, MNRAS, 447, 3756
- Sódor et al. (2012) Sódor, Á, Jurcsik, J., Molnár, L., et al. 2012, ASPC, 462, 228
- Soszynski et al. (2009) Soszynski, I., Udalski, A., Szymanski, M. K., et al. 2009, AcA, 59, 1
- Soszynski et al. (2010) Soszynski, I., Udalski, A., Szymanski, M. K., et al. 2010, AcA, 60, 165
- Soszynski et al. (2011) Soszynski, I., Dziembowski, W. A., Udalski, A., et al. 2011, AcA, 61, 1
- Stothers (2011) Stothers, R. B. 2011, PASP, 123, 127
- Szabó (2014) Szabó, R. 2014, IAUS, 301, 241
- Szabó et al. (2010) Szabó, R., Kolláth, Z., Molnár, L., et al. 2010, MNRAS, 409, 1244
- Szabó et al. (2014) Szabó, R., Benkő, J. M., Paparó, M., et al. 2014, A&A, 570, 100
- Szczygiel & Fabrycky (2007) Szczygiel, D. M., Fabrycky, D. C. 2007, MNRAS, 377, 1263
- Van Hoolst et al. (1998) Van Hoolst, T., Dziembowski, W. A., Kawaler, S. D. 1998, MNRAS, 297, 536
- Windmark et al. (2011) Windmark, F., Lindegren, L., Hobbs, D. 2011, A&A, 530, 76