The circum-galactic medium of quasars: CIV absorption systems.
Abstract
We investigate the properties of the circumgalactic gas in the halo of quasar host galaxies from CIV absorption line systems. Optical spectroscopy of closely aligned pairs of quasars (projected distance 200 kpc) obtained at the Gran Telescopio Canarias is used to investigate the distribution of the absorbing gas for a sample of 18 quasars at z 2. We found that the detected absorption systems of EW 0.3Å associated with the foreground QSO are revealed up to 200 kpc from the center of the host galaxy. The structure of the absorbing gas is rather patchy with a covering fraction of the gas that quickly decreases beyond 100 kpc. These results are in qualitative agreement with those found for the lower ionisation metal Mg II 2800Å.
keywords:
quasars - C IV absorptions systems - Intervening absorptions - QSO host galaxies1 Introduction
Direct observation of low redshift galaxies () demonstrated the presence of large and diffuse warm-to-hot gas halos up to 200 kpc commonly referred as circumgalactic-medium (CGM), see e.g. Lanzetta et al. (1995); Chen et al. (2001); Churchill et al. (2005). In the last decades, a number of papers exploited absorption lines imprinted in the spectra of background QSO to investigate the physical properties of the CGM (e.g. Bahcall & Spitzer, 1969; Churchill et al., 2005; Nielsen et al., 2013a, b) finding significant correlation between the absorptions of the gas in CGM and the global properties of galaxies, such as luminosity (Chen & Tinker, 2008), mass (Churchill et al., 2013) , color (Zibetti et al., 2007) and star formation rate (Prochter et al., 2006; Ménard et al., 2011; Nestor et al., 2011). Nevertheless, only a few studies have been focused on the properties of the gaseous halo of galaxies hosting a QSO in their centre (Hennawi et al., 2006; Hennawi & Prochaska, 2007, and references therein).
The standard model for the origin of the extreme luminosity of quasars (QSO) considers that a supermassive black hole shines when intense mass inflow takes place, possibly as a consequence of tidal forces in dissipative events (Di Matteo et al., 2005). In this scenario, the CGM of QSO is expected to be populated by tidal debris, streams, and cool gas clouds, as commonly observed in interacting galaxies (see e.g. Sulentic et al., 2001; Cortese et al., 2006). Moreover the gas of the CGM belonging to the QSO host galaxy could be metal enriched by supernova-driven winds triggered by starbursts events associated to the mergers or by QSO-driven outflows of gas (e.g., Steidel et al., 2010; Shen & Ménard, 2012). Although in the last few years a great effort allowed to detect emission lines that arise from the CGM (Hennawi & Prochaska, 2013; Martin et al., 2014; Cantalupo et al., 2014; Hennawi et al., 2015), only the Lyman- feature has been observed so far. For these reasons, the most efficient way to study the CGMs is to investigate the absorption features that it imprints in the spectra of background QSOs (e.g., Adelberger et al., 2005; Hennawi et al., 2006).
In this context projected QSO pairs are ideal observational tools for this purpose, since the light of the very bright source in the background (), goes through the extended halo of the foreground ( ) object (e.g., Hennawi et al., 2006; Farina et al., 2013). The absorption features in the gaseous halos belonging to the foreground QSO can be therefore exploited to understand the processes of enrichment of material far from the host galaxy. In this paper we aim to characterise the properties of intervening C IV absorbers in the circumgalactic medium of quasars host galaxies up to a projected distance (PD) of 200 kpc. We adopt the following cosmological parameters km s-1 Mpc-1, , .
2 Sample selection
In order to investigate the properties and abundances of C IV in the CGM of quasars, we selected QSO projected pairs by searching in Sloan Digital Sky Survey DR10 of spectroscopic quasars (Paris et. al. 2012). We assume as good candidates pairs with PD (comoving transverse distance) smaller than 200 kpc in order to characterise the innermost region of the CGM. Further, we constrain the line-of-sight (LOS) velocity difference, based on the published redshift, km s-1 to ensure that pairs are not gravitationally bound. We also put a threshold on the magnitude of the background QSO () to secure spectra with adequate signal to noise ratio () and on declination to ensure good visibility from Roque de los Muchachos observatory. Finally, we selected pairs in which the redshifts of the foreground and background QSOs combine, so that the CIV absorption lines at the redshift of the foreground () fall within the wavelength range 4500-6000Å. This procedures yielded 34 candidate pairs. We selected 25 objects for observation, according to the visibility of the considered period. However, only 18 targets were obtained due to partially bad weather conditions. Details on the observed objects are reported in Table 1.
3 Observations, Data Reduction and Data analysis
We observed our QSO pairs with the 10.4m Gran Telescopio Canarias (GTC) equipped with the Optical System for Imaging and Low Resolution Integrated Spectroscopy (OSIRIS, Cepa et al. (2003)) from September 2013 to August 2014.
Observations were gathered with GTC-OSIRIS adopting the grism R2500V with a slit of 1.00′′ yielding a resolution (1 px = 0.80 Å, corresponding to 45 km s-1 at center wavelength). In this case the resolution corresponds to a FWHM of about 2 Å allowing to fully resolve the components of the C IV doublets (1548-1551Å). The resolution element, which corresponds to a FWHM of 120 km s-1, is not sufficient to kinematically resolve the internal dynamics of the absorbing gas which is beyond the aim of our investigation.
For each pair we oriented the slit in order to acquire simultaneously the spectra of the two objects and we secured three different exposures, applying a small shift of 5′′ along the slit to better reject cosmic rays and for accounting for CCD defects.
We reduced our data by the adoption of standard 111
IRAF is distributed by the National Optical Astronomy Observatories,
which are operated by the Association of Universities for
Research in Astronomy, Inc., under cooperative agreement
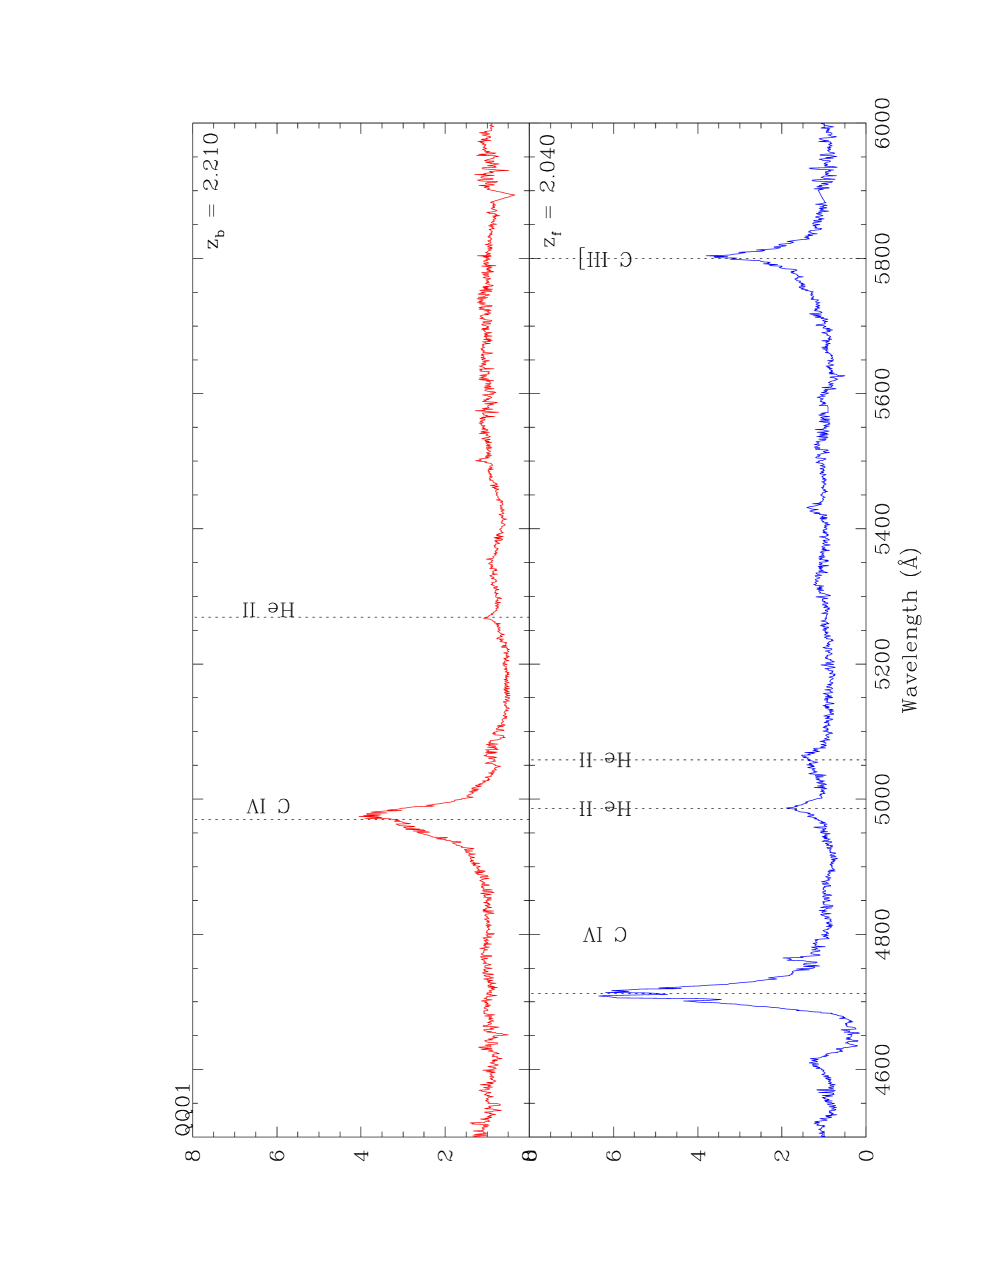
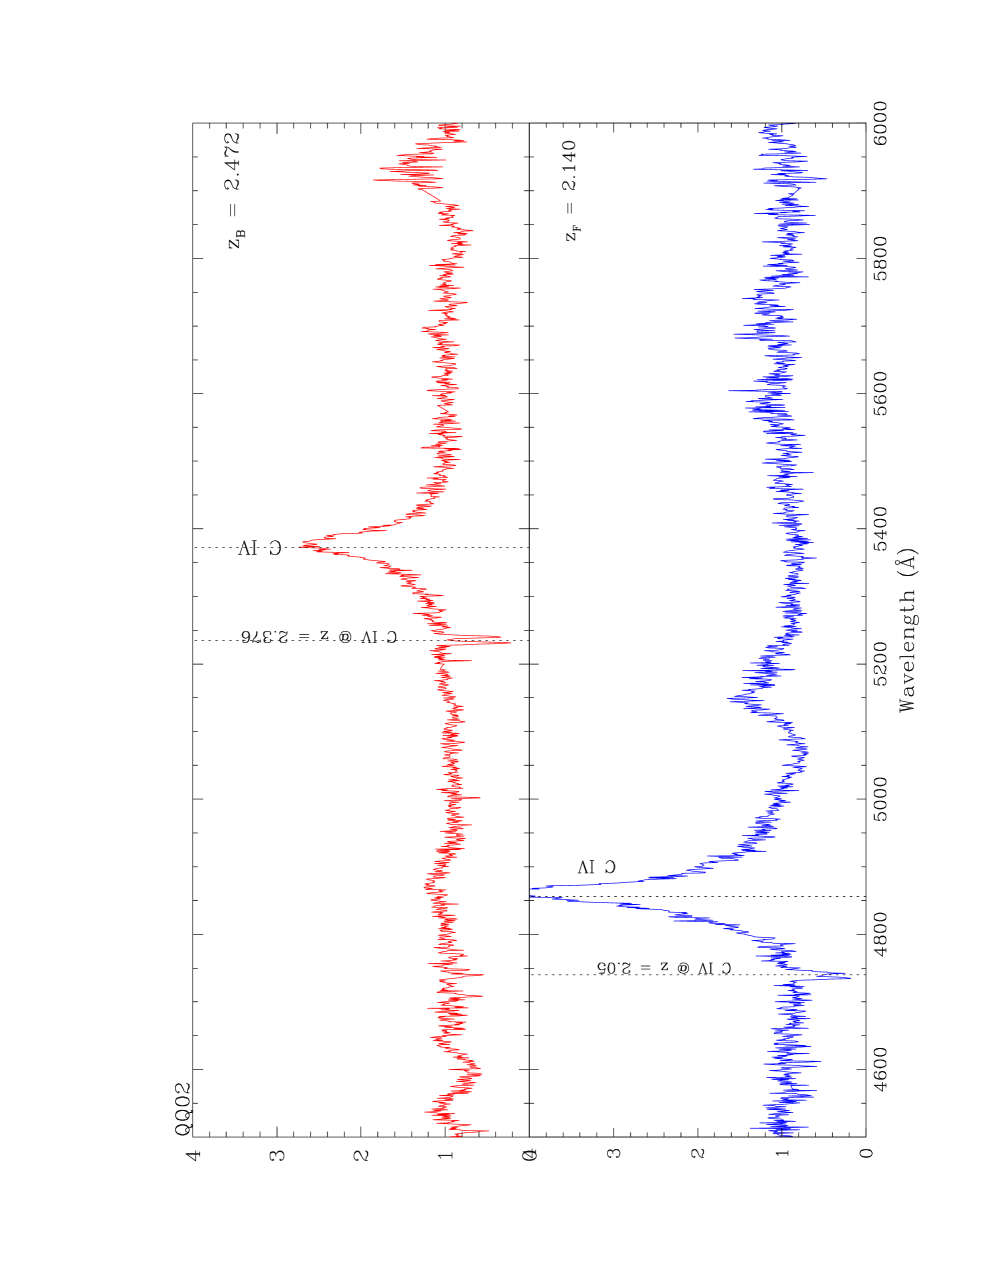
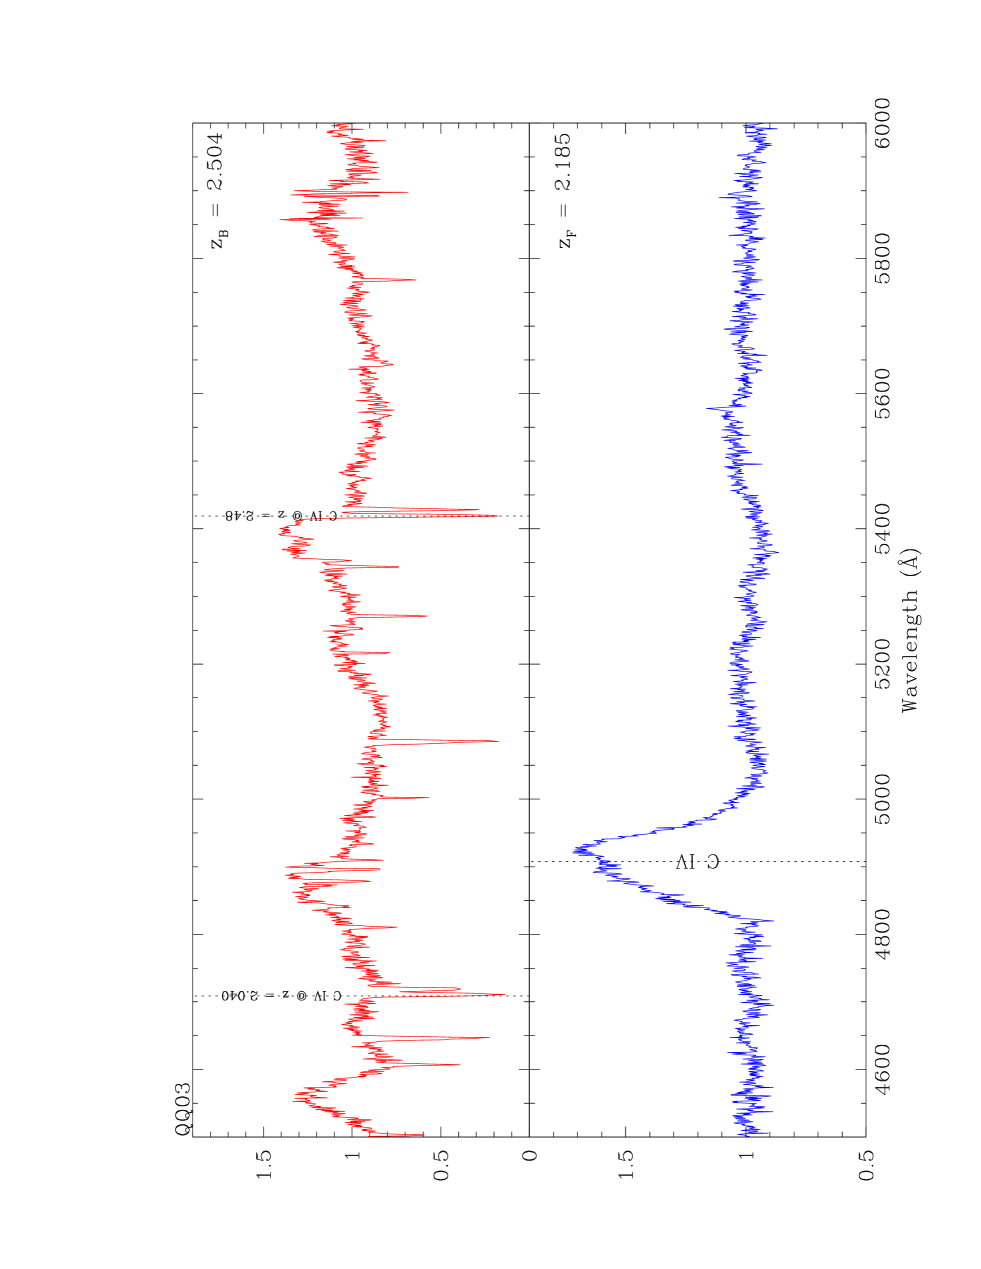
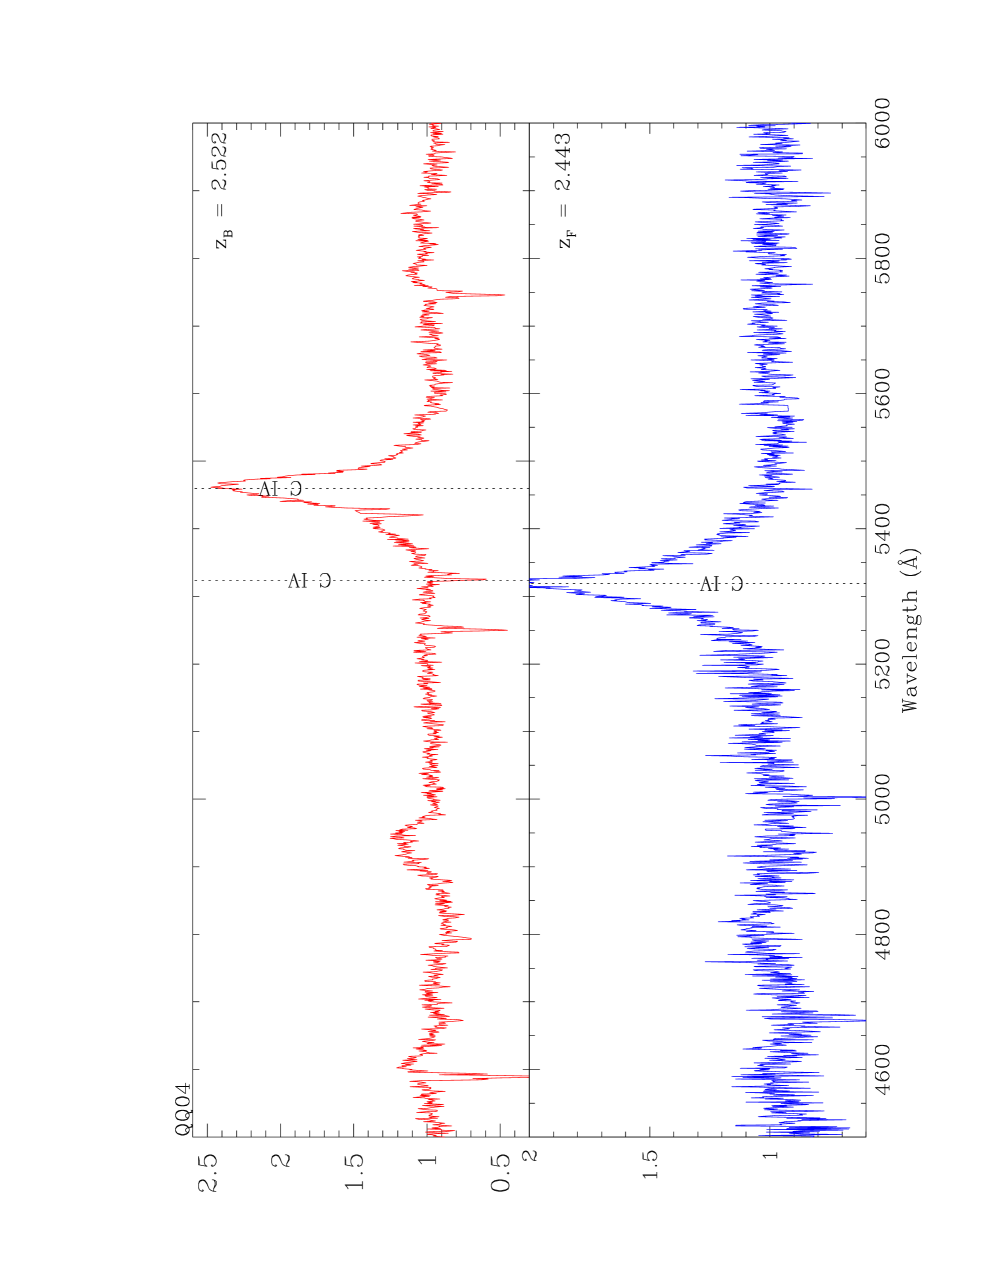
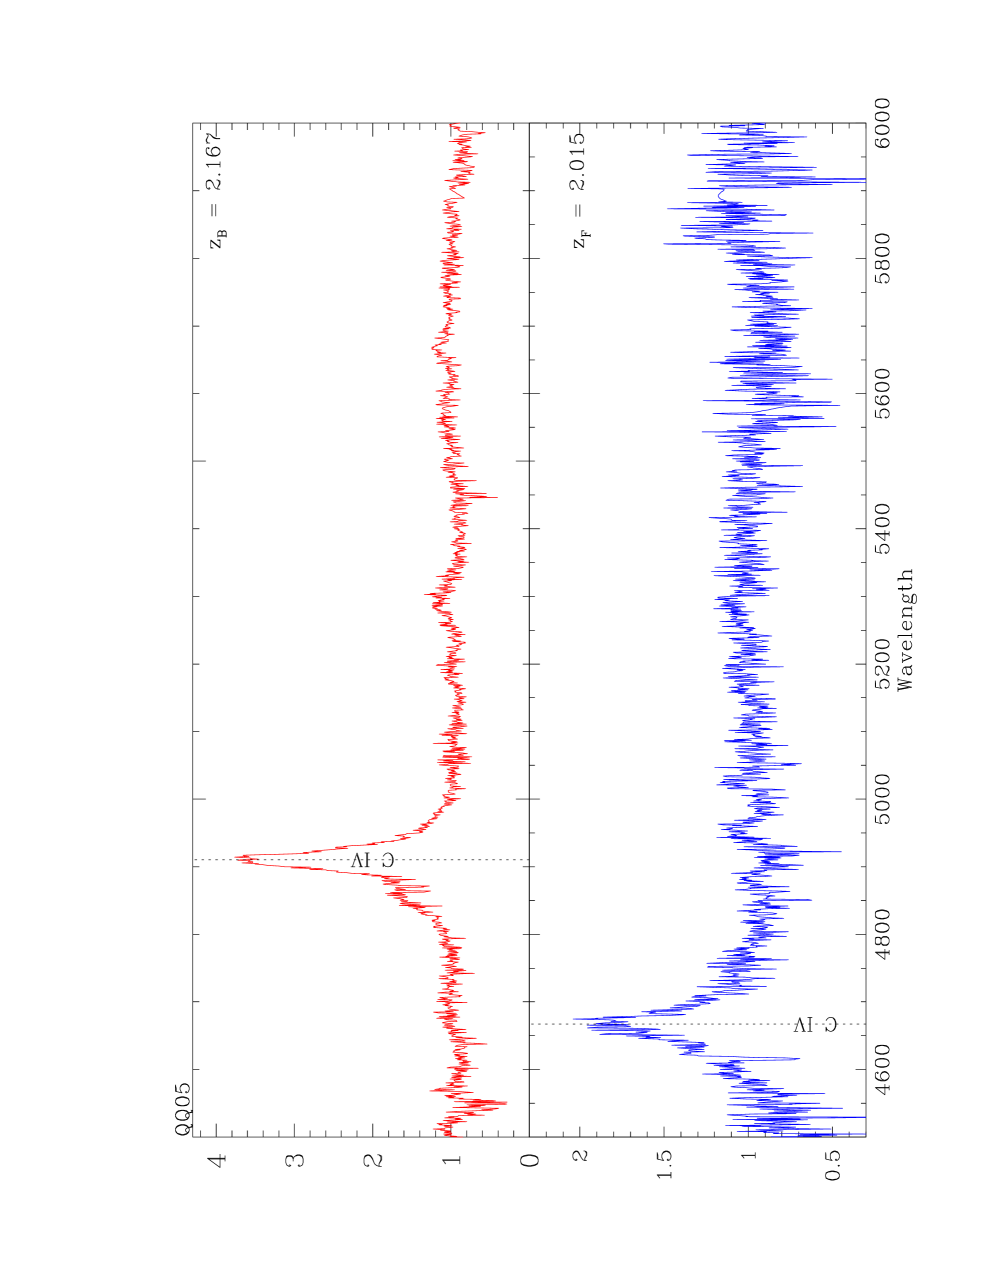
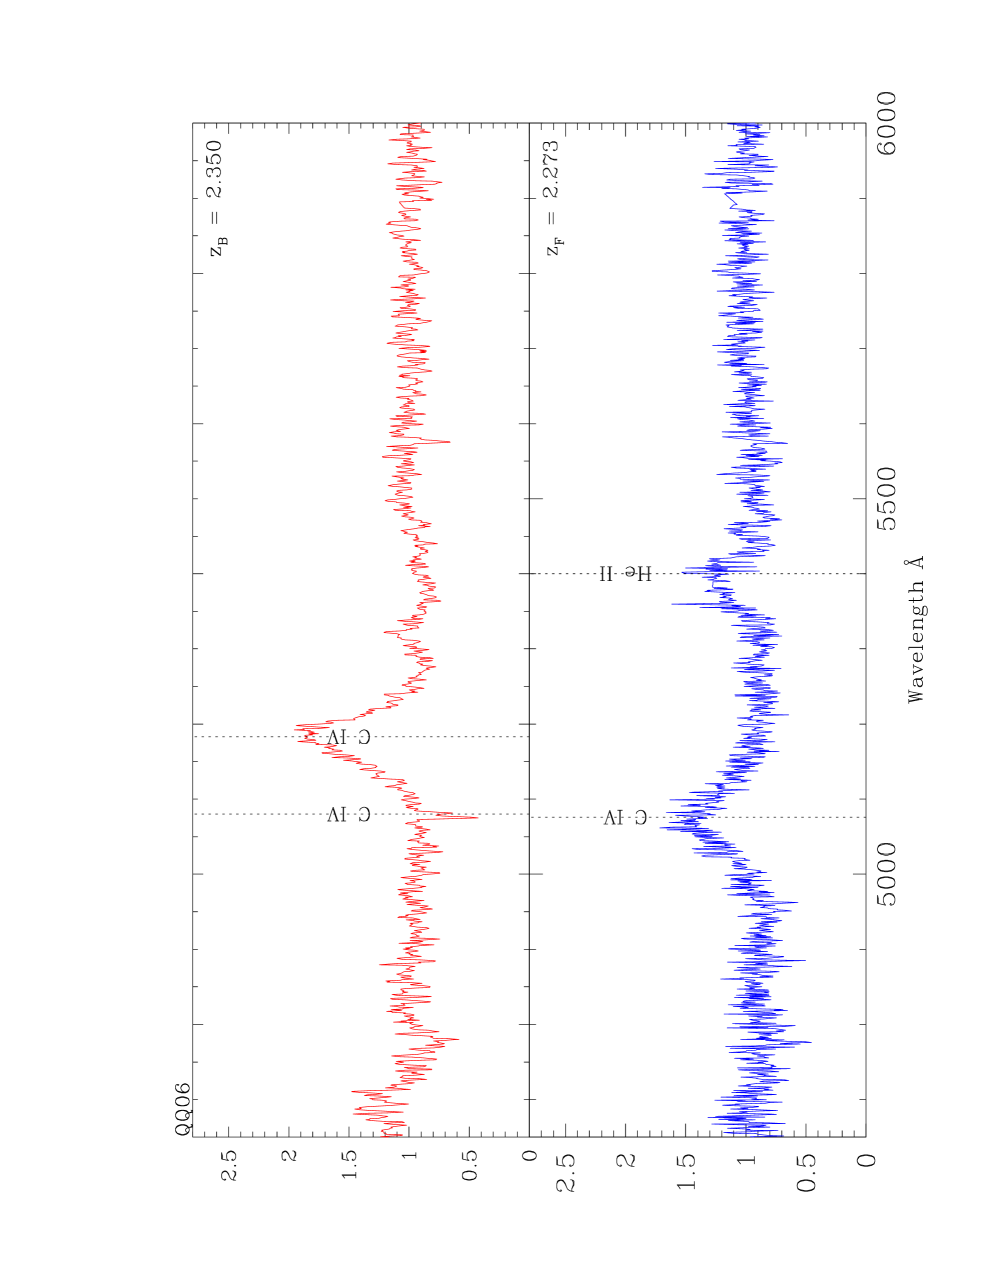
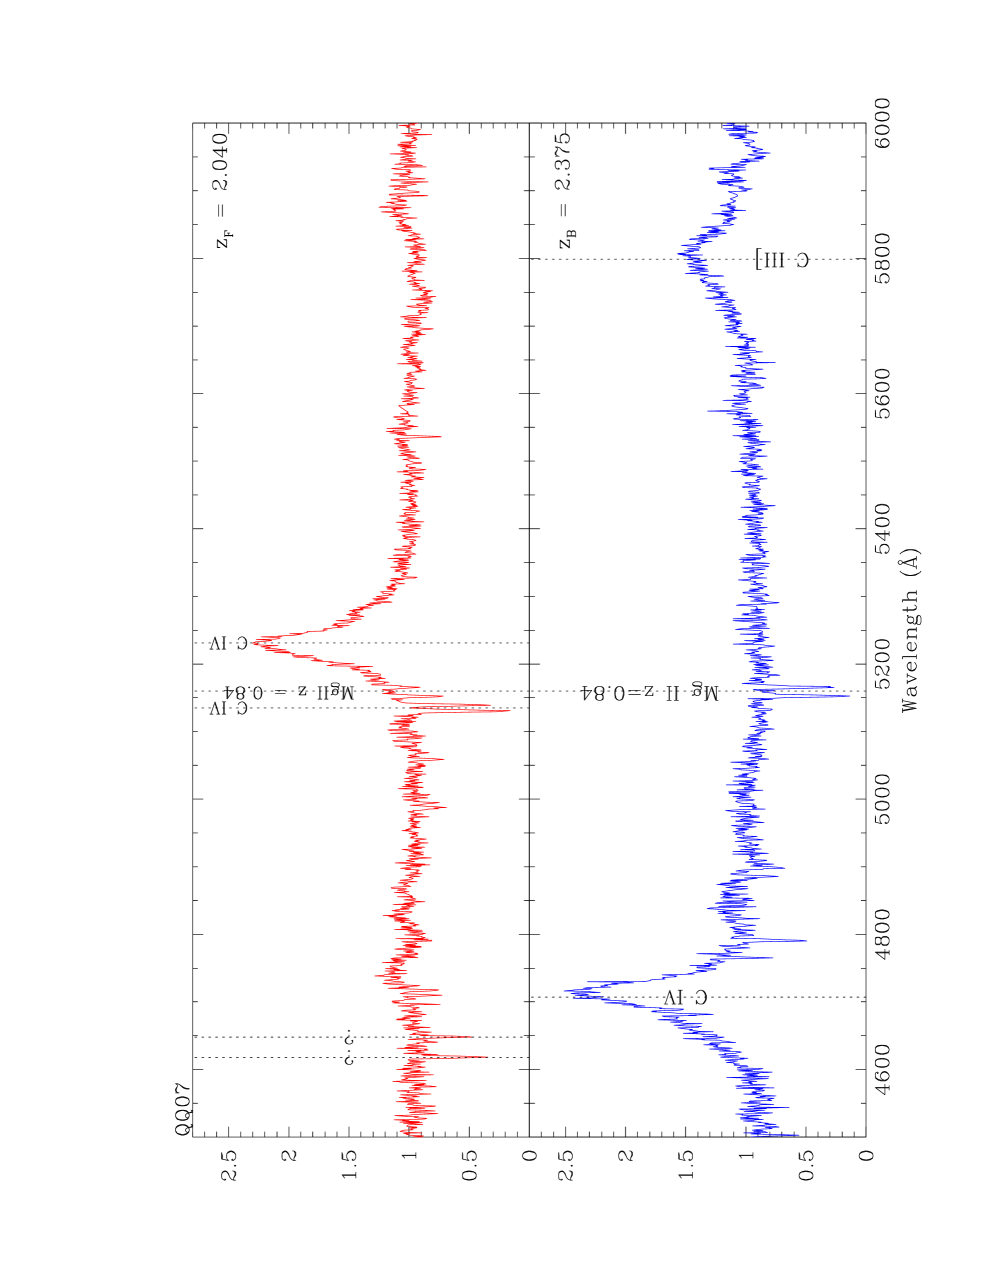
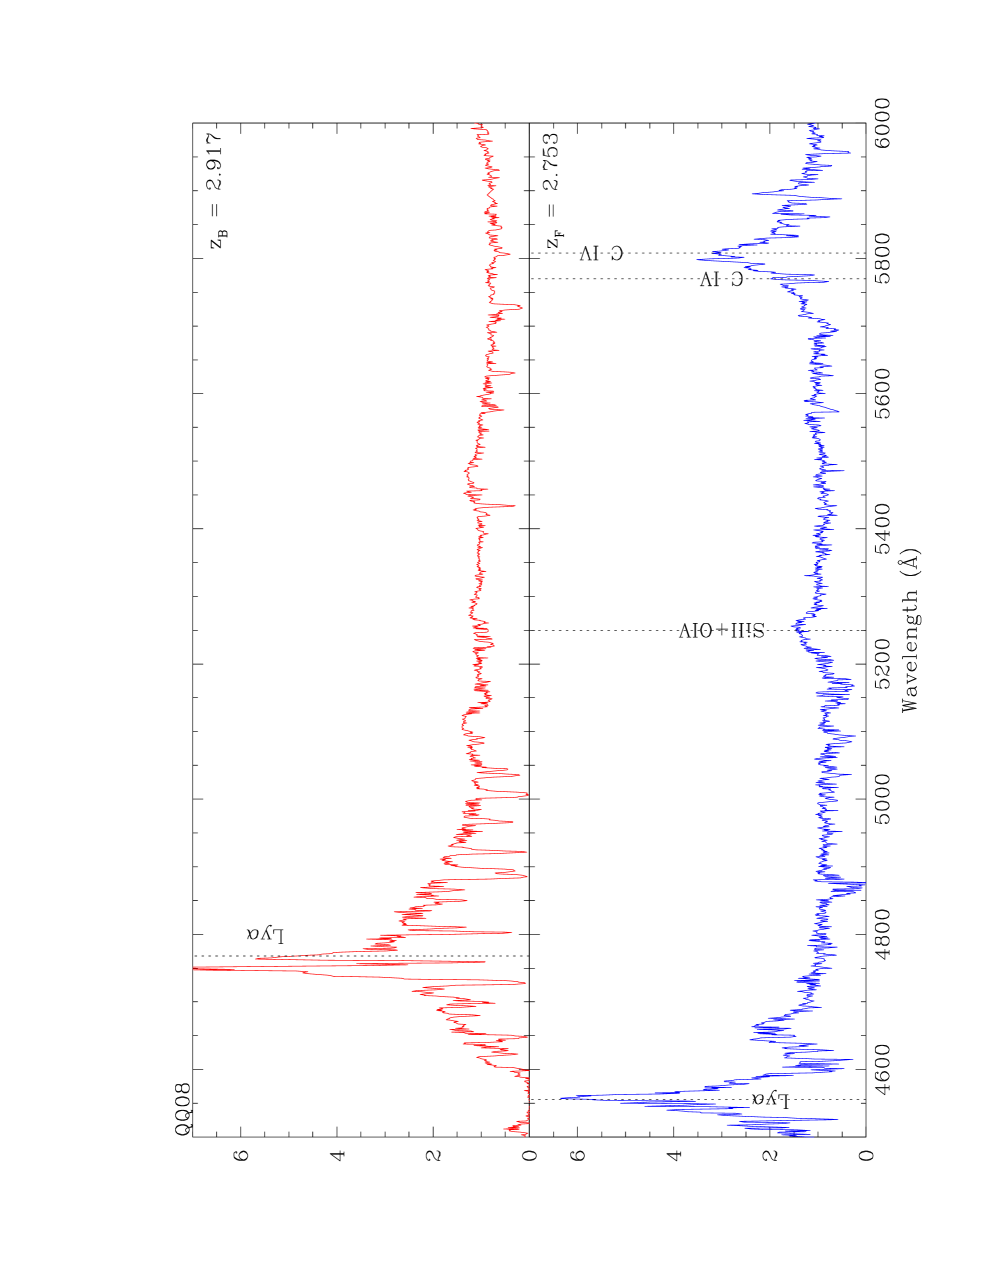
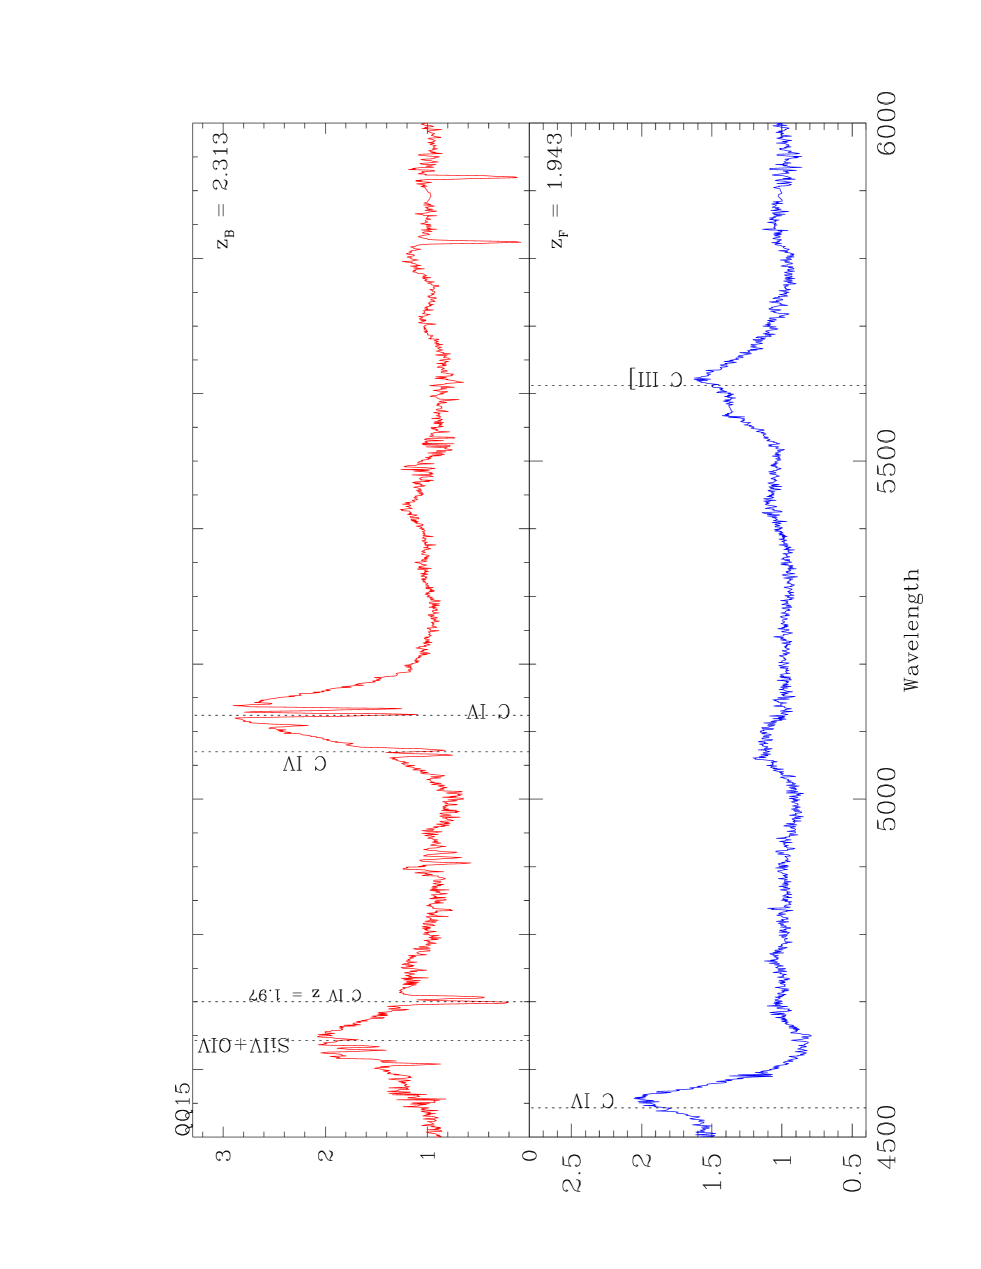
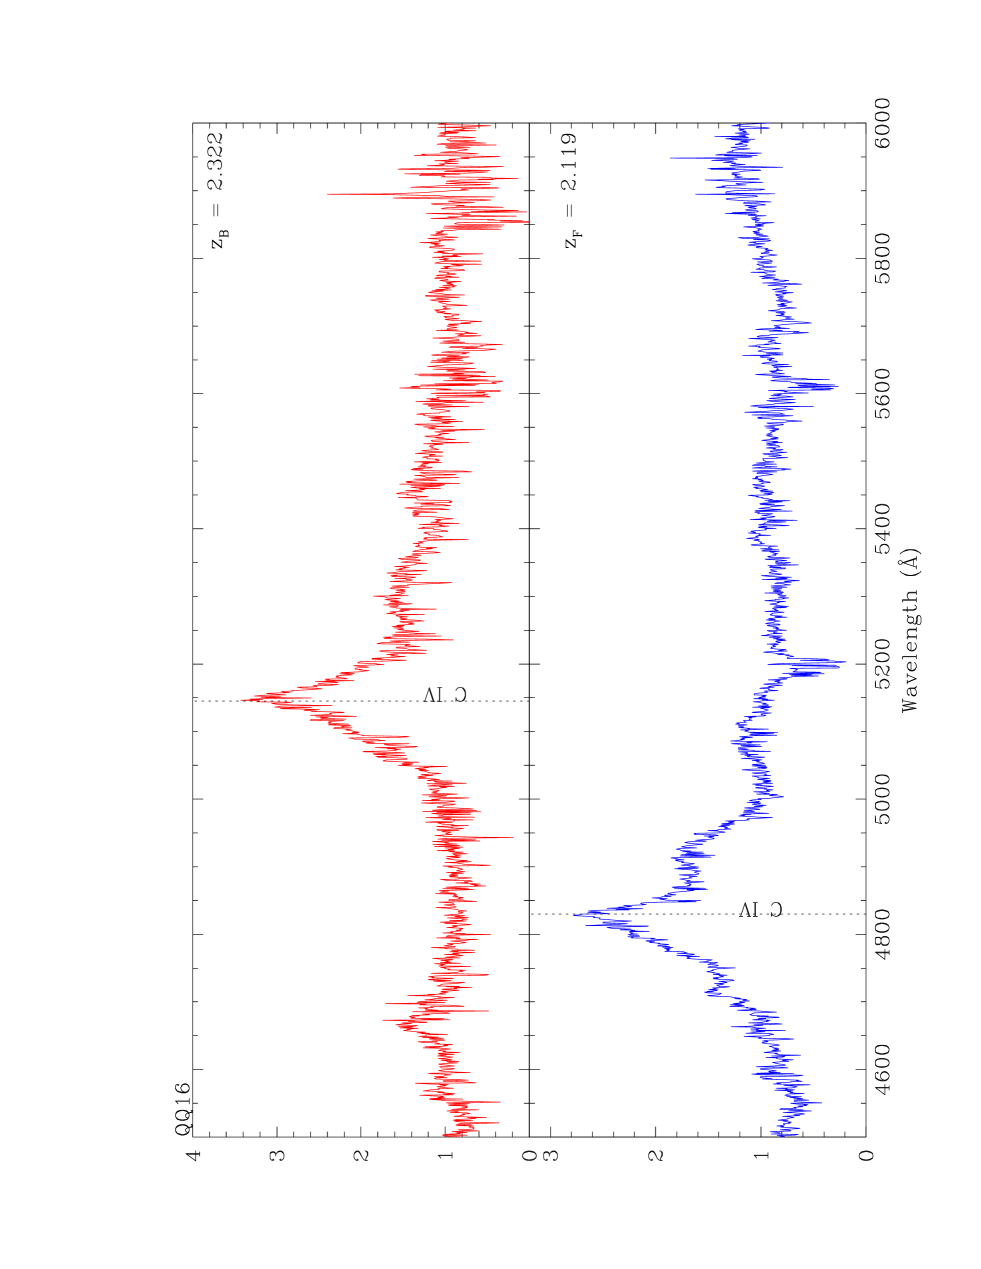
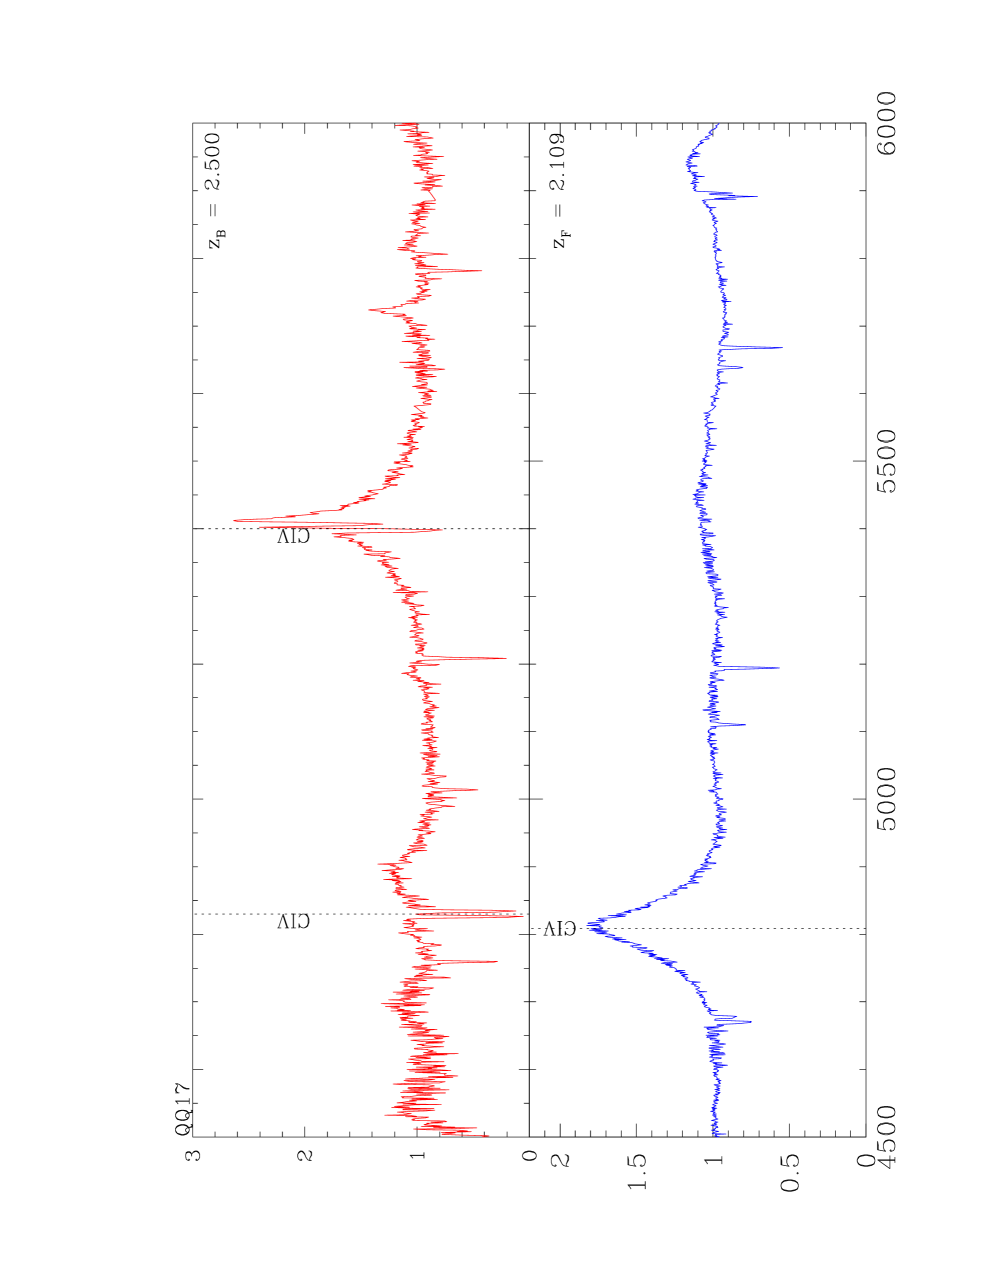
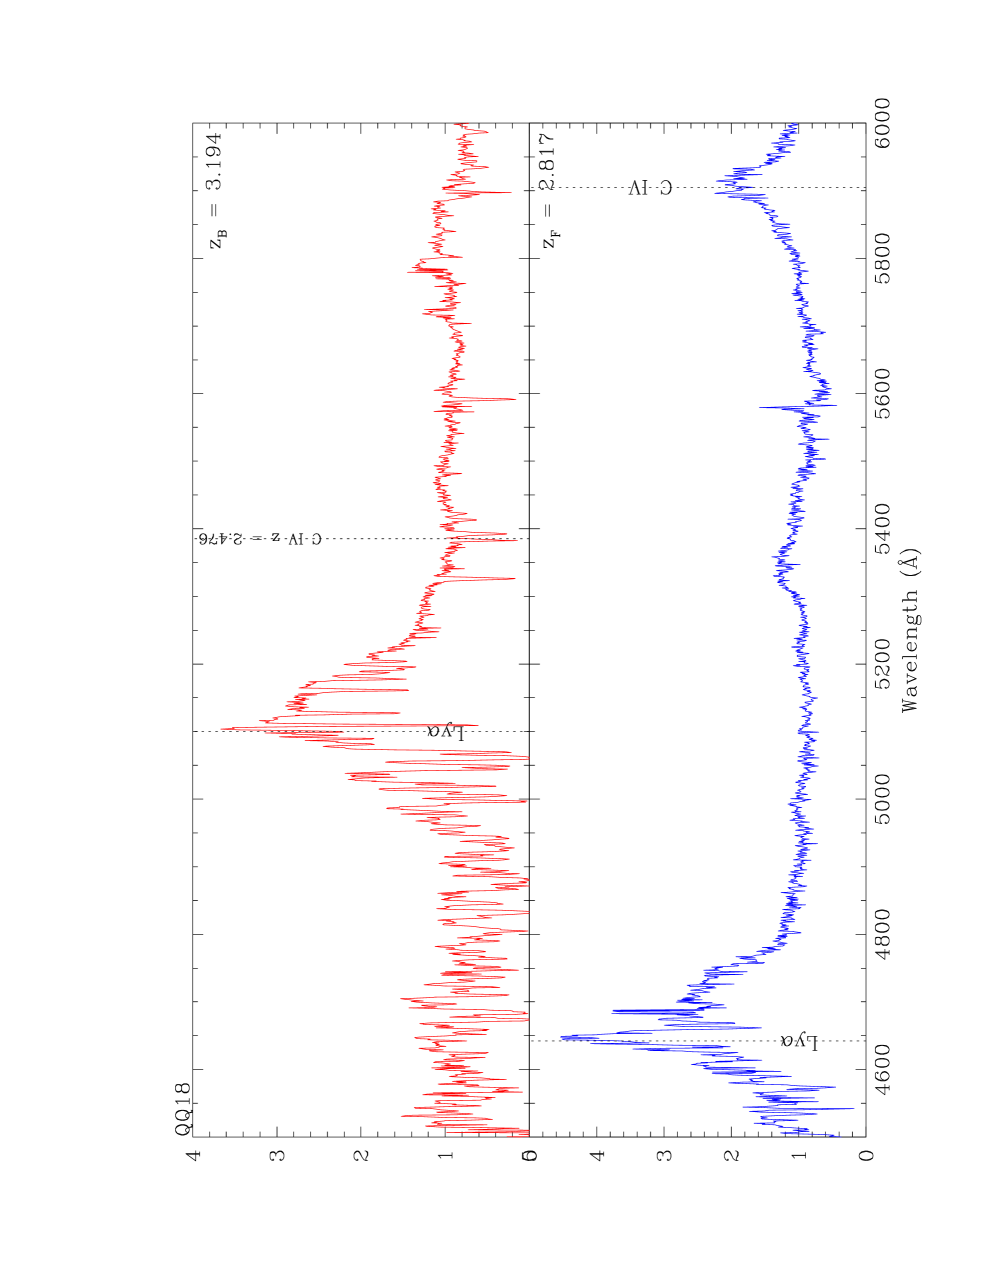
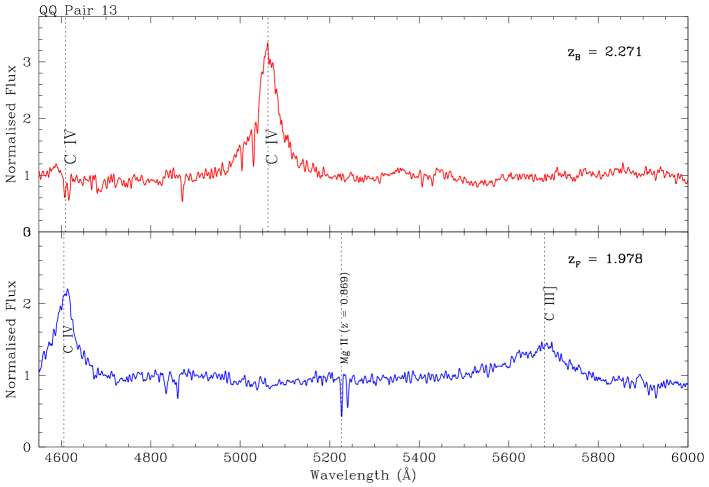
with the National Science Foundation. procedures. Briefly, for each frame, we performed bias subtraction and flat field correction using the package. Wavelength calibration has been assessed through the observation of arc lamps (Xe+Ne+HgAr) and the residuals on the calibration are around 0.04Å. We flux calibrated the spectra exploiting standard stars observed during the same nights of the targets. We corrected for systematics, slit losses and variation of the sky conditions through aperture photometry of the field, in -band, acquired shortly before the observation. We report an example of spectra of a pair in Figure 1 and we give the full figure set in the electronic edition of this Journal.
The Galactic reddening was taken into account considering the estimates from Schlegel et al. (1998) assuming RV = 3.1 (Cardelli et al., 1989). In the spectra of the QSO presented in Figure 1, in addition to the typical broad emission lines of C IV and C III], we note that several absorptions lines due to intervening matter (e.g. Mg II at ) are present. The C IV absorption system ascribed to the halo of the foreground QSO is also detected in some cases in the spectrum of the background one.
| ID | RAF | DECF | zF | zB | VF | VB | PD | SNF | SNB |
|---|---|---|---|---|---|---|---|---|---|
| QQ01 | 08:45:13.57 | +39:10:25.65 | 2.040 | 2.210 | 19.8 | 19.5 | 180 | 15 | 15 |
| QQ02 | 09:17:06.47 | +00:56:35.10 | 2.140 | 2.472 | 20.4 | 20.2 | 200 | 10 | 10 |
| QQ03 | 10:13:01.20 | +40:23:03.52 | 2.185 | 2.504 | 18.4 | 19.2 | 192 | 35 | 20 |
| QQ04 | 12:06:51.22 | +02:04:21.90 | 2.443 | 2.522 | 20.5 | 19.0 | 110 | 15 | 20 |
| QQ05 | 13:58:06.09 | +61:18:26.70 | 2.015 | 2.167 | 20.5 | 20.2 | 190 | 10 | 15 |
| QQ06 | 14:30:33.61 | -01:34:45.69 | 2.273 | 2.350 | 19.5 | 19.5 | 55 | 10 | 10 |
| QQ07 | 09:13:23.31 | +04:02:35.15 | 2.040 | 2.375 | 19.1 | 19.5 | 92 | 15 | 15 |
| QQ08 | 09:16:11.20 | -01:19:41.50 | 2.753 | 2.917 | 20.7 | 20.8 | 87 | 15 | 10 |
| QQ09 | 10:09:35.86 | +47:49:34.61 | 2.292 | 2.590 | 20.7 | 19.7 | 93 | 5 | 15 |
| QQ10 | 11:34:26.18 | +00:38:54.86 | 2.209 | 2.365 | 20.4 | 19.6 | 90 | 15 | 20 |
| QQ11 | 00:42:52.23 | +01:11:55.62 | 2.027 | 2.084 | 18.7 | 18.9 | 70 | 30 | 30 |
| QQ12 | 03:44:11.98 | +00:09:27.88 | 2.125 | 2.240 | 21.4 | 19.4 | 184 | 10 | 25 |
| QQ13 | 12:14:31.06 | +32:23:28.24 | 1.978 | 2.271 | 19.5 | 20.0 | 202 | 10 | 10 |
| QQ14 | 08:45:33.63 | +25:15:51.64 | 2.110 | 2.292 | 19.0 | 20.3 | 186 | 15 | 5 |
| QQ15 | 12:19:30.15 | +15:10:28.44 | 1.943 | 2.313 | 19.2 | 19.7 | 110 | 35 | 25 |
| QQ16 | 12:21:49.62 | +37:00:13.82 | 2.119 | 2.322 | 20.4 | 20.7 | 97 | 10 | 10 |
| QQ17 | 14:59:06.93 | +12:34:49.54 | 2.109 | 2.500 | 18.6 | 20.6 | 42 | 50 | 20 |
| QQ18 | 15:53:19.30 | +31:52:40.39 | 2.817 | 3.194 | 22.3 | 20.0 | 200 | 15 | 25 |
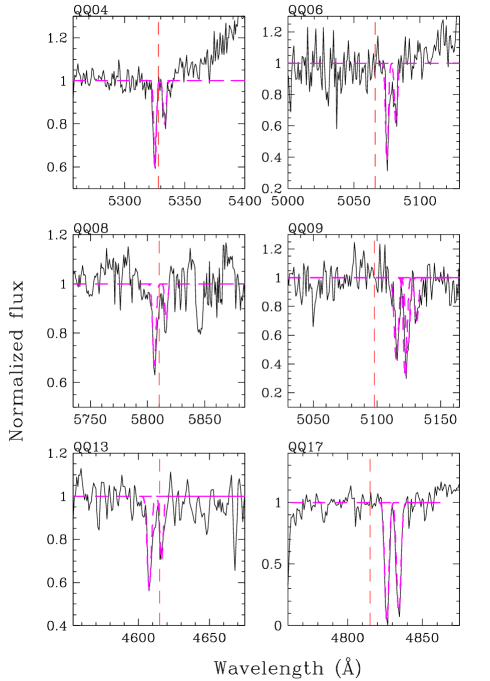
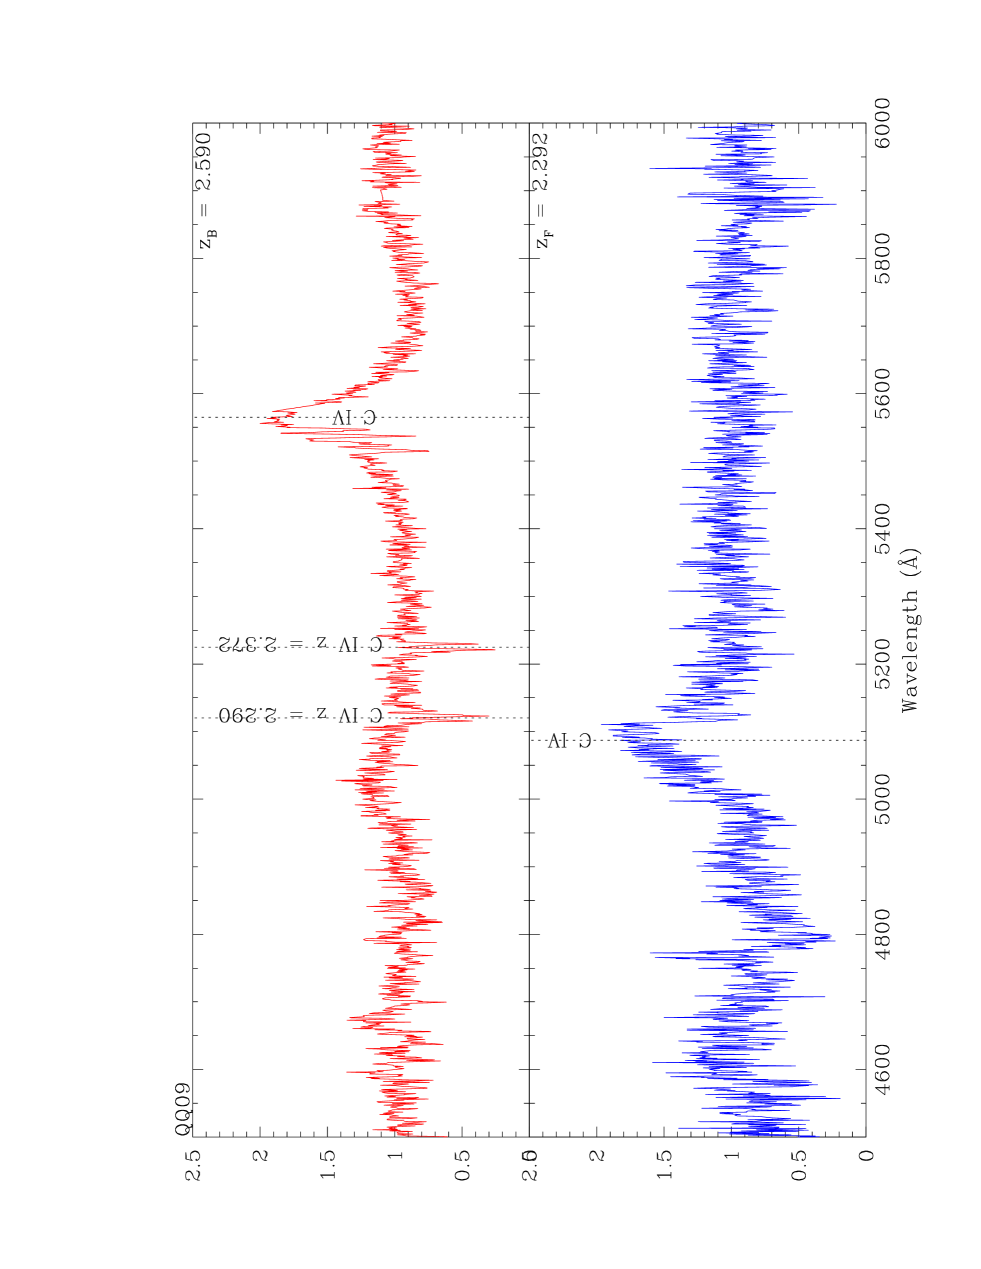
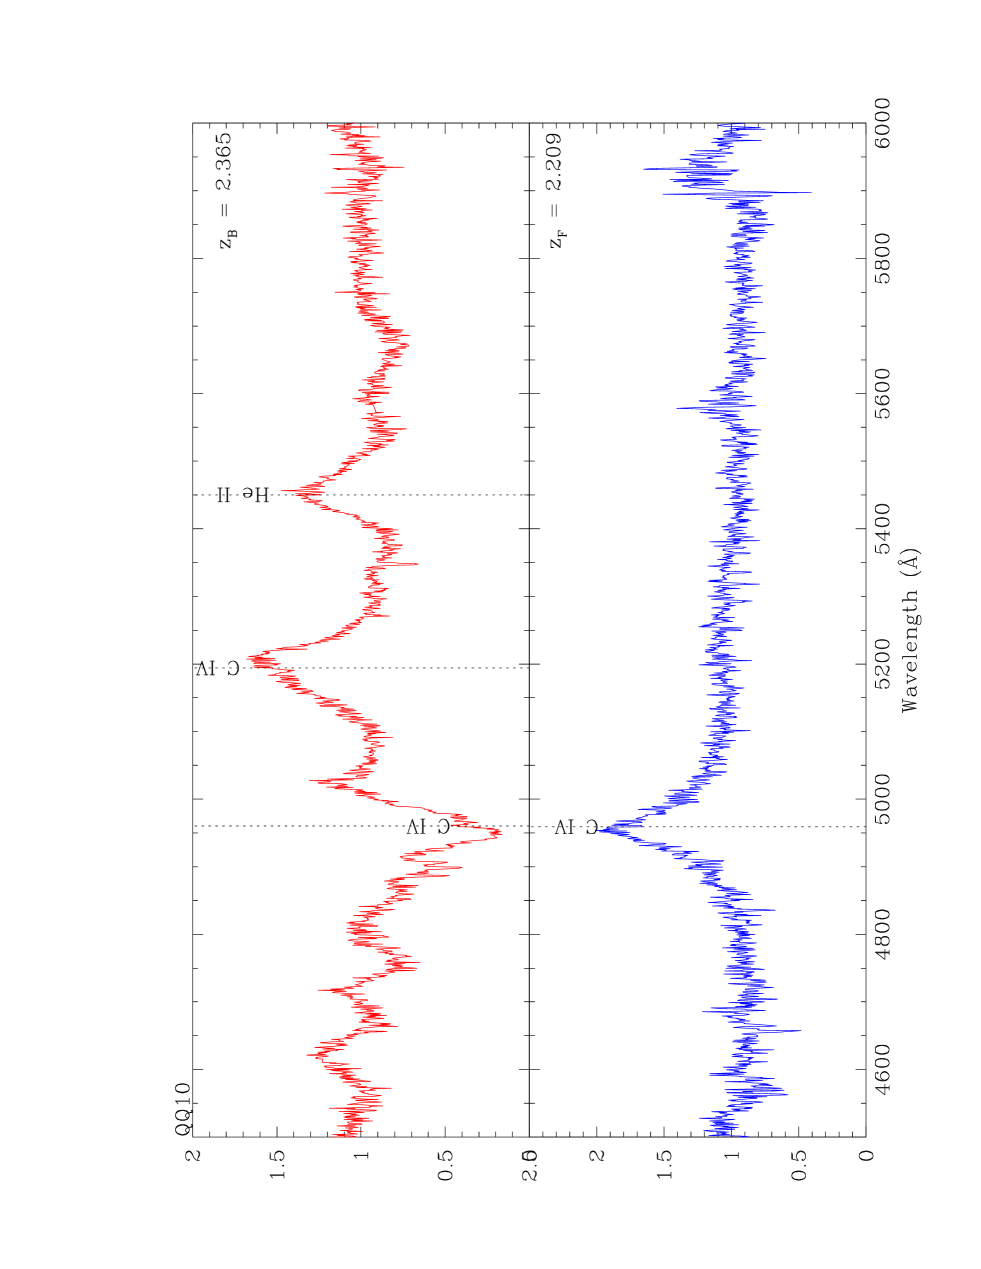
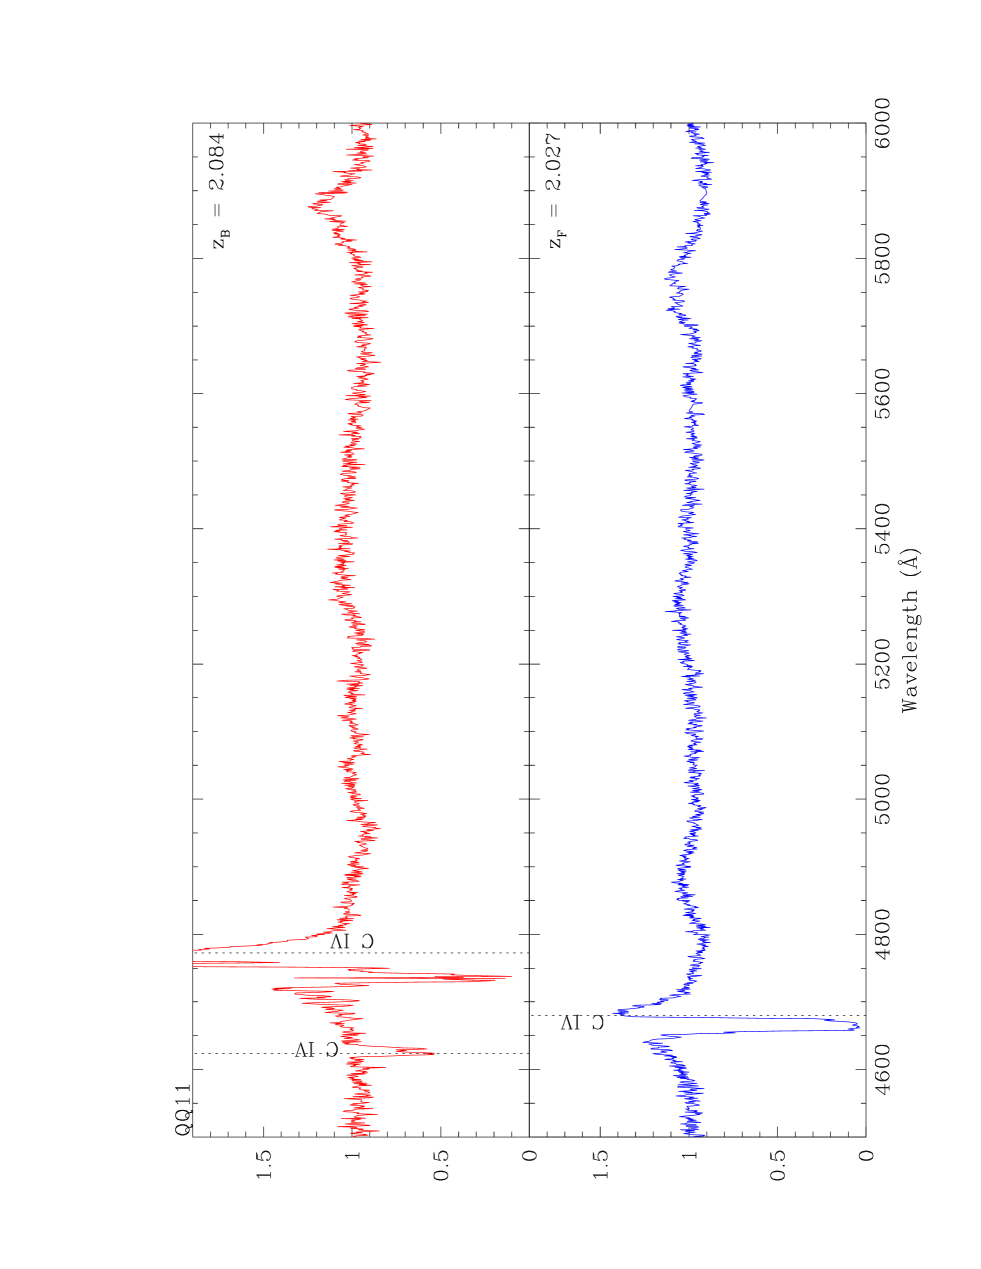
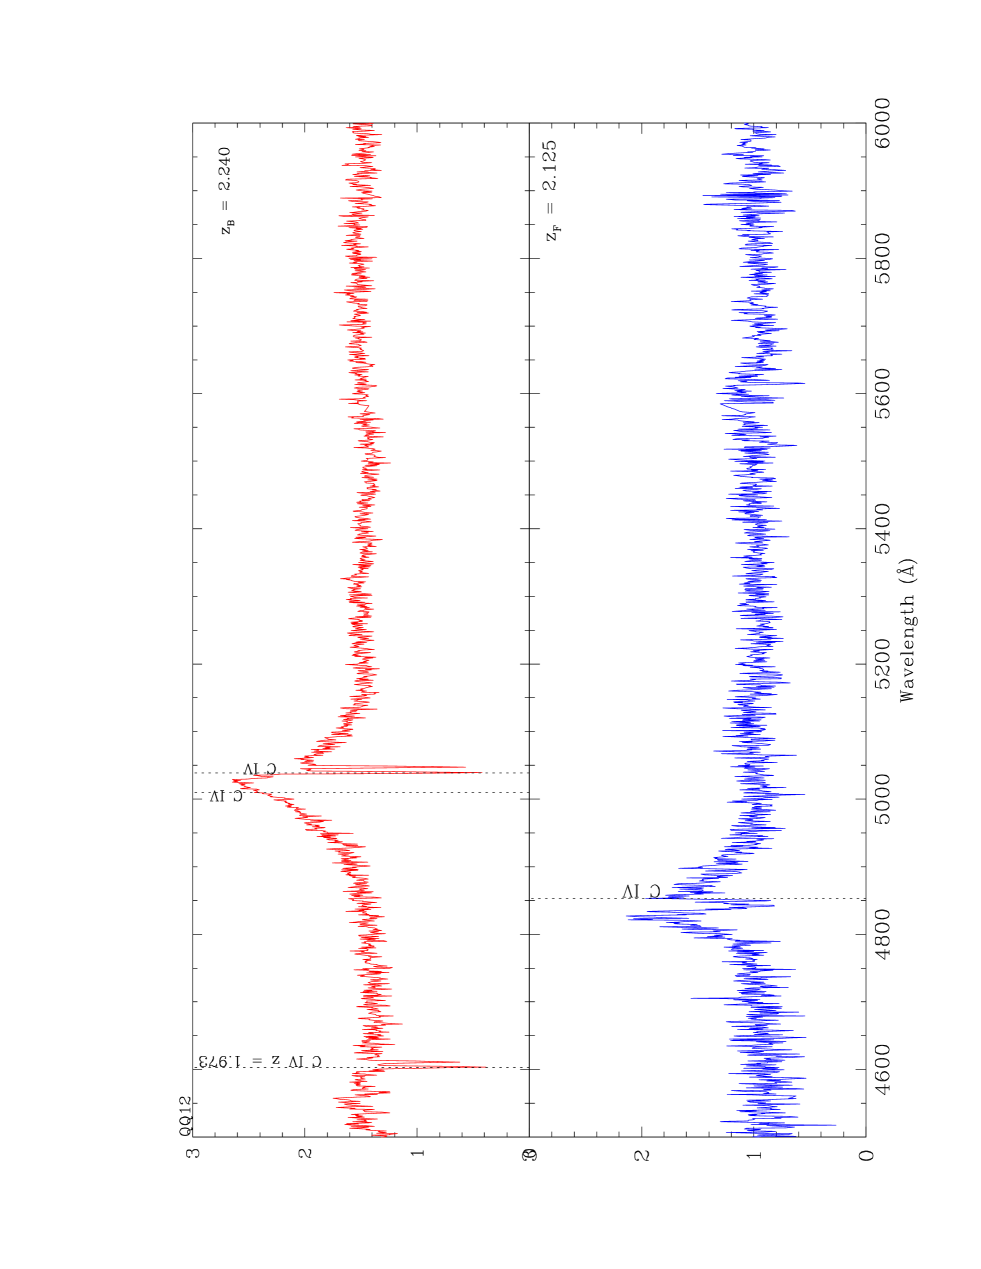
We performed the search of the C IV ( absorption doublet in the spectrum of the background QSO for each pair in an interval of wavelengths corresponding to 4000 km s-1 centered at the expected position of C IV lines at the redshift of the foreground quasar. In the case of detection we fit the components by the adoption of two gaussian profiles, as illustrated in the boxes of Figure 2. Furthermore, in order to proper characterise the quality of the data, on each window we measured the minimum detectable Equivalent Width (EW) by following procedure described in Sbarufatti et al. (2006). Briefly, we evaluated the EW on bins of the size of the resolution element in various regions of the spectrum excluding telluric structures. We assume as the 2- deviation from the mean of the average of the distribution of the EWs obtained in each bin. Finally, concerning the LOS velocities of the detected C IV absorptions, we considered that the systems is associated to the foreground object only if km s-1 rest frame. Results of our procedures are reported in Table 2.
| ID | (1548) | W (1548) | (1551) | W (1551) | DR | EWmin | |
|---|---|---|---|---|---|---|---|
| [Å] | [Å] | [Å] | [Å] | [km s-1] | [Å] | ||
| QQ01B | - | - | - | - | - | - | 0.13 |
| QQ02B | - | - | - | - | - | - | 0.12 |
| QQ03B | - | - | - | - | - | - | 0.10 |
| QQ04B | 5324 | 0.70 0.20 | 5334 | 0.30 0.10 | 2.30 | -300 | 0.15 |
| QQ05B | - | - | - | - | - | - | 0.20 |
| QQ06B | 5075 | 1.30 0.40 | 5084 | 0.60 0.20 | 2.17 | 500 | 0.15 |
| QQ07B | - | - | - | - | - | - | 0.20 |
| QQ08B | 5805 | 0.50 0.20 | 5817 | 0.30 0.10 | 1.67 | -500 | 0.25 |
| QQ09B | 5114 | 0.60 0.20 | 5124 | 0.30 0.10 | 2.00 | 600 | 0.18 |
| QQ10B | - | - | - | - | - | - | 0.20 |
| QQ11B | - | - | - | - | - | - | 0.16 |
| QQ12B | - | - | - | - | - | - | 0.10 |
| QQ13B | 4607 | 0.50 0.20 | 4616 | 0.40 0.15 | 1.25 | -400 | 0.23 |
| QQ14B | - | - | - | - | - | - | 0.40 |
| QQ15B | - | - | - | - | - | - | 0.20 |
| QQ16B | - | - | - | - | - | - | 0.20 |
| QQ17B | 4824 | 0.50 | 4834 | 0.30 0.05 | 1.67 | 600 | 0.20 |
| QQ18B | - | - | - | - | - | - | 0.18 |
4 Results and Discussion
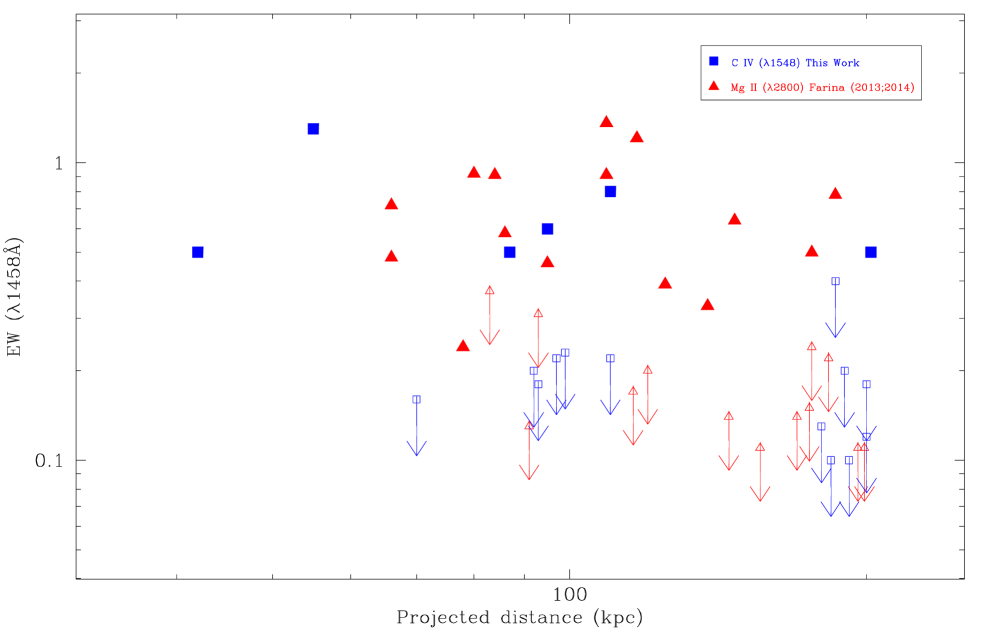
In 6 out of 18 pairs we detected C IV absorption system associated to the foreground QSO halo (see Table 2 and Figure 2). In one case (QQ09) we have a suggestion of a double C IV systems probably associated to two or more moving clouds belonging to the foreground QSO halos. In this case we deblended the features by fitting the four components adopting gaussian profiles (see box 4 of Figure 2). We also note that in QQ10 a C IV absorptions is detected at in the spectrum of background quasars, but we do not include it in our statistic since the velocity difference is slightly beyond our threshold. The EW of the detected associated C IV absorption systems together with the upper limits are shown in Figure 3 as a function of the projected separation from the foreground QSO. In spite of the relatively small statistics, considering both the detections and the upper limits, there is an indication that the absorbing systems decrease in intensity as a function of the distance from the center of the (foreground) quasars and that the absorbing gas becomes more patchy. We performed a Cox Proportional Hazard test including the uppers limits (Isobe et al., 1986) and found that the two quantities (PD and EW) are anti-correlated with a probability of 93%. This behaviour is qualitatively very similar (see Figure 3) to that of Mg II 2800Å intervening systems (Farina et al., 2013, 2014) although the average redshift of the objects is somewhat different ( for Mg II compared with for C IV).
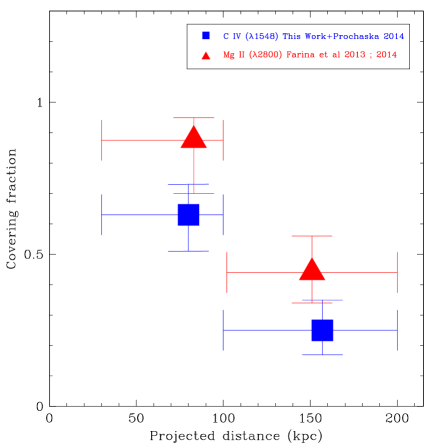
In order to quantify the patchy structure of the absorbing gaseous halos, we investigate the covering fraction of () of C IV in function of PD. We choose a threshold equivalent width EW, which allows one to consider spectra with EW except for one case (QQ14), and two bins of [0-100] kpc and [100-200] kpc. We define for each bin the as the ratio between detected systems over the total number of pairs in the bin. Since the analysis of the covering fraction is sensitive to binning effect and depends on the adopted EWth, we combine our results adopting the same for consistency with those recently drawn in the sample of Prochaska et al. (2014) yielding 7 extra sources. We find that the covering fraction for C IV is (0.30) = for the bin [0-100] kpc while for the case of [100-200] kpc is () = (see Figure 4). Horizontal bars are the bin width while vertical bars are the 1- uncertainties in the calculated upon the binomial statistics (68% Wilson score). We note that the of C IV decreases of about a factor of two between the first bin (0-100 kpc) and the second one (100-200 kpc). It is of interest to compare these results with those derived from the covering fraction of the Mg II. We computed, assuming the same bins and EWth, the for the Mg II by adopting data presented in Farina et al. (2013, 2014) for 26 pairs. We found that () = for the bin [0-100] kpc and () = for [100-200] kpc (see Figure 4).
Both for Mg II and CIV species, the covering fraction of the absorbing material is halved from the region (< 100 kpc) close to the center of the host galaxy to the immediate outer region (100-200 kpc). There is a suggestion that the covering fraction of CIV absorbers is systematically smaller than that of MgII. This behaviour could be related due to different ionisation energies of the two species and/or due to chemical abundances. We note that, although the statistics is small, our finding is also consistent with results based on C II and C IV for a sample of 60 quasar pairs (Prochaska et al., 2014).
Acknowledgements
EPF acknowledges funding through the ERC grant ‘Cosmic Dawn’.
References
- Adelberger et al. (2005) Adelberger, K. L., Shapley, A. E., Steidel, C. C., et al. 2005, ApJ, 629, 636
- Bahcall & Spitzer (1969) Bahcall, J. N., & Spitzer, L., Jr. 1969, ApJ, 156, L63
- Cantalupo et al. (2014) Cantalupo, S., Arrigoni-Battaia, F., Prochaska, J. X., Hennawi, J. F., & Madau, P. 2014, Nature,506, 63
- Cardelli et al. (1989) Cardelli, J. A., Clayton, G. C., & Mathis, J. S. 1989, ApJ, 345, 245
- Cepa et al. (2003) Cepa, J., Aguiar-Gonzalez, M., Bland-Hawthorn, J., et al. 2003, Proc. SPIE, 4841, 1739
- Chen et al. (2001) Chen, H.-W., Lanzetta, K. M., Webb, J. K., & Barcons, X. 2001, ApJ, 559, 654
- Chen & Tinker (2008) Chen, H.-W., & Tinker, J. L. 2008, ApJ, 687, 745
- Churchill et al. (2005) Churchill, C., Steidel, C., & Kacprzak, G. 2005, Extra-Planar Gas, 331, 387
- Churchill et al. (2013) Churchill, C. W., Nielsen, N. M., Kacprzak, G. G., & Trujillo-Gomez, S. 2013, ApJ, 763, L42
- Cortese et al. (2006) Cortese, L., Gavazzi, G., Boselli, A., et al. 2006, A&A, 453, 847
- Di Matteo et al. (2005) Di Matteo, T., Springel, V., & Hernquist, L. 2005, Nature, 433, 604
- Farina et al. (2013) Farina, E. P., Falomo, R., Decarli, R., Treves, A., & Kotilainen, J. K. 2013, MNRAS, 429, 1267
- Farina et al. (2014) Farina, E. P., Falomo, R., Scarpa, R., et al. 2014, MNRAS, 441, 886
- Hennawi et al. (2006) Hennawi, J. F., Prochaska, J. X., Burles, S., et al. 2006, ApJ, 651, 61
- Hennawi & Prochaska (2007) Hennawi, J. F., & Prochaska, J. X. 2007, ApJ, 655, 735
- Hennawi & Prochaska (2013) Hennawi, J. F., & Prochaska, J. X. 2013, ApJ, 766, 58
- Hennawi et al. (2015) Hennawi, J. F., Prochaska, J. X., Cantalupo, S., & Arrigoni-Battaia, F. 2015, Science, 348, 779
- Isobe et al. (1986) Isobe, T., Feigelson, E. D., & Nelson, P. I. 1986, ApJ, 306, 490
- Lanzetta et al. (1995) Lanzetta, K. M., Bowen, D. V., Tytler, D., & Webb, J. K. 1995, ApJ, 442, 538
- Martin et al. (2014) Martin, D. C., Chang, D., Matuszewski, M., et al. 2014, ApJ, 786, 106
- Ménard et al. (2011) Ménard, B., Wild, V., Nestor, D., et al. 2011, MNRAS, 417, 801
- Nestor et al. (2011) Nestor, D. B., Johnson, B. D., Wild, V., et al. 2011, MNRAS, 412, 1559
- Nielsen et al. (2013a) Nielsen, N.M., Churchill, C. W., Kacprzak, G. G., & Murphy, M. T. 2013, ApJ, 776, 114
- Nielsen et al. (2013b) Nielsen, N. M., Churchill, C. W., & Kacprzak, G. G. 2013, ApJ, 776, 115
- Paris et al. (2012) Paris, I., Petitjean, P., Aubourg, É., et al. 2012, A&A, 548, A66
- Prochaska et al. (2014) Prochaska, J. X., Lau, M. W., & Hennawi, J. F. 2014, ApJ, 796, 140
- Prochter et al. (2006) Prochter, G. E., Prochaska, J. X., & Burles, S. M. 2006, ApJ, 639, 766
- Sbarufatti et al. (2006) Sbarufatti, B., Treves, A., Falomo, R., et al. 2006, AJ, 132, 1
- Schlegel et al. (1998) Schlegel, D. J., Finkbeiner, D. P., & Davis, M. 1998, ApJ, 500, 525
- Steidel et al. (2010) Steidel, C. C., Erb, D. K., Shapley, A. E., et al. 2010, ApJ, 717, 289
- Shen & Ménard (2012) Shen, Y., & Ménard, B. 2012, ApJ, 748, 131
- Sulentic et al. (2001) Sulentic, J. W., Rosado, M., Dultzin-Hacyan, D., et al. 2001, AJ, 122, 2993
- Zibetti et al. (2007) Zibetti, S., Ménard, B., Nestor, D. B., et al. 2007, ApJ, 658, 161
QSO pairs spectra for the referee documentation