An HST Survey of the Highest-Velocity Ejecta in Cassiopeia A11affiliation: Based on observations with the NASA/ESA Hubble Space Telescope, obtained at the Space Telescope Science Institute, which is operated by the Association of Universities for Research in Astronomy, Inc.
Abstract
We present Hubble Space Telescope WFC3/IR images of the Cassiopeia A supernova remnant that survey its high-velocity, S-rich debris in the NE jet and SW counterjet regions through [S III] 9069, 9531 and [S II] 10,287 – 10,370 line emissions. We identify nearly 3400 sulfur emitting knots concentrated in 120 wide opposing streams, almost triple the number previously known. The vast majority of these ejecta knots lie at projected distances well out ahead of the remnant’s forward blast wave and main shell ejecta, extending to angular distance of 320′′ to the NE and 260′′ to the SW from the center of expansion. Such angular distances imply undecelerated ejecta knot transverse velocities of 15,600 and 12,700 km s-1 respectively, assuming an explosion date 1670 AD and a distance of 3.4 kpc. Optical spectra of knots near the outermost tip of the NE ejecta stream show strong emission lines of S, Ca, and Ar. We estimate a total mass M⊙ and a kinetic energy of at least erg for S-rich ejecta in the NE jet and SW counterjet. Although their broadness and kinetic energy argue against the Cas A SN being a jet-induced explosion, the jets are kinematically and chemically distinct from the rest of the remnant. This may reflect an origin in a jet-like mechanism that accelerated interior material from a Si,S,Ar,Ca-rich region near the progenitor’s core up through the mantle and H,He,N and O-rich outer layers with velocities that greatly exceeded that of the rapidly expanding photosphere.
Subject headings:
ISM: individual (Cassiopeia A) - ISM: kinematics and dynamics1. Background
In the early evolution of a supernova remnant, dense clumps of the highest-velocity ejecta may experience relatively little deceleration and consequently can catch up and move out ahead of the ever decelerating forward moving shock wave (Hamilton, 1985). This situation has been well demonstrated in laboratory explosion experiments using schlieren and shadow graph techniques (Settles, 2006; Biss et al., 2007). Such clumps interact directly with the progenitor’s circumstellar and interstellar medium and it is this interaction that allows for their detection. However, instances of fast outer ejecta in young supernova remnants are relatively rare.
Although outlying ejecta clumps or “bullets” have been seen in the Vela supernova remnant (Aschenbach et al., 1995; Katsuda & Tsunemi, 2006), the best studied example of SN ejecta located well out ahead of a remnant’s forward blast wave is the young core-collapse remnant Cassiopeia A (Cas A). With a current estimated age of around 345 years (SN 1670: Thorstensen, Fesen, & van den Bergh 2001; Fesen et al. 2006), Cas A is believed to be the remains of a Type IIb supernova event (Krause et al., 2008; Rest et al., 2008, 2011; Besel & Krause, 2012) probably from a red supergiant progenitor with an initial mass in the range of 15–25 M⊙ (Chevalier & Oishi, 2003; Young et al., 2006).
Outside Cas A’s bright main shell of reverse shock heated debris and the remnant’s km s-1 forward shock front (DeLaney & Rudnick, 2003; Patnaude & Fesen, 2009) lie thousands of high-velocity ejecta knots. The brightest few of these outlying ejecta could be seen in the first deep optical images of the remnant (Baade & Minkowski, 1954) and appeared as a faint “flare” of emission line knots extending nearly two arcminutes outside the remnant’s northeast rim (Minkowski, 1959, 1968).
A follow-up study described the flare feature as a “jet” since the emission knots there were arranged in thin streams in near radial alignment with the remnant’s expansion center (van den Bergh & Dodd, 1970). Any high-velocity emission knots outside the remnant’s northeast limb have subsequently been described as being part of this NE emission jet ever since.
Proper motion measurements showed the NE jet knots to be the remnant’s highest velocity material and suggested a slightly later explosion date from that inferred from main shell ejecta measurements (1671 vs. 1653: Kamper & van den Bergh 1976). Jet knots were also found to be brightest in [S II] line emission with weak or absent [O III] emission (van den Bergh & Kamper, 1985) unlike the rest of the remnant’s optical emission knots.
Subsequent optical imaging and spectra identified over a hundred individual knots in the NE jet region (Fesen & Gunderson, 1996). Based on radial distances from Cas A’s expansion center, these ejecta were estimated to have transverse velocities between 7000 and 13,000 km s-1 assuming a remnant distance of 3.4 kpc (Minkowski, 1959; Reed et al., 1995; Alarie et al., 2014). Northeast jet knots were also found to show radial velocities of to km s-1 with the majority centered around zero km s-1 indicating a jet orientation within a few degrees of the plane of the sky (Minkowski, 1968; Fesen & Gunderson, 1996; Milisavljevic & Fesen, 2013).
Deeper optical imaging has revealed the presence of many additional outlying ejecta knots around most regions of the remnant at projected distances out ahead of the remnant’s forward blast wave seen in X-rays. Although initially found only in a small section along the southwest limb and emitting a [N II] dominated emission spectrum unlike the sulfur bright NE jet knots (Fesen et al., 1987), later surveys of the outskirts of the remnant uncovered dozens of additional knots all lying out ahead of the X-ray detected blast wave emission (Fesen, 2001).
The discovery of a SW “counterjet” by Fesen (2001) revealed numerous faint S-rich ejecta knots located far outside Cas A’s southwest limb and positioned nearly on the opposite side of the remnant from the NE jet region. Confirmation of extended emission structure off the remnant’s SW limb was subsequently obtained in both X-rays (Vink, 2004; Hwang et al., 2004) and in the infrared (Hines et al., 2004).
The existence of a possible NE jet – SW counterjet arrangement led some to suspect a bipolar expansion structure for Cas A (Fesen, 2001; Hines et al., 2004; Vink, 2004; Hwang et al., 2004; Fesen et al., 2006; Schure et al., 2008). However, the energy associated with the jets appeared to be too low to drive the supernova (Laming et al., 2006).
Moreover, follow-up optical studies suggested the highest velocity S-rich ejecta were, in fact, arranged in broad fans and not narrow jet-like streams as first thought (Hammell & Fesen, 2008). Three-dimensional velocity reconstructions of the remnant’s main shell and outlying optical ejecta have established that the NE and SW jet regions are on truly opposites sides of the remnant and conically distributed with opening half-angles of at least (Milisavljevic & Fesen, 2013).
The exceptionally high velocities of Cas A’s outer ejecta through the local circumstellar medium lead to their gradual disruption and dissolution. Processes including ejecta knot mass stripping and fragmentation have actually been observed in Cas A (Fesen et al., 2011), thereby permitting us to witness the earliest stages of the enrichment process of the interstellar medium with the products of stellar nucleosynthesis.
A more complete map of the spatial distribution of Cas A’s outer, metal-rich ejecta knots can provide a better understanding of the dynamics and overall asymmetries of this core-collapse SN and knot destruction processes. Toward these goals, we present here a deep reconnaissance of Cas A’s outlying S-rich ejecta which can be used to set limits on the number, peak velocities and kinetic energy of the remnant’s highest-velocity ejecta.
2. Observations
Previous studies have shown that high-velocity, outlying ejecta are best studied in the optical and near-infrared. Optical emission from the northeast and southwest jets can be traced about farther out than in X-rays or infrared, with only a handful of outer optical ejecta knots around the remainder of the remnant detected in even the deepest X-ray and mid-infrared images (see Fesen et al. 2006).
Consequently, we undertook a deep near-infrared image survey of Cas A’s outer ejecta using the Hubble Space Telescope’s (HST) WFC3/IR camera. These images reveal a considerably richer and more extensive debris field around the outskirts of the remnant than previously realized. We also present optical spectra of a few selected outer ejecta knots with the highest apparent transverse velocities. The observations are described in 2 with the results and discussion presented in 3. Locations of the detected S emission knots are shown and marked in several finding charts included in an Appendix.
2.1. Near-infrared Image Data
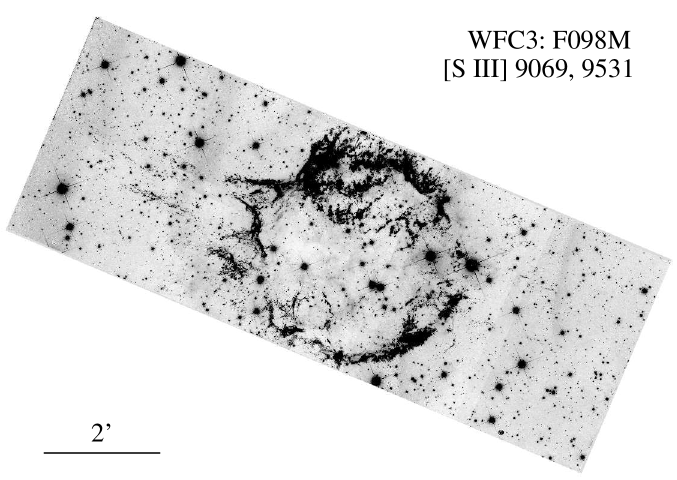
HST images of Cas A were obtained nearly one year apart, on 28 October 2010 and 18 November 2011, using the WFC3/IR camera and the F098M filter. The IR channel of the WFC3 camera consists of a 1k 1k HgCdTe array with a pixel scale of arcsec pixel-1 and a arcsec field of view. Six identical, four-point box dithered pointings were used for both images sets, with a total exposure time for each image set of 22.1 ksec taken in MULTIACCUM mode during five continuous viewing zone orbits.
The bandpass for the F098M filter + WFC3/IR camera is 9000 to 10700 Å with an integrated system throughput 45%. The resulting images were primarily sensitive to [S III] 9069, 9531 and [S II] 10,287–10,370 emission lines. We estimate an flux detection limit of these images to be erg cm-2 s-1.
In order to efficiently cover both NE and SW regions, the images were obtained with a pattern aligned to the 23° position angle axis of the NE/SW jets. This alignment maximized coverage of the remnant’s high-velocity NE and SW streams of outer ejecta knots while also covering the remnant’s bright main shell.
To assist with the removal of WFC3/IR detector cosmetic defects, the six image regions were obtained with considerable overlap. Standard pipeline data reduction of these images was performed using IRAF/STSDAS111IRAF is distributed by the National Optical Astronomy Observatories, which is operated by the Association of Universities for Research in Astronomy, Inc. (AURA) under cooperative agreement with the National Science Foundation. The Space Telescope Science Data Analysis System (STSDAS) is distributed by the Space Telescope Science Institute.. This included debiasing, flat-fielding, geometric distortion corrections, photometric calibrations, and cosmic ray and hot pixel removal. The STSDAS drizzle task was also used to combine single exposures in each filter and mosaic them together to form one image.
Figure 1 is a mosaic of Cas A made from the six WFC3/IR images taken in November 2011 with WFC3/IR + F098M. Because the images were taken in Continuous Viewing Zone (CVZ) orbits, background level in this composite image is not completely uniform due mainly to Earthshine contamination experienced by some of the six individual exposures. This resulted in spurious diffuse background emission in some areas. Nonetheless, a band of diffuse emission 1′ off the southeastern limb of the remnant appears to be real.
2.2. Optical Spectra
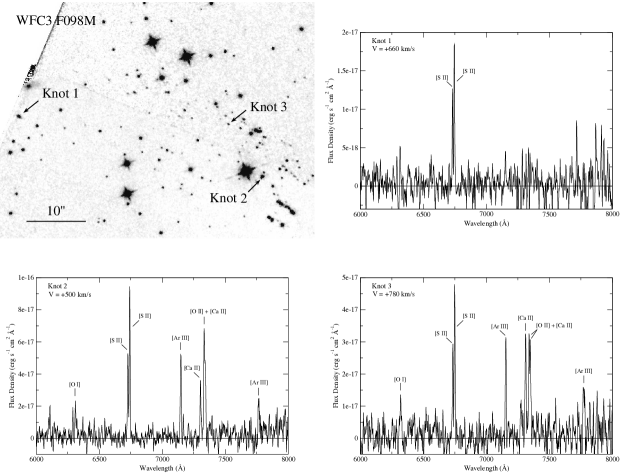
Ground-based optical spectra of three outlying ejecta knots detected on these images were obtained in January and December 2012 with the MMT 6.5 m telescope using the Blue Channel instrument (Schmidt et al., 1989). A 300 l mm-1 grating and a slit were used to obtain spectra of three outer ejecta knots near the tip of the NE jet. Spectra have a FWHM of 7 Å resolution and covered the wavelength region of Å. Exposures were each 600 sec in duration.
3. Results and Discussion
3.1. The Population of High-Velocity S-rich Ejecta
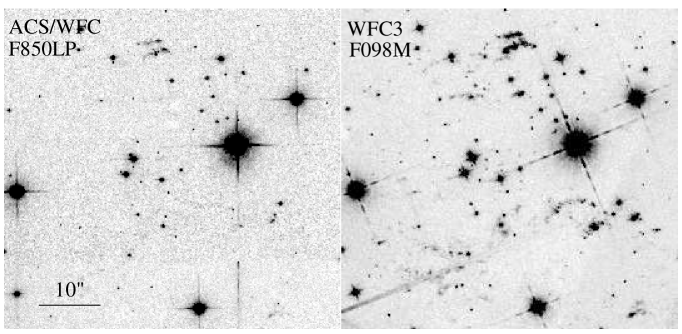
The most complete previous survey of Cas A’s outer ejecta knots was that of Hammell & Fesen (2008) using HST’s Advanced Camera for Surveys (ACS). Images were obtained in March and December 2004 using multiple broadband filters to isolate various emission lines. They reported finding a total of 1825 knots. Of these, filter flux ratios indicated 444 were dominated by [N II] 6548, 6583 Å line emissions, 192 dominated by [O II] 7319,7330 Å, and 1189 knots with strong [S II] 6716, 6731 Å similar to the “fast-moving knots” (FMKs) commonly found in the main shell.
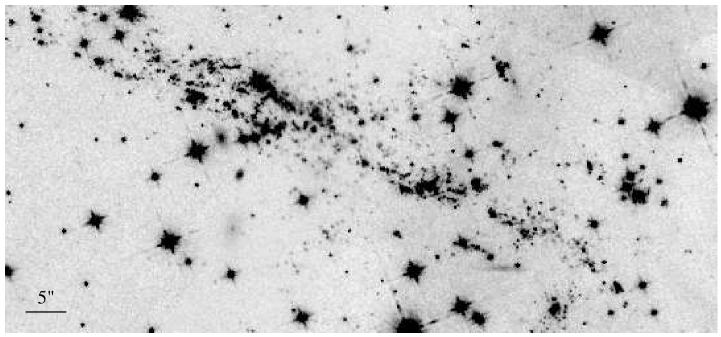
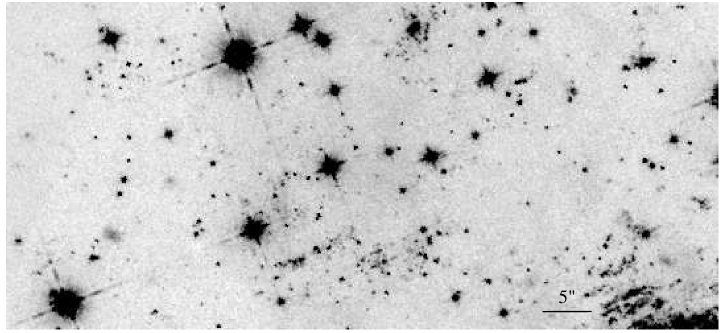
Our WFC3/IR F098M images of Cas A detected much fainter ejecta knots around Cas A’s periphery than the previous ACS F850LP images. This is shown in Figure 2 where we compare ACS and WFC3 images of the same region along Cas A’s western limb. This dramatic difference is mainly due to the greater sensitivity of WFC3’s IR channel to [S II] and [S III] line emission.
Consequently, the WFC3/IR + F098M images uncovered a more extensive debris field of outer, S-rich ejecta knots than previously realized both in and outside of the NE/SW jet regions. We were able to identify 3394 emission knots, nearly triple the 1189 S-rich FMK-like knots previously cataloged (Hammell & Fesen, 2008). This number is also roughly an order of magnitude more than 444 and 192 known outer [N II] and [O II] knots, respectively (Hammell & Fesen, 2008). (Note: Finding charts marking the locations of all WFC3 detected outer ejecta knots are presented in Appendix A.)
Because all outer ejecta knots are only visible through strong interaction with the local interstellar medium, these 3400 outer ejecta knots most likely represent only a fraction of the true population of outer debris fragments. In addition, the strength of this knot–ISM interaction may vary as the knot moves through ISM regions of varying density (Fesen et al., 2011).
Variability of outer ejecta knots is not uncommon in the NE jet and along the remnant’s eastern limb where high-velocity, outer ejecta are passing through a highly inhomogeneous ISM or CSM (Fesen et al., 2011). Many outlying ejecta knots have been observed to significantly brighten and fade on timescales less than one year.
In addition to variable emission flux levels and emission levels below our detection limit, there is reason to suspect considerably more ejecta knots lie within the SW jet and along the remnant’s western limb than these WFC3 images reveal. The number of ejecta knots in the NE jet is nearly five times that seen in the SW jet and this imbalance may have more to do with greater extinction along the western and southwestern limbs of Cas A due to the presence of a molecular cloud there (Anderson & Rudnick, 1996; Keohane et al., 1996; Kilpatrick et al., 2014) than simply an unequal ejection of material.
3.2. The Spatial Distribution of Outer S-rich Ejecta
Milisavljevic & Fesen (2013) showed that the NE and SW streams of exceptionally high-velocity ejecta (v 8000 km s-1) are arranged in opposing and wide-angle outflows as initially suggested by their visual appearance in optical images (Fesen, 2001; Fesen et al., 2006), in infrared images (Hines et al., 2004), and X-ray images (Vink, 2004; Hwang et al., 2004; Schure et al., 2008). To explore the nature of these opposing streams of S-rich ejecta knots, we compared their spatial distribution to other chemically different outlying high-velocity ejecta.
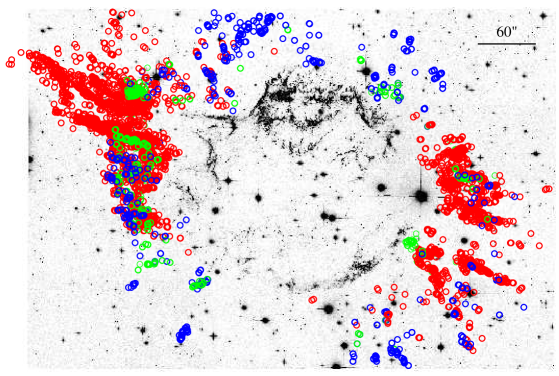
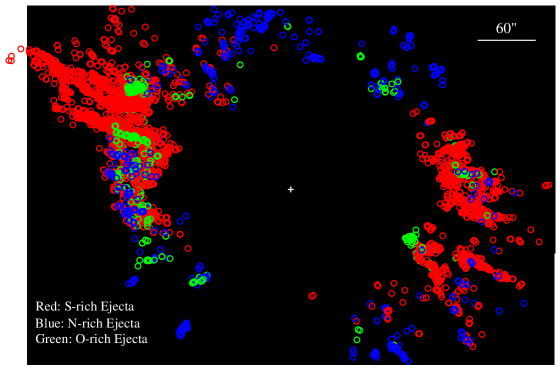
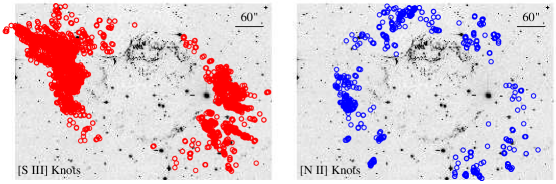
We begin by addressing differences in the distribution of the S-rich ejecta versus those that are N-rich or O-rich as defined by relative emission lines strengths described by Hammell & Fesen (2008). In Figure 3 we show the 2D spatial distributions of S-rich, N-rich, and O-rich ejecta where the locations of S-rich knots are the nearly 3400 found from the present WFC3 images while the 444 N-rich and 192 O-rich knots are those from Hammell & Fesen (2008).
As shown in this figure, S-rich knots occupy a much more limited position angle range while also extending to larger radial distances from the remnant’s expansion center, marked by the small white cross in the lower figure panel. The farthest S-rich knots extend 320′′ to the northeast and 260′′ to the southwest from the remnant’s center of expansion implying undecelerated ejecta knot transverse velocities of 15,600 and 12,700 km s-1 respectively, assuming an explosion date 1670 AD and a distance of 3.4 kpc. These velocities can be compared to maximum transverse velocities based on proper motions of 13,500 km s-1 and 11,500 km s-1 for N-rich and O-rich ejecta, respectively (Hammell & Fesen, 2008).
Particularly striking are the differences in spatial distributions between the three chemically distinct ejecta types. Figure 4 shows N-rich knots arranged in a broad shell with two notable gaps in the north and south (for a discussion of these gaps see Fesen et al. 2006), whereas S-rich knots are concentrated in the NE jet and SW counterjet regions. The limited position angle and radial distance of [O II] bright knots (Fig. 3) has been discussed by Hammell & Fesen (2008) who noted increased density of such O-rich knots near the base of the NE and SW jet regions.
3.2.1 Clumpy Nature of High-Velocity Ejecta
It is not surprising that the fastest, outermost ejecta in Cas A are in the form of small dense clumps. Ejecta clump formation in core-collapse supernovae has long been predicted on theoretical grounds (Gull, 1975; Chevalier & Klein, 1978; Kifonidis et al., 2000; Wang, 2005) and is supported by considerable observational evidence from both galactic (Aschenbach et al., 1995; Winkler & Long, 2006; Milisavljevic & Fesen, 2013) and extragalactic (Filippenko & Sargent, 1989; McCray, 1993; Spyromilio, 1994; Fassia et al., 1998; Matheson et al., 2000; Elmhamdi et al., 2004) supernova and supernova remnant studies.
Furthermore, several studies have investigated the dynamical interaction when SN ejecta travel through the surrounding medium (Hamilton, 1985; Jones et al., 1994; Anderson et al., 1994; Cid-Fernandes et al., 1996; Bykov, 2002; Wang & Chevalier, 2002). A standard feature of such ejecta clump/ISM interactions is that a shock is driven into the ejecta knot, which subsequently undergoes compression and lateral deformation. Internal shock heating and subsequent cooling via radiative processes generate substantial X-ray, UV and optical line emissions in ejecta knots, thus allowing them to be detected.
3.3. Spectra of the Outermost NE Jet Knots
Optical spectra of three ejecta knots located in the outer region of the NE jet are shown in Figure 5 along with a finding chart showing which knots were observed. As seen in previous spectra of some of the farthest outlying knots in both the NE and SW jets, two spectral properties of these outer ejecta are strikingly apparent.
The first property is the remarkably low Doppler velocities observed despite very large angular distances from the Cas A expansion point. Although the mid-sections of both jets exhibit radial velocities which can range between and +5500 km s-1 (Fig. 7 in Fesen & Gunderson 1996), ejecta knots farthest out have much lower radial velocities, typically under 800 km s-1 (Fesen & Gunderson, 1996; Fesen, 2001; Milisavljevic & Fesen, 2013).
Our new spectra of the outer knots in the NE jet confirm this finding. Such low radial velocities for the fastest moving ejecta, whose proper motions imply transverse velocities well above 12,000 km s-1, indicate an orientation within a few degrees of the plane of the sky. The situation is less clear for the SW jet due to far fewer ejecta spectra (Fesen, 2001; Milisavljevic & Fesen, 2013). Nonetheless, the few SW knots with radial distances implying transverse velocities above 12,000 km s-1 lie within 10 degrees of the plane of the sky.
The second property of the fastest ejecta knots in the NE jet is the unusual strength of their [Ca II] 7291,7324 Å and [Ar III] 7136, 7751 Å emission lines relative to [S II] 6716, 6731 Å. Out of the hundreds of main shell ejecta observed (Hurford & Fesen, 1996; Milisavljevic & Fesen, 2013), only a small handful of ejecta show comparable [Ca II] and [Ar III] line strengths; the so-called “strong Calcium FMKs” (Hurford & Fesen, 1996).
These S-Ca-Ar outer jet knots also exhibit unusually weak oxygen line emissions compared to main shell ejecta and have been interpreted as unmixed material from the thin, Si-Ar-Ca rich layer common in high mass progenitor models. However, we note that in Knots 2 and 3, some [O II] 7320, 7330 Å line emission is also present.
While our spectra are consistent with previously reported outer NE jet knot spectra (Fesen & Gunderson, 1996; Milisavljevic & Fesen, 2013), the presence of the [Ar III] line emissions are more clearly seen here especially with respect to the weaker [Ar III] 7751 Å line. The fact that these S-Ca-Ar knots are the fastest detected ejecta in the NE jet has been argued as evidence that inner Si, S, Ar, Ca-rich material was somehow ejected up through overlying material in certain regions, attaining final outward velocities greater than the progenitor’s N and He-rich surface layers (Fesen, 2001; Fesen et al., 2006; Milisavljevic & Fesen, 2013).
3.4. Mass and Energy of Outer Ejecta Knots
Based on the higher resolution ACS images, the average angular size of a bright S-rich knot is close to , with most fainter ones unresolved (). Although we have little direct information about knot emission filling factor, f, but many of the larger ejecta clumps () show indications of some substructure below HST’s image resolution suggesting values less than unity. However, smaller knots appear nearly stellar suggesting values closer to one.
At a distance of 3.4 kpc, an angular diameter of , an electron density of 4000 cm-3 (Fesen, 2001; Fesen et al., 2011), an average filling factor, f, of 0.5, and a composition of mostly singly and doubly ionized S, Ar, and Ca, a single S-rich knot would have an estimated mass of kg.
We have identified 3400 S-rich knots from the WFC3 [S II] + [S III] images. Using the above knot mass estimate, this means a total mass of M⊙ for high-velocity S-rich ejecta. Although much of the NE jet’s emission arises from a few dozen larger knots with angular diameters of to and hence are the most massive, they are not numerous enough to significantly change this mass estimate.
However, this mass estimate of outlying ejecta is likely a lower limit since it pertains only to dense clumps. Extended diffuse material in both jets cannot be ruled out, plus as noted above there may be hundreds more knots undetected in our survey in the SW jet along the western limb due to significant extinction there. This along with possible emission filling factors greater than 0.5 means that the total jet/counterjet mass could be M⊙.
Assuming this ejecta mass, one can then estimate the energetics contained in the remnant’s broad NE/SW jet/counterjet flow. The full range of proper motions seen in all outer ejecta is to yr-1 (Hammell & Fesen, 2008) which translates into transverse velocities of 7000 to 15,000 km s-1. However, the average proper motion is only around corresponding to a transverse velocity of 10,000 km s-1 (Hammell & Fesen, 2008). Using this average value, we estimate a total kinetic energy of the NE/SW bipolar flows of (Nknots/3400) (ne/4000 cm-3) (f/0.5) erg. Interestingly, this same energy value was estimated by Laming et al. (2006) for just the NE jet alone based on hydrodynamical models. Schure et al. (2008) derived a lower limit for the jet/counterjet system of erg also from hydrodynamic modeling.
4. The Nature of the Jet/Counterjet
The nature and significance of Cas A’s jet/counterjet expansion asymmetry has long been and remains controversial. Early on, Minkowski (1968) suggested the NE jet might be the sole surviving part of an outer, high-velocity shell that has been subsequently decelerated in all other directions. This view was later supported by Blondin et al. (1996) who argued that a jet-like feature of SN ejecta could be generated in the progenitor’s equatorial plane due to pole/equator density gradients in the local CSM.
However, most researchers now agree that the high-velocity ejecta along the NE–SW limbs of Cas A point to a real and significant asymmetrical expansion of the Cas A supernova (Laming et al., 2006; DeLaney et al., 2010; Hwang & Laming, 2012; Milisavljevic & Fesen, 2013). What they disagree on is the importance and relevance of the NE/SW jets to the dynamics of the supernova explosion engine.
Although recently confirmed as being directly opposite of each other and thus forming a true NE/SW bipolar expansion (Milisavljevic & Fesen, 2013), the possibility of other high-velocity outflows in the remnant’s emission features has raised questions about the uniqueness of the NE/SW jet/counterjet axis. A very different explosion axis has been proposed by Wheeler et al. (2008) based on the presence of Fe-rich ejecta seen outside the remnant’s SW limb. DeLaney et al. (2010) suggested that the NE/SW structure is one of several “pistons” of high-velocity ejecta, including an O-Ne rich ejecta alignment along Cas A’s north and south limbs.
4.1. Evidence for an Explosive Origin
While there are velocity and abundance variations along Cas A’s main shell, none match those observed in the NE and SW jet regions. There, ejecta velocities can reach 15,000 km s-1. In addition, the location of the NE jet at an obvious rupture point in the remnant’s main shell of emission along with the prominent appearance of the NE and SW jets in X-rays and infrared images of the remnant has helped to fuel the debate regarding their significance in understanding the core-collapse mechanism.
Several peculiar properties seen only in the NE/SW jet regions also suggest an explosive origin. These include: 1) the presence of “mixed ejecta knots” that show a combination of H and N emissions in addition to O, S, and Ar lines, suggesting a turbulent mixing of photospheric and inner layers, 2) the nearly perpendicular proper motion of the remnant’s central X-ray point source to the NE/SW jet axis (Fesen et al., 2006), and 3) the unusually weak [O III] 4959, 5007 Å line emission of jet knots despite their very high velocities (Fesen & Gunderson 1996; Fig. 5).
The fact that S-Ar-Ca rich knots are the fastest detected ejecta in the NE jet has been taken as evidence for locations where inner Si, S, Ar, Ca-rich material was somehow ejected up through overlying material, attaining final outward velocities greater than the progenitor’s N and He-rich surface layers (Fesen, 2001; Fesen et al., 2006; Milisavljevic & Fesen, 2013). Hydrodynamic models by Laming et al. (2006) also support the picture where the NE/SW jets are the result of unusually high-velocity material expelled during the explosion and not low density regions in the surrounding ISM as proposed by Blondin et al. (1996). Interestingly, Kilpatrick et al. (2014) recently attributed Doppler broadened CO emission at millimeter wavelengths from molecular clouds located nearby and to the southwest of Cas A to be the caused by interaction between Cas A’s bipolar high-velocity outflows and the molecular gas.
An explosive origin means that our energy estimate of erg discussed above may be an underestimate since it does not include the energy needed to propel jet material up through the progenitor’s outer layers. This added energy, together with the possibility of additional mass from undetected diffuse jet material, means the jets likely contain 10% or more of the expected 1051 erg supernova explosion energy.
4.2. The Role of Jets in the Cas A Supernova
A particularly important aspect of Cas A’s jets is their lack of Fe-rich ejecta. In jet-induced explosion models, considerable Fe-rich ejecta is expected to be found in high-velocity jet regions (Khokhlov et al., 1999). However, no Fe-rich ejecta is seen in either the NE or SW jets, whereas X-ray observations show considerable Fe-rich ejecta elsewhere in the remnant with velocities as high as 7000 km s-1 (Hughes et al., 2000; Hwang & Laming, 2003).
Both the NE and SW jets show strong Si enrichment in X-rays (Vink, 2012) and our optical spectra show that the fastest moving knots near the tip of the NE jet exhibit unusually strong Ar and Ca emissions. While this may indicate that NE/SW jet material originates from layers deep inside the progenitor, it is not clear how such a high-velocity, jet/counterjet bipolar structure fits into the overall core-collapse explosion dynamics.
Rather than being signatures of a jet-driven explosion, current observations indicate the Cas A supernova explosion was most likely the result of uneven neutrino heating. Spatial mapping of radioactive 44Ti emission appears to rule out a strongly bipolar explosion and instead favors low-mode convective instability (Grefenstette et al., 2014). The remnant’s bubble-like interior morphology that smoothly connects with multi-ringed structures seen in the main shell of expanding debris is consistent with this picture (Milisavljevic & Fesen, 2015).
Doppler mapping of the X-ray bright Fe-K emission in Cas A has shown that three sizable portion of Fe-rich material sits within three of these rings (DeLaney et al., 2010; Milisavljevic & Fesen, 2013). Thus, Cas A’s large internal cavities of non-radioactive ejecta may have originated from turbulent mixing processes that encouraged the development of outwardly expanding plumes of radioactive 56Ni-rich ejecta.
Burrows (2005) proposed that the morphology and debris pattern of Cas A and the NE/SW jets may have an origin in two “explosions” taking place at different times: one, the neutrino-driven supernova, and the other a MHD jet or B-field-modified proto-neutron star wind. In this picture, the NE/SW outflows would have emerged after the supernova explosion from the core region and into the already expanding supernova debris.
4.3. A Continuum of Supernovae with Jets
It is of interest to consider our findings in the context of recent work on supernovae that have established a continuum of explosion energies extending from broad-lined Type Ic SNe associated with gamma-ray bursts, to more ordinary Type Ib/c SNe (Soderberg et al., 2010; Chakraborti et al., 2015). The existence of such events suggests that a wide variety of jet activity may potentially be occurring at energies that are hidden observationally (Margutti et al., 2014; Milisavljevic et al., 2015). In these cases, the central engine activity stops and becomes “choked” before the jet is able to pierce through the stellar envelope. Supernovae associated with choked jets lack sizable amounts of relativistic ejecta and thus can be dynamically indistinguishable from ordinary core-collapse SNe (Lazzati et al., 2012)
Whether or not the jet successfully emerges from the star is dependent on many factors. Perhaps the most important factor is core rotation at the time of core collapse. For most supernovae, rotation effects would be small and the explosion neutrino-driven. However, in a small subset of cases where core rotation of the presupernova star is rapid, magnetic fields will be amplified and make magnetohydrodynamic (MHD) power influential (Akiyama et al., 2003). In extreme cases where the rotation rate is very fast, MHD processes could dominate and a hypernova and/or a GRB could result (Woosley & Bloom, 2006; Burrows et al., 2007). Another factor is the progenitor star size and composition. Large stellar envelopes and/or He layers may inhibit central jets from completely piercing the surface of the star (e.g., Mazzali et al. 2008).
Given that the energy associated with the NE/SW jets of Cas A is an order of magnitude below the energy anticipated to be associated with the original supernova explosion, any observational signature of their presence would be hidden in SNe at extragalactic distances. Only through nearby, resolved inspection can we be aware of their existence. In this context, the jet/counterjet in Cas A may be interpreted as evidence for a continuum of jet activity strength in core-collapse supernova explosions.
5. Conclusions
We have presented deep HST WFC3/IR images of the Cassiopeia A supernova remnant in order to survey its highest velocity debris in the NE jet/SW counterjet regions. These high resolution, near-infrared images provide the deepest and most complete inventory of the remnant’s highest-velocity, metal-rich material with unsurpassed detail and depth.
We conclude the following:
1) Roughly 3400 outlying sulfur emitting knots are detected, which is nearly triple the previously known number. The majority of newly detected knots lie at projected distances well out ahead of the remnant’s forward blast wave and main shell ejecta with estimated transverse velocities approaching km s-1, some 8000 km s-1 more than than the bulk ejecta in the remnant’s reverse shock heated main shell. Because the jet knots extend out to the edge of the WFC3 detector in the NE region (Fig. 5), the true extent of the outflow is unknown and more material at even greater velocities may exist.
2) Assuming a significant number of additional ejecta knots lie undetected due to a lack of strong CSM/ISM interaction leading to detectable shock emission plus undetected knots in the high extinction SW jet region, we estimate a total mass of M⊙ for the remnant’s high-velocity, outlying S-rich ejecta. Using this mass and the observed expansion velocities, we estimate that the kinetic energy imparted to the NE/SW jets was erg. However, this may be an underestimate since it does not include the energy needed to propel jet material up through the progenitor’s outer layers. This, together with the possibility of additional mass from undetected diffuse jet material, means the jets could contain 10% or more of the overall expected 1051 erg supernova explosion energy.
3) Optical spectra of ejecta knots near the farthest tip of the NE ejecta stream are dominated by emission lines of S, Ca, and Ar. These spectra are significantly different from the main shell ejecta especially in their strength of [Ar III] 7136,7751 and [Ca II] 7291,7324 line emissions.
4) The NE jet and SW counterjet streams of ejecta are chemically and kinematically unlike any other observed areas of Cas A. They appear to have formed around the time of core collapse by an explosive, jet-like mechanism that accelerated interior material from the Si–S–Ar–Ca rich regions near the progenitor’s core up through and out past the He and O rich outer layers with velocities that greatly exceeded that of the expanding photosphere.
Our findings are generally consistent with the dynamical scenario put forth by Burrows (2005) who proposed that the NE and SW jet/counterjet is associated with a proto-neutron star wind that emerged after the neutrino-driven supernova explosion and pushed into the expanding, turbulently mixed supernova debris. They are also consistent with the notion that a continuum of high-velocity, bipolar expansions may exist in core-collapse supernovae.
References
- Akiyama et al. (2003) Akiyama, S., Wheeler, J. C., Meier, D. L., & Lichtenstadt, I. 2003, ApJ, 584, 954
- Alarie et al. (2014) Alarie, A., Bilodeau, A., & Drissen, L. 2014, MNRAS, 441, 2996
- Anderson et al. (1994) Anderson, M. C., Jones, T. W., Rudnick, L., Drills, I. L., & Kang, H. 1994, ApJ, 421, L31
- Anderson & Rudnick (1995) Anderson, M. C., & Rudnick, L. 1995, ApJ, 441, 307
- Anderson & Rudnick (1996) Anderson, M. C., & Rudnick, L. 1996, ApJ, 456, 234
- Ardavan (1973) Ardavan, H. 1973, ApJ, 184, 435
- Aschenbach et al. (1995) Aschenbach, B., Egger, R., & Trumper, J. 1995, Nature, 373, 587
- Baade & Minkowski (1954) Baade, W., & Minkowski, R. 1954, ApJ, 119, 206
- Besel & Krause (2012) Besel, M.-A., & Krause, O. 2012, A&A, 541, L3
- Blondin et al. (1996) Blondin, J. M., Lundqvist, P., & Chevalier, R. A. 1996, ApJ, 472, 257
- Biss et al. (2007) Biss, M. M., Hargather, M. J., Settles, G. S., Dodson, L. J., & Miller, J. D., 2007, Proceedings of the 26th International Symposium on Shock Waves, Göttingen, Germany
- Burrows (2005) Burrows, A. 2005, 1604-2004: Supernovae as Cosmological Lighthouses, 342, 184
- Burrows et al. (2007) Burrows, A., Dessart, L., Livne, E., Ott, C. D., & Murphy, J. 2007, ApJ, 664, 416
- Bykov (2002) Bykov, A. M. 2002, A&A, 390, 327
- Chakraborti et al. (2015) Chakraborti, S., Soderberg, A., Chomiuk, L., et al. 2015, ApJ, 805, 187
- Chevalier & Klein (1978) Chevalier, R. A., & Klein, R. I. 1978, ApJ, 219, 994
- Chevalier & Oishi (2003) Chevalier, R. A., & Oishi, J. 2003, ApJ, 593, L23
- Cid-Fernandes et al. (1996) Cid-Fernandes, R., Plewa, T., Rózyczka, M., Franco, J., Terlevich, R., Tenorio-Tagle, G., & Miller, W. 1996, MNRAS, 283, 419
- DeLaney & Rudnick (2003) DeLaney, T., & Rudnick, L. 2003, ApJ, 589, 818
- DeLaney et al. (2010) DeLaney, T., Rudnick, L., Stage, M. D., et al. 2010, ApJ, 725, 2038
- Elmhamdi et al. (2004) Elmhamdi, A., Danziger, I. J., Cappellaro, E., Della Valle, M., Gouiffes, C., Phillips, M. M., & Turatto, M. 2004, A&A, 426, 963
- Ennis et al. (2006) Ennis, J. A., Rudnick, L., Reach, W. T., et al. 2006, ApJ, 652, 376
- Fassia et al. (1998) Fassia, A., Meikle, W. P. S., Geballe, T. R., Walton, N. A., Pollacco, D. L., Rutten, R. G. M., & Tinney, C. 1998, MNRAS, 299, 150
- Fesen et al. (1987) Fesen, R. A., Becker, R. H., & Blair, W. P. 1987, ApJ, 313, 378
- Fesen (2001) Fesen, R. A. 2001, ApJS, 133, 161
- Fesen et al. (2006) Fesen, R. A., et al. 2006, ApJ, 645, 283
- Fesen et al. (2011) Fesen, R. A., Zastrow, J. A., Hammell, M. C., Shull, J. M., & Silvia, D. W. 2011, ApJ, 736, 109
- Fesen & Gunderson (1996) Fesen, R. A., & Gunderson, K. S. 1996, ApJ, 470, 967
- Filippenko & Sargent (1989) Filippenko, A. V., & Sargent, W. L. W. 1989, ApJ, 345, L43
- Grefenstette et al. (2014) Grefenstette, B. W., Harrison, F. A., Boggs, S. E., et al. 2014, Nature, 506, 339
- Gull (1975) Gull, S. F. 1975, MNRAS, 171, 263
- Hammell & Fesen (2008) Hammell, M. C., & Fesen, R. A. 2008, ApJS, 179, 195
- Hamilton (1985) Hamilton, A. J. S. 1985, ApJ, 291, 523
- Hines et al. (2004) Hines, D. C., Rieke, G. H., Gordon, K. D., et al. 2004, ApJS, 154, 290
- Hughes et al. (2000) Hughes, J. P., Rakowski, C. E., Burrows, D. N., & Slane, P. O. 2000, ApJ, 528, L109
- Hurford & Fesen (1996) Hurford, A. P., & Fesen, R. A. 1996, ApJ, 469, 246
- Hwang & Laming (2003) Hwang, U., & Laming, J. M. 2003, ApJ, 597, 362
- Hwang et al. (2004) Hwang, U., et al. 2004, ApJ, 615, L117
- Hwang & Laming (2012) Hwang, U., & Laming, J. M. 2012, ApJ, 746, 130
- Jones et al. (1994) Jones, T. W., Kang, H., & Tregillis, I. L. 1994, ApJ, 432, 194
- Kamper & van den Bergh (1976) Kamper, K., & van den Bergh, S. 1976, ApJS, 32, 351
- Katsuda & Tsunemi (2006) Katsuda, S., & Tsunemi, H. 2006, ApJ, 642, 917
- Keohane et al. (1996) Keohane, J. W., Rudnick, L., & Anderson, M. C. 1996, ApJ, 466, 309
- Kifonidis et al. (2000) Kifonidis, K., Plewa, T., Janka, H.-T., Müller, E. 2000, ApJ, 531, L123
- Kilpatrick et al. (2014) Kilpatrick, C. D., Bieging, J. H., & Rieke, G. H. 2014, ApJ, 796, 144
- Khokhlov et al. (1999) Khokhlov, A. M., Höflich, P. A., Oran, E. S., et al. 1999, ApJ, 524, L107
- Krause et al. (2008) Krause, O., Birkmann, S. M., Usuda, T., Hattori, T., Goto, M., Rieke, G. H., & Misselt, K. A. 2008, Science, 320, 1195
- Laming et al. (2006) Laming, J. M., Hwang, U., Radics, B., Lekli, G., & Takács, E. 2006, ApJ, 644, 260
- Lazzati et al. (2012) Lazzati, D., Morsony, B. J., Blackwell, C. H., & Begelman, M. C. 2012, ApJ, 750, 68
- Margutti et al. (2014) Margutti, R., Milisavljevic, D., Soderberg, A. M., et al. 2014, ApJ, 797, 107
- Matheson et al. (2000) Matheson, T., Filippenko, A. V., Ho, L. C., Barth, A. J., & Leonard, D. C. 2000, AJ, 120, 1499
- Mazzali et al. (2008) Mazzali, P. A., Valenti, S., Della Valle, M., et al. 2008, Science, 321, 1185
- McCray (1993) McCray, R. 1993, ARA&A, 31, 175
- McKee (1974) McKee, C. F. 1974, ApJ, 188, 335
- Milisavljevic & Fesen (2013) Milisavljevic, D., & Fesen, R. A. 2013, ApJ, 772, 134
- Milisavljevic & Fesen (2015) Milisavljevic, D., & Fesen, R. A. 2015, Science, 347, 526
- Milisavljevic et al. (2015) Milisavljevic, D., Margutti, R., Parrent, J. T., et al. 2015, ApJ, 799, 51
- Minkowski (1959) Minkowski, R. 1959, URSI Symp. 1: Paris Symposium on Radio Astronomy, 9, 315
- Minkowski (1968) Minkowski, R. 1968, Nebulae and Interstellar Matter, 623
- Müller et al. (1991) Müller, E., Fryxell, B., & Arnett, D. 1991, A&A, 251, 505
- Patnaude & Fesen (2009) Patnaude, D. J., & Fesen, R. A. 2009, ApJ, 697, 535
- Reed et al. (1995) Reed, J. E., Hester, J. J., Fabian, A. C., & Winkler, P. F. 1995, ApJ, 440, 706
- Rest et al. (2008) Rest, A., et al. 2008, ApJ, 681, L81
- Rest et al. (2011) Rest, A., et al. 2011, ApJ, 732, 3
- Schmidt et al. (1989) Schmidt, G. D., Weymann, R. J., & Foltz, C. B. 1989, PASP, 101, 713
- Schure et al. (2008) Schure, K. M., Vink, J., García-Segura, G., & Achterberg, A. 2008, ApJ, 686, 399
- Settles (2006) Settles, G.S. 2006, American Scientist, 94, 22
- Soderberg et al. (2010) Soderberg, A. M., Chakraborti, S., Pignata, G., et al. 2010, Nature, 463, 513
- Spyromilio (1994) Spyromilio, J. 1994, MNRAS, 266, L61
- Thorstensen, Fesen, & van den Bergh (2001) Thorstensen, J. R., Fesen, R. A., & van den Bergh, S. 2001, AJ, 122, 297
- van den Bergh & Dodd (1970) van den Bergh, S., & Dodd, W. W. 1970, ApJ, 162, 485
- van den Bergh & Kamper (1985) van den Bergh, S., & Kamper, K. 1985, ApJ, 293, 537
- Vink (2004) Vink, J. 2004, New Astronomy, 48, 61
- Vink (2012) Vink, J. 2012, A&A Rev., 20, 49
- Wang (2005) Wang, C.-Y. 2005, ApJ, 626, 183
- Wang & Chevalier (2002) Wang, C.-Y., & Chevalier, R. A. 2002, ApJ, 574, 155
- Wheeler et al. (2008) Wheeler, J. C., Maund, J. R., & Couch, S. M. 2008, ApJ, 677, 1091
- Winkler & Long (2006) Winkler, P. F., & Long, K. S. 2006, AJ, 132, 360
- Woosley & Bloom (2006) Woosley, S. E., & Bloom, J. S. 2006, ARA&A, 44, 507
- Young et al. (2006) Young, P. A., Fryer, C. L., Hungerford, A., et al. 2006, ApJ, 640, 891
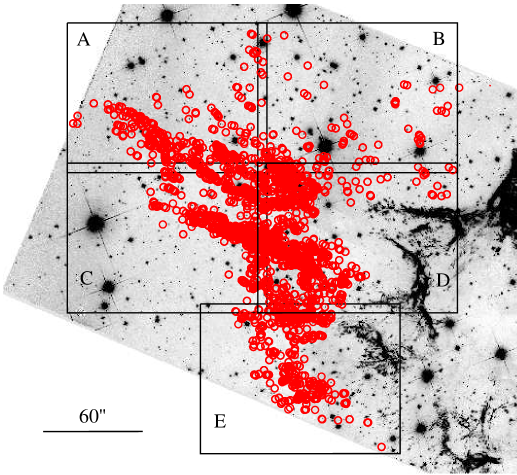
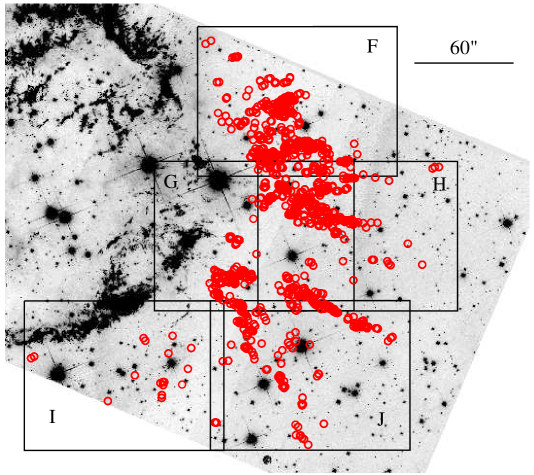
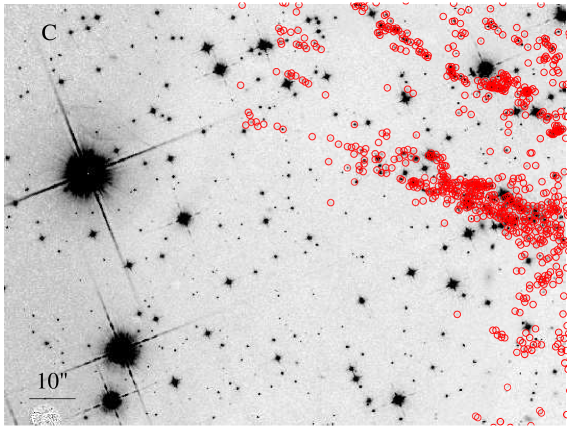
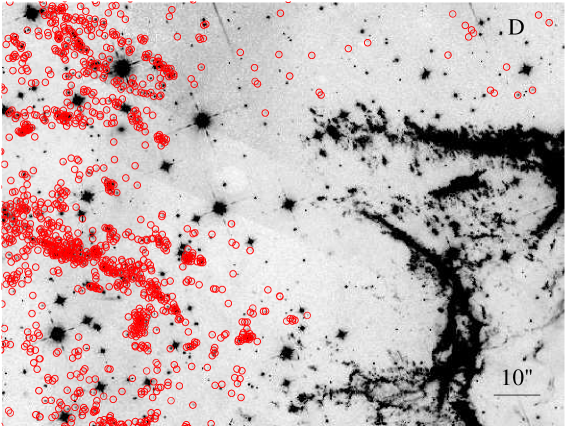
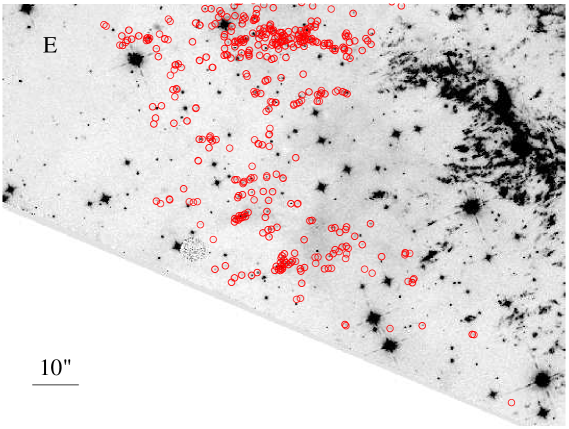
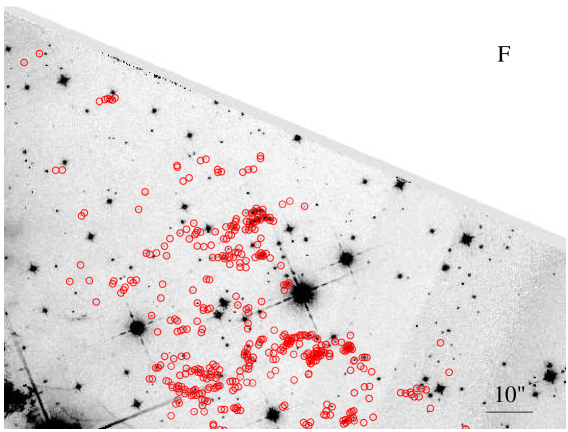
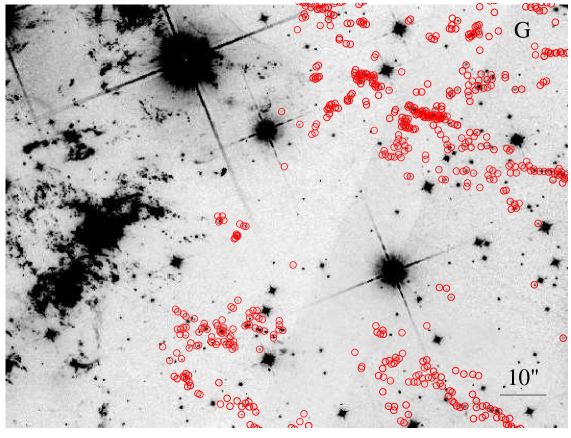
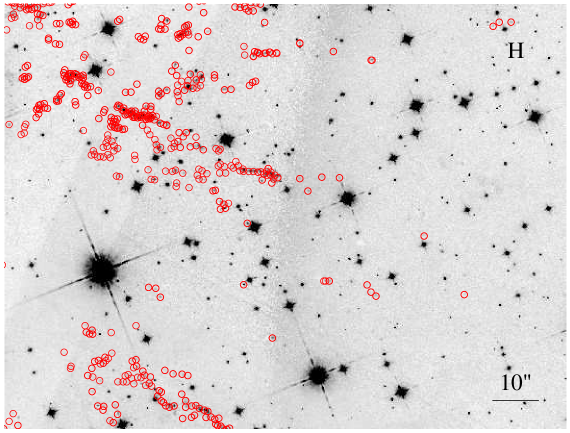
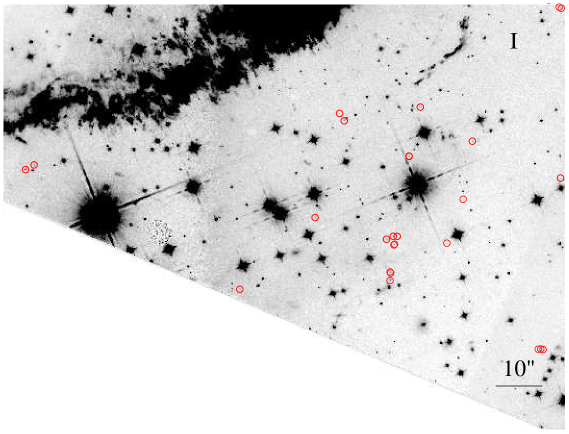
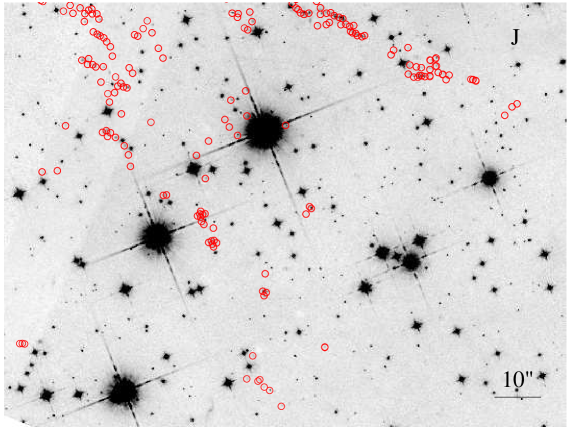
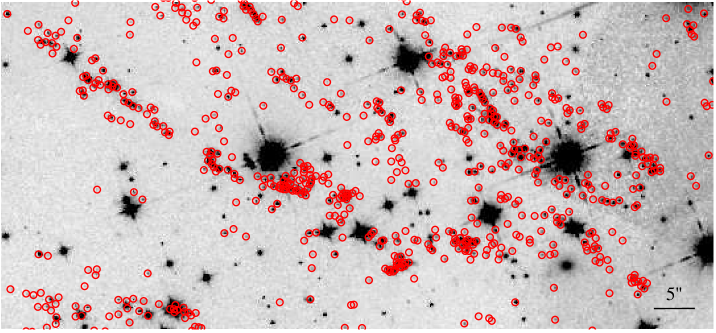
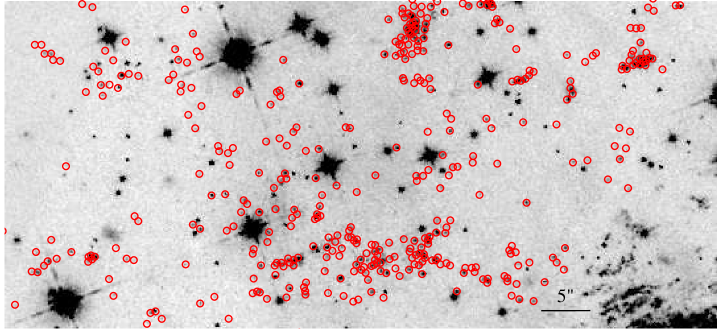
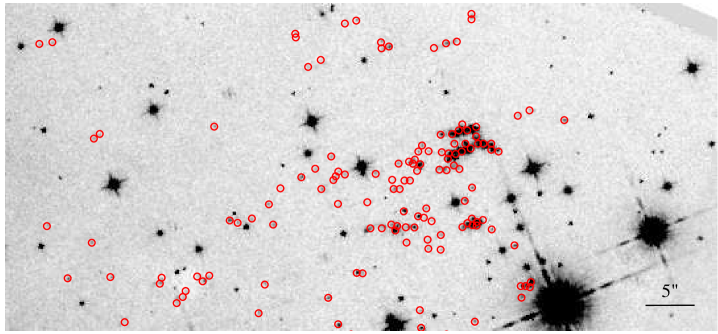
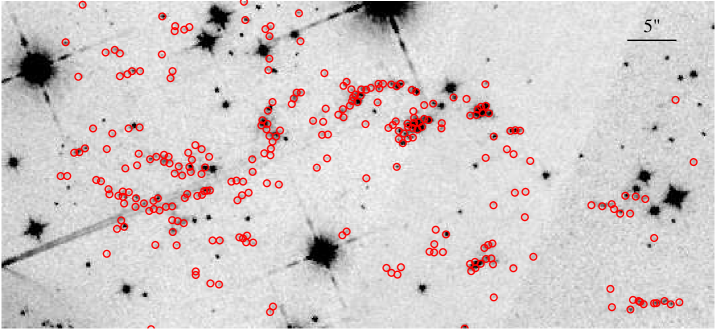
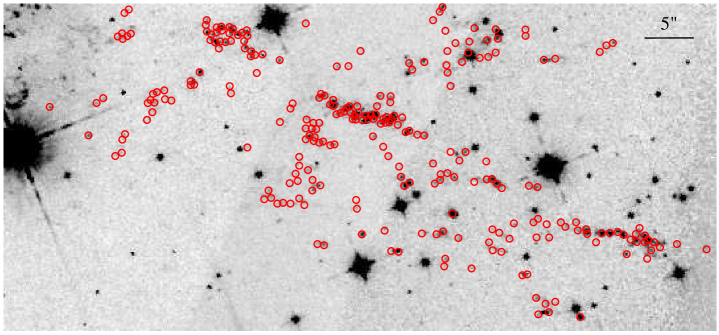
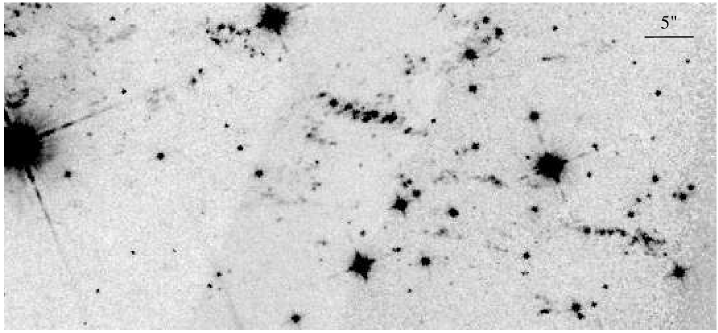
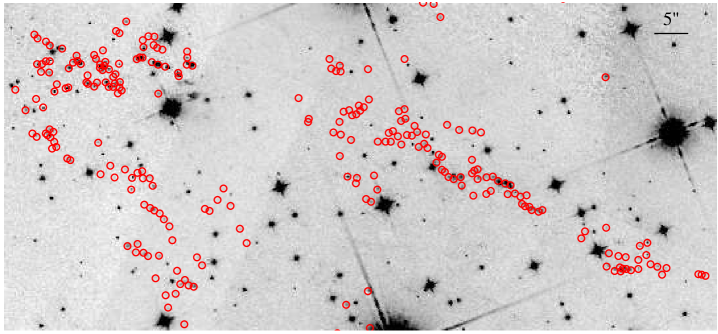
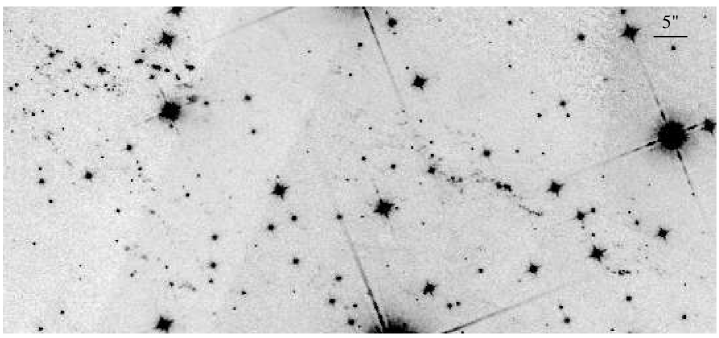
6. Appendix A: Outer Ejecta Knot Finding Charts
The most complete previous survey of high-velocity ejecta outside of Cas A’s main shell of expanding debris is that of Hammell & Fesen (2008). They published a catalog of over 1800 ejecta knots along with finding charts and 2004 coordinates, proper motions, photometric filter fluxes, and estimated knot emission types based on filter flux ratios. While our survey is based on a single filter image, specifically the near infrared WFC3/IR F098M filter, these images revealed significantly more ejecta knots in the outlying regions of Cas A in the NE and SE jet regions.
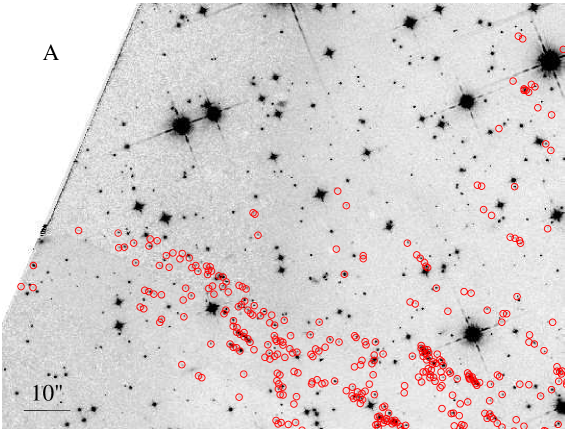
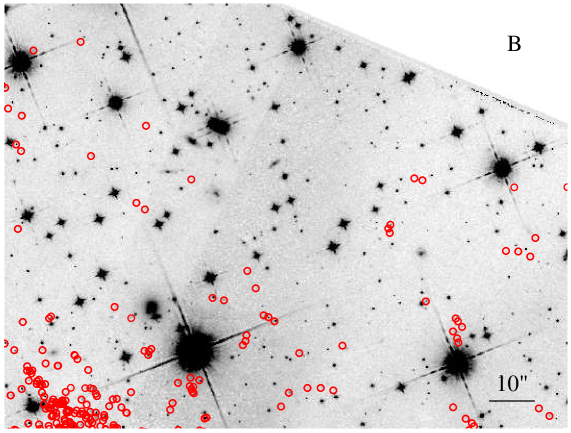
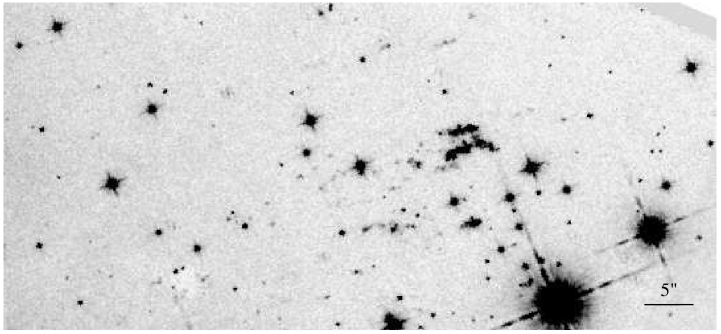
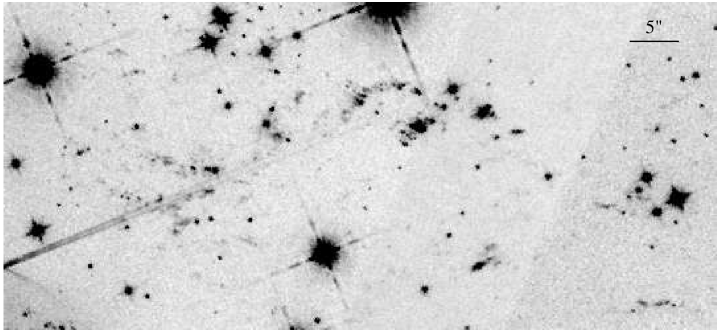
In this appendix, we present finding charts of the S-rich ejecta knots visible in one of the WFC3/IR F098M images in the outskirts of Cas A. For regions where the ejecta knots are the densest, we include enlargements, with and without identifying circles, to facilitate individual knot and ejecta stream identification.
Due to the high proper motions of the outer ejecta ( yr-1) and the fact that many of these knots exhibit significant brightness changes over time spans as short as a few months (Fesen et al., 2011), we have not included positional information for these outlying knots. Instead, we view the finding charts presented here as a more appropriate means of documenting the remnant’s current outer ejecta debris population and distribution.
Figure 6 shows the ten sections of the northeast and southwest outer regions of Cas A where enlargement images are presented in Figures 7 through 11. The coordinates for the centers of these ten finding charts are listed in Table 1. Greater image enlargements of particularly dense knot regions are shown in Figures 12 through 18.
| Region | RA (J2000) | Dec (J2000) | Region | RA (J2000) | Dec (J2000) |
|---|---|---|---|---|---|
| h m s | ° ′ ″ | h m s | ° ′ ″ | ||
| A | 23:23:58.10 | +58:51:17 | F | 23:23:04.28 | +58:49:34 |
| B | 23:23:43.35 | +58:51:17 | G | 23:23:07.72 | +58:48:11 |
| C | 23:23:58.05 | +58:49:53 | H | 23:23:59.70 | +58:48:11 |
| D | 23:23:43.35 | +58:49:53 | I | 23:23:17.09 | +58:46:48 |
| E | 23:23:47.75 | +58:48:27 | J | 23:23:03.47 | +58:46:48 |