On the Metallicity and Origin of the Smith High-Velocity Cloud111Based on observations taken under program 13840 of the NASA/ESA Hubble Space Telescope, obtained at the Space Telescope Science Institute, which is operated by the Association of Universities for Research in Astronomy, Inc., under NASA contract NAS 5-26555, and under program GBT09A_17 of the Robert C. Byrd Green Bank Telescope (GBT) of the National Radio Astronomy Observatory, a facility of the National Science Foundation operated under a cooperative agreement by Associated Universities, Inc.
Abstract
The Smith Cloud is a gaseous high-velocity cloud (HVC) in an advanced state of accretion, only 2.9 kpc below the Galactic plane and due to impact the disk in 27 Myr. It is unique among HVCs in having a known distance (12.41.3 kpc) and a well-constrained 3D velocity (296 km s-1), but its origin has long remained a mystery. Here we present the first absorption-line measurements of its metallicity, using HST/COS UV spectra of three AGN lying behind the Cloud together with Green Bank Telescope 21 cm spectra of the same directions. Using Voigt-profile fitting of the S II 1250, 1253, 1259 triplet together with ionization corrections derived from photoionization modeling, we derive the sulfur abundance in each direction; a weighted average of the three measurements gives [S/H]=0.280.14, or 0.53 solar metallicity. The finding that the Smith Cloud is metal-enriched lends support to scenarios where it represents recycled Galactic material, rather than the remnant of a dwarf galaxy or accreting intergalactic gas. The metallicity and trajectory of the Cloud are both indicative of an origin in the outer disk. However, its large mass and prograde kinematics remain to be fully explained. If the cloud has accreted cooling gas from the corona during its fountain trajectory, as predicted in recent theoretical work, its current mass would be higher than its launch mass, alleviating the mass concern.
Subject headings:
Galaxy: halo – Galaxy: evolution – ISM: kinematics and dynamics1. Introduction
The gaseous halo of the Milky Way is home to a diverse population of high-velocity clouds (HVCs) that do not co-rotate with the underlying disk. HVCs trace a variety of processes including inflow, outflow, tidal stripping, and condensation of coronal material (Wakker & van Woerden 1997). Once the neutral and ionized phases of HVCs are accounted for, they represent a global inflow rate onto the Galaxy of 0.4–1.4 M⊙ yr-1 (Shull et al. 2009, Lehner & Howk 2011, Putman et al. 2012), similar to the Galactic star formation rate. HVCs therefore represent the Galactic fuel supply, and understanding their physical and chemical properties allows us to explore the mechanism(s) by which star formation is sustained.
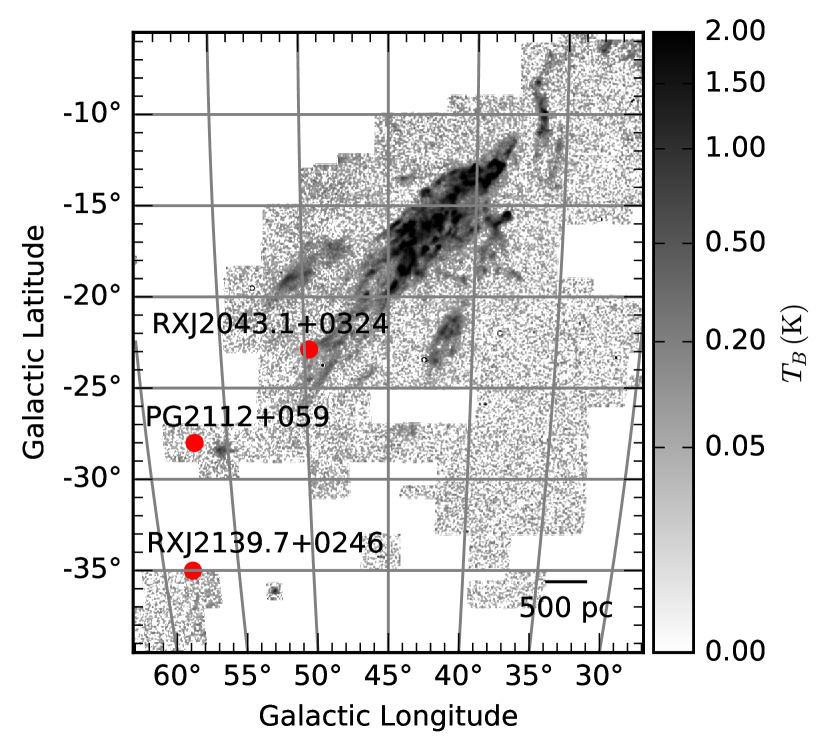
The Smith Cloud (SC; see Figure 1; Smith 1963), also known as the Galactic-Center-Positive (GCP) complex, is a large HVC222Parts of the SC are at intermediate velocities km s-1, but it has traditionally been defined as an HVC since its head is at km s-1. plunging toward the Galactic plane with a velocity =73 km s-1, an H I mass of 106 (Lockman et al. 2008), and a similar H II mass (Hill et al. 2009). Its cometary morphology suggests that its direction of motion lies along its major axis, and so its LSR velocity can be used to derive a 3-D velocity of 296 km s-1 (Lockman et al. 2008), lower than the Galactic escape velocity. The SC has a heliocentric distance of =12.41.3 kpc, based on three independent methods: the detection of absorption lines in background stellar spectra (Wakker et al. 2008), its kinematics (Lockman et al. 2008), and its H emission (Putman et al. 2003). It also has a magnetic field of 8G detected via Faraday rotation (Hill et al. 2013) but no significant stellar population (Stark et al., 2015). Together these properties make the SC arguably the best characterized of all HVCs (see Lockman, 2015).
Despite the good characterization of the SC’s properties, its origin remains unknown. It is unclear whether it represents Galactic material, expelled from the disk as part of a Galactic fountain (Bregman 1980), accreting extragalactic material, the gaseous remnant of a dwarf galaxy, such as the Sagittarius dwarf (Bland-Hawthorn et al. 1998) or other satellite (Stark et al. 2015), or something else. The key missing piece of evidence is the SC metallicity. Metallicity discriminates between recycled Galactic gas (enriched) and infalling extragalactic gas (unenriched), but since the SC lies close to the disk and so has relatively high foreground extinction, there have been (until now) no AGN lying behind the SC observed in the UV. Thus there is no published absorption-line constraint on the SC metallicity, though Hill et al. (2009) measured the H and [N II] emission from the SC using optical nebular lines and derived a nitrogen abundance of 0.15–0.44 times solar.
In this Letter we present absorption-line metallicity measurements from three SC sightlines, toward the AGN PG2112+059 (catalog ), RXJ2043.1+0324 (catalog ), and RXJ2139.7+0246 (catalog ). We describe the UV and radio observations in §2, present the spectra and abundance calculations in §3, and discuss the implications in §4. All velocities are presented in the LSR reference frame.
2. Observations and Data Reduction
The targets for this program were selected by searching for UV-bright AGN behind or nearby the SC. This search yielded three targets (see Table 1). All three probe the wake region of the SC, behind its direction of motion (Figure 1), where there is extensive diffuse H I both morphologically and kinematically associated with the cloud (Lockman et al., 2008). The three AGN were observed in October 2014 with the Cosmic Origins Spectrograph (COS; Green et al., 2012) onboard HST, under Program ID 13840 (PI Fox), with three orbits per target. The spectra were taken with the G130M/1291 grating/central-wavelength combination, the primary science aperture, and all four FP-POS positions. The x1d files produced by the calcos reduction pipeline were aligned using customized reduction software, designed to ensure that commonly observed ISM lines are aligned in wavelength space (see Wakker et al. 2015 for more details). The data were binned by three pixels and continuum normalized for display.
| Target | aaGalactic longitude and latitude. | aaGalactic longitude and latitude. | bbEmission-line redshift of AGN. | FUVccGALEX FUV magnitude. | ddSpectroscopic flux at 1300 Å in units of 10-14 erg cm-2 s-1 Å-1. | log (H I)eeH I column density in SC measured from GBT, integrated in range to , except for PG2112+059 value, determined by profile fitting. | ffMinimum and maximum LSR velocities of SC emission and absorption. | ffMinimum and maximum LSR velocities of SC emission and absorption. | ggCentral LSR velocity of SC 21 cm emission. |
|---|---|---|---|---|---|---|---|---|---|
| (°) | (°) | (flux units) | (cm-2) | (km s-1) | (km s-1) | (km s-1) | |||
| PG2112+059 | 57.04 | 28.01 | 0.457 | 17.05 | 0.75 | 18.720.06 | 40 | 75 | 42 |
| RXJ2043.1+0324 | 49.72 | 22.88 | 0.271 | 17.29 | 0.55 | 18.840.05 | 40 | 110 | 79 |
| RXJ2139.7+0246 | 58.09 | 35.01 | 0.260 | 16.79 | 0.79 | 19.410.02 | 40 | 100 | 55 |
H I 21 cm spectra were taken with the 100-meter Robert C. Byrd Green Bank Telescope (GBT) at an angular resolution of , under project code GBT09A_17. Spectra were taken using in-band frequency switching, and covered 700 km s-1 centered at zero velocity LSR at a velocity resolution of 1.3 km s-1. The data were calibrated and corrected for stray radiation following the procedure described in Boothroyd et al (2011), and a low-order polynomial was fit to emission-free regions of the spectra to remove residual instrumental baseline structure. The H I column density in each direction is calculated by integrating the 21 cm brightness-temperature profiles (shown in Figure 2) between and by the standard relation
| (1) |
For the PG2112+059 (catalog ) direction, the SC component is blended on the blue (low-velocity) side by Galactic emission, so in this case we determined the H I column density by fitting a Gaussian component, with a velocity centroid matching that seen in S II absorption.
3. Results
Among the many low-ionization lines in the COS G130M bandpass, S II 1250, 1253, 1259, and O I 1302 lines are the most useful for metallicity measurements, because sulfur and oxygen are relatively undepleted onto dust and have relatively small ionization corrections. Unfortunately, the O I 1302 lines from the SC are of very limited use for metallicity measurements, because of strong saturation. This leaves the S II triplet as our best metallicity indicator. HST/COS absorption-line profiles showing S II for the three sightlines under study are plotted in Figure 2, together with Voigt-profile fits to the data. These were conducted via simultaneous fits to unblended regions of the spectra, taking account of the COS line spread function, and leaving all the initial inputs (velocity centroid, line width, and column density) free to vary (following Lehner et al., 2011). Clear S II absorption from the SC is seen in each direction.
| Target | log (H I) | log (S II)aaColumn density derived from Voigt-profile fitting (see Figure 2). | [S II/H I]bbS II ion abundance, defined in Equation 2. | log ccSi III/Si II column-density ratio, measured in the velocity interval to . | log ddLogarithm of best-fit ionization parameter, derived to match Si III/Si II ratio. | IC(S)eeIonization correction derived from Cloudy photoionization models (Figure 3). | [S/H]ffS abundance corrected for ionization, [S/H]=[S II/H I]+IC(S). The first error is statistical. The second is systematic and accounts for the beamsize mismatch between UV and radio observations, and uncertainties in the ICs. |
|---|---|---|---|---|---|---|---|
| PG2112+059 | 18.720.06 | 14.400.33 | +0.560.33 | …ggContamination prevents Si II/Si III ratio being measured; we adopt the same log value as derived for the RXJ2139.7+0246 sightline. | 0.650.10 | 0.090.330.15 | |
| RXJ2043.1+0324hhThis sightline shows a 20 km s-1 offset between the S II and GBT H I centroids (see Figure 2). | 18.840.05 | 14.380.13 | +0.420.13 | 3.20.1 | 0.560.10 | 0.140.130.15 | |
| RXJ2139.7+0246 | 19.410.02 | 14.170.20 | 0.360.20 | 3.00.1 | 0.220.10 | 0.580.200.15 |
Note. — We use the solar sulfur abundance (S/H)⊙=4.88 from Asplund et al. (2009).
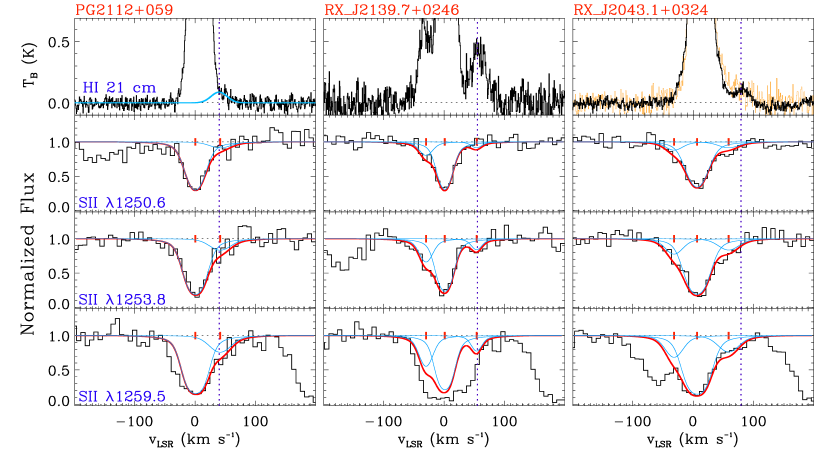
An important issue in abundance determinations is velocity alignment. The S II and H I lines should line up in velocity space if they originate in the same cloud. For PG2112+059 (catalog ), weak 21 cm emission from the SC is visible in the range 30–80 km s-1 (see Figure 2), matching the range where absorption is seen in S II; the fitted SC S II component has a centroid of 41.514.5 km s-1, with no evidence for misalignment from H I. For RXJ2139.7+0246 (catalog ), the 21 cm component centroid (55 km s-1) and S II component centroid (53.75.3 km s-1) are closely aligned. However, for RXJ2043.1+0324 (catalog ), there is an 20 km s-1 offset between the S II component at 58.56.1 km s-1 and the GBT H I component centered at 79 km s-1. To explore this, we downloaded the Leiden-Argentine-Bonn (LAB) 21 cm data of this sightline (Kalberla et al., 2005), and found the SC emission in the LAB data was centered at 62 km s-1, within the 1 error of the S II centroid. The GBT data (9.1′ beam) have higher angular resolution than the LAB data (36′ beam), and have better sampling, but the fact that the GBT and LAB centroids disagree shows that small-scale structure (clumping) exists in the neutral gas in this direction. Indeed, we know there is a large gradient in (H I) in this sightline since it passes just outside the main body of the SC (Figure 1). This structure limits the accuracy of abundances derived by comparing pencil-beam metal columns with finite-beam H I columns; we add a systematic error of 0.10 dex to the abundance calculations to account for this beamsize mismatch (Wakker et al., 2001).
The sulfur abundance in the Smith Cloud is calculated from the observed S II ion abundance using an ionization correction (IC). The ion abundance is determined observationally as:
| (2) |
and the IC is defined such that
| (3) |
The magnitude of the IC in a given direction depends on the H I column density, the ionization parameter (the ratio of the ionizing photon density to the gas density), and the shape and normalization of the incident ionizing radiation field. We ran a grid of Cloudy photoionization models (Ferland et al., 2013) to investigate the magnitude of the ICs in the SC given a 3D model of the Galactic ionizing radiation field (Bland-Hawthorn & Maloney, 1999; Fox et al., 2005, 2014), as a function of (H I) and (see Figure 3). These models use the radiation field interpolated at the location where each sightline intercepts the SC (given that we know , , and ). This field has log =4.70, corresponding to an ionizing flux =105.78 photons cm-2 s-1. We constrain the value of by matching the Si III/Si II column-density ratio in the SC, log [(Si III 1206)/(Si II 1304)] in the RXJ2043.1+0324 (catalog ) direction and in the RXJ2139.7+0246 (catalog ) direction, as measured from apparent optical depth (AOD) integrations (Savage & Sembach, 1991) in the SC velocity interval. This process gives log =3.20.1 and 3.00.1, respectively, for these two sightlines (in line with values derived for other HVCs; Collins et al., 2005; Tripp & Song, 2012; Fox et al., 2014). The IC for sulfur is then calculated directly for each sightline (via Equation 3) using the model run at the appropriate (H I) and . Any hidden saturation in Si III 1206 (or Si II 1304) would raise (or lower) the Si III/Si II ratio and push the solution for to slightly higher (or lower) values. However, because the IC is insensitive to , particularly at log , (see Figure 3, lower panel), this would not significantly change the IC.

The sulfur abundance measurements calculated using Equations 2 and 3 are summarized in Table 2. Among our three SC sightlines, the RXJ2139.7+0246 (catalog ) direction has a high enough H I column density in the SC, log (H I)=19.41, that the ionization correction is relatively small (0.22 dex), giving [S/H]=0.560.20(stat)0.15(syst), where the statistical uncertainty reflects the measurement error on the S II column density, and the systematic uncertainty derives from the UV-radio beamsize mismatch and the uncertainties in the ionization correction. Toward PG2112+059 (catalog ) and RXJ2043.1+0324 (catalog ), the ICs are larger (0.65 and 0.56 dex, respectively) because of lower H I columns, giving [S/H]=0.090.33(stat)0.15(syst) and [S/H]=0.140.13(stat)0.15(syst) in these two directions. If there is no variation in the true metallicity across the cloud, a weighted mean of the three measurements can be used, giving [S/H]=0.280.14 (equivalent to 0.53 solar). However, the variation in abundance across the SC may be real. Indeed, the direction with the lowest derived abundance (toward RXJ2139.7+0246 (catalog ), where [S/H] is 0.5 dex lower than in the other two sightlines) is the sightline furthest into the SC wake, where more metal mixing with the surrounding gas is expected to occur (Gritton et al., 2014). Thus we see tentative evidence for an abundance gradient.
For comparison, the N abundance in the 104 K ionized gas in the leading edge of the SC is 0.15–0.44 solar, as derived from optical [N II] emission lines and assuming the ionized gas is photoionized (although shocks may play a role there; Hill et al 2009, 2013). In a downstream portion of the cloud, more analogous to the sightlines probed in this work, the derived N abundance is 0.3–0.8 solar (Putman et al 2003, Hill et al 2013). These results suggest that the SC has a solar or sub-solar N/ ratio.
4. Discussion and Summary
The SC directly addresses a question of broad general interest: how does gas get into galaxies? Since the SC is a coherent H I cloud that has survived to its current location without breaking apart, it clearly exemplifies one pathway to bring fuel into galaxies. The question is what is the origin of that pathway?
Our measurement of a high metallicity (0.53 solar) argues in favor of a Galactic origin for the SC, such as gas on the returning leg of a fountain (Bregman 1980) launched into the halo at a different location in the disk (Sofue et al. 2004). Given the Galactic radial chemical abundance gradient of 0.06 dex kpc-1 (Henry & Worthey, 1999), half-solar metallicity is reached at a Galactocentric radius of 13 kpc, which is exactly where the last SC disk passage occurred in the Lockman et al. (2008) trajectory. Therefore the metallicity and orbit of the Smith Cloud are both consistent with an origin in the outer disk.
If the SC was accreting for the first time from the IGM, or is the remnant ISM of a dwarf galaxy (Bland-Hawthorn et al. 1998), it would have a lower metallicity. The LMC has 0.50 solar metallicity, but is orders of magnitude more massive than the SC, and all other Local Group dwarfs have lower metallicity. Stark et al. (2013) noted how the newly discovered star-forming galaxy Leo P has similar properties to the SC, and would also not show stars if at the SC’s location. However, Leo P has a metallicity of 3% solar (Skillman et al., 2013). Our SC metallicity conclusively rules out such a galaxy as the cloud’s origin.
Our abundance calculations have not taken into account the depletion of sulfur onto dust grains (Jenkins, 2009). However, any such depletion would raise the total (gas+dust) inferred sulfur abundance, strengthening the conclusion that the SC is Galactic. Furthermore, if any metal mixing has occurred in the Cloud’s past, so that it represents a diluted mixture of Galactic and extragalactic material, the fact that the resulting metallicity is as high as half solar again strengthens the idea that Galactic (enriched) gas contributed to its origin (see Bland-Hawthorn et al. 2015 and Webster et al. 2015 for recent arguments concerning metal mixing).
It has long been a mystery how the SC survived to reach its current location, because infalling HVCs are predicted and observed to be disrupted by their interaction with the surrounding gaseous medium. The lifetime against disruption depends on the clouds mass (Heitsch & Putman, 2009) and density contrast with the external medium (Joung et al., 2012). One possibility, explored by Nichols & Bland-Hawthorn (2009) and Galyardt & Shelton (2015), is that the SC might be a dark galaxy, bearing dark matter and gas but no stars. The dark matter would provide the confinement that allowed the cloud to survive the 70 Myr since its last disk passage. Our detection of metals argues against this idea, since the metals require star formation to have occurred.
Another possibility to consider is whether the SC is a dark matter halo that accreted sufficient disk material on a previous passage to explain its high metallicity. Using the disk column of Nichols et al. (2014) and the cloud’s trajectory, the SC would travel through an ISM mass of during a single pass through the disk, which is 10% of the SC mass for a projected radius =100 pc. However, this assumes that the cloud incorporates all of the gas mass it travels through, which is unrealistic. Simulations show that the accretion efficiencies are 0.1–1%, depending on the time and velocity (F. Heitsch et al. 2016, in prep.), making it challenging for this scenario to explain our metallicity observations.
Although our sulfur abundance is supportive of a Galactic origin for the SC, there remain two main hurdles for this hypothesis: the cloud’s mass and kinematics. The mass problem is that the SC’s high mass (2106) is much larger than that of known extraplanar Galactic H I clouds, such as superbubble “caps”, and makes it unlikely that any star-formation process in the disk is energetic enough to explain the SC (Hill et al., 2009). For example, the cap to the Ophiuchus superbubble contains only 3104 of H I (Pidopryhora et al., 2007). However, recent theoretical work on Galactic fountains has shown they can sweep up and cool coronal gas (Marinacci et al., 2010; Marasco et al., 2013). In such models the mass of fountain HVCs grows with time as they accrete cooled coronal material. In the hydrodynamical simulations of Fraternali et al. (2015), an HVC can increase its mass by a factor of three in 200 Myr. The mass problem would be alleviated by such a mechanism, because then the current SC mass would be higher than its launch mass and so the required launch energy would be lower than previously thought.
The second problem is the SC’s kinematics. There is direct evidence in the GBT H I data that the Cloud has a line-of-sight velocity at least 70 km s-1 greater than the Galactic halo material it is encountering (Lockman et al., 2008). The SC orbit is prograde and inclined at a shallow angle relative to the Milky Way disk (30°). This indicates that the cloud is moving faster than Galactic rotation, and such super-rotation is not commonly observed: in other galaxies a lag in rotation of gaseous material thrown up above the plane is typically seen (Boomsma et al., 2005; Sancisi et al., 2008). A super-rotating extraplanar cloud would be unique.
In conclusion, our sulfur abundance of 0.53 solar for the SC provides an important new clue on its origin and supports a Galactic (as opposed to extragalactic) explanation, effectively ruling out dwarf-galaxy and dark-galaxy origins. However, the cloud’s mass and kinematics require it to be a highly unusual Galactic cloud. This enigmatic object is still to be fully explained.
Acknowledgments. The authors are grateful to Robin Shelton, Ken Croswell, and the referee for valuable comments. Support for program 13840 was provided by NASA through grants from the Space Telescope Science Institute, which is operated by the Association of Universities for Research in Astronomy, Inc., under NASA contract NAS 5-26555.
References
- Asplund et al. (2009) Asplund, M., Greenness, N., Jacques Sauval, A., & Scott, P. 2009, ARA&A, 47, 481
- Bland-Hawthorn et al. (1998) Bland-Hawthorn, J., Veilleux, S., Cecil, G. N., et al. 1998, MNRAS, 299, 611
- Bland-Hawthorn & Maloney (1999) Bland-Hawthorn, J., & Maloney, P. R. 1999, ApJ, 510, L33
- Bland-Hawthorn et al. (2015) Bland-Hawthorn, J., Sutherland, R., & Webster, D. 2015, ApJ, 807, 154
- Boomsma et al. (2005) Boomsma, R., Oosterloo, T. A., Fraternali, F., van der Hulst, J. M., & Sancisi, R., 2005, A&A, 431, 65
- Boothroyd et al. (2011) Boothroyd, A. I., Blagrave, K., Lockman, F. J., et al. 2011, A&A, 536, A81
- Bregman (1980) Bregman, J. 1980, ApJ, 236, 577
- Chiappini et al. (2001) Chiappini, C., Matteucci. F., & Romano, D. 2001, ApJ, 554, 1044
- Collins et al. (2005) Collins, J. A., Shull, J. M., & Giroux, M. L. 2005, ApJ, 623, 196
- Ferland et al. (2013) Ferland, G. J., Porter, R. L., van Hoof, P. A. M., et al. 2013, RMxAA, 49, 137
- Fox et al. (2005) Fox, A. J., Wakker, B. P., Savage, B. D., et al. 2005, ApJ, 630, 332
- Fox et al. (2014) Fox, A. J., Wakker, B. P., Barger, K. A., et al. 2014, ApJ, 787, 147
- Fraternali et al. (2015) Fraternali, F., Marasco, A., Armilotta, L., & Marinacci, F. 2015, MNRAS, 447, L70
- Galyardt & Shelton (2015) Galyardt, J., & Shelton R. L. 2015, preprint (arXiv:1511.05884)
- Green et al. (2012) Green, J. C., Froning, C. S., Osterman, S., et al. 2012, ApJ, 744, 60
- Gritton et al. (2014) Gritton, J. A., Shelton, R. L., & Kyujin, K. 2014, ApJ, 795, 99
- Heitsch & Putman (2009) Heitsch, F. & Putman, M. E. 2009, ApJ, 698, 1485
- Henry & Worthey (1999) Henry, R. B. C., & Worthey, G. 1999, PASP, 111, 919
- Hill et al. (2009) Hill, A. S., Haffner, L. M., Reynolds, R. J. 2009, ApJ, 703, 1832
- Hill et al. (2013) Hill, A. S., Mao, S. A., Benjamin, R. A., Lockman F. J., & McClure-Griffiths, N. M. 2013, ApJ, 777, 55
- Jenkins (2009) Jenkins, E. B. 2009, ApJ, 700, 1299
- Joung et al. (2012) Joung, M. R., Bryan, G. L., & Putman M. E.
- Lehner & Howk (2011) Lehner, N., & Howk, J. C. 2011, Science, 334, 955
- Lehner et al. (2011) Lehner, N., Zech, W. F., Howk, J. C., & Savage, B. D. 2011, ApJ, 727, 46
- Lockman (2015) Lockman, F. J. 2015, Proc. IAU Symposium 315 (arXiv:1511.05423)
- Lockman et al. (2008) Lockman, F. J., Benjamin R. A., Heroux, A. J., Langston, G. I. 2008, ApJ, 679, L21
- Kalberla et al. (2005) Kalberla, P. M. W., Burton, W. B., Hartmann, D., et al. 2005, A&A, 440, 775
- Marasco et al. (2013) Marasco, A., Marinacci, F., & Fraternali, F. 2013, MNRAS, 433, 1634
- Marinacci et al. (2010) Marinacci, F., Binney, J., Fraternali, F., et al. 2010, MNRAS, 404, 1464
- Nichols & Bland-Hawthorn (2009) Nichols, M. & Bland-Hawthorn, J. 2009, ApJ, 707, 1642
- Nichols et al. (2014) Nichols, M., Mirabel, N., Agertz, O., Lockman, F. J., & Bland-Hawthorn, J. 2014, MNRAS, 442, 2883
- Pidopryhora et al. (2007) Pidopryhora, Y., Lockman, F. J., & Shields, J. C. 2007, ApJ, 656, 928
- Putman et al. (2003) Putman, M. E., Bland-Hawthorn, J., Veilleux, S., et al. 2003, ApJ, 597, 948
- Putman et al. (2012) Putman, M. E., Peek, J. E. G., & Joung M. R. 2012, ARA&A, 50, 491
- Sancisi et al. (2008) Sancisi, R., Fraternali, F., Oosterloo, T., van der Hulst, T. 2008, A&ARv, 15, 189
- Savage & Sembach (1991) Savage, B. D., & Sembach, K. R. 1991, ApJ, 379, 245
- Shull et al. (2009) Shull, J. M., Jones, J. R., Danforth, C. W., & Collins, J. A. 2009, ApJ, 699, 754
- Skillman et al. (2013) Skillman, E. D., Salzer, J. J., Berg, D. A., et al. 2013, AJ, 146, 3
- Smith (1963) Smith, G. P. 1963, BAN, 17, 203
- Sofue et al. (2004) Sofue, Y., Kudoh, T., Kawamura, A., Kazunari, S., Fujimoto, M. 2004, PASJ, 56, 633
- Stark et al. (2015) Stark, D. V., Baker, A. D., Kannappan, S. J. 2015, MNRAS, 446, 1855
- Tripp & Song (2012) Tripp, T. M., & Song, L. 2012, ApJ, 746, 173
- Wakker & van Woerden (1997) Wakker, B. P. & van Woerden, H. 1997, ARA&A, 35, 217
- Wakker et al. (2001) Wakker, B. P., Kalberla, P. M. W., van Woerden, H., de Boer, K. S., & Putman, M. E. 2001, ApJS, 136, 537
- Wakker et al. (2008) Wakker, B. P., York, D. G., Wilhelm, R., et al. 2008, ApJS, 146, 1
- Wakker et al. (2015) Wakker, B. P., Hernandez, A. K., French, D., et al. 2015, ApJ, 814, 40
- Webster et al. (2015) Webster, D., Frebel, A., Bland-Hawthorn, J. 2015, ApJ, submitted (arXiv:1509.00856)