The Impact Crater Size-Frequency Distribution on Pluto Follows a Truncated Pareto Distribution: Results from a First Data Set Based on the Recent New Horizons’ Flyby
Recently it could be shown (Scholkmann, Prog. in Phys., 2016, v. 12(1), 26-29) that the impact crater size-frequency distribution of Pluto (based on an analysis of first images obtained by the recent New Horizons’ flyby) follows a power law () in the interval of diameter () values ranging from km to the largest determined value of km. A reanalysis of this data set revealed that the whole crater SFD (i.e., with values in the interval of 1.2–37.7 km) can be described by a truncated Pareto distribution.
1 Introduction
The recent flyby from NASA’s New Horizons spacecraft has allowed the obtain high-resolution images of Pluto’s surface morphology and thus enabled a first determination of the impact crater size-frequency distribution (SFD) of a specific region, i.e., covering parts of Pluto’s regions Sputnik Planum, Al-Idrisi Montes and Voyager Terra [1].
The first analysis of the crater SFD used a power law of the type to model the data. In the present paper we show the results of an extended analysis. The inverse power law scaling is known as the Pareto distribution which scales as . The hypothesis we tested in the present paper was if a upper truncated Pareto distribution (i.e., a Pareto distribution in which the probability range is limited rather than infinite) can improve the modelling of the empirical crater SFD presented in [1].
2 From the Pareto to the truncated Pareto distribution
In the follwing we report the definitions of the probability density function (PDF), the distribution function (DF), the survival function (S) and the maximum likelihood estimator (MLE) for the two distributions here analyzed. The sample is made by crater diameter values denoted by .
2.1 The Pareto distribution
The Pareto PDF is given by
| (1) |
with ; the Pareto DF is defined as
| (2) |
and the survival function is given by
| (3) |
The parameter values can be estimated by applying the MLE:
| (4a) | ||||
| (4b) | ||||
More details can be found in [2].
2.2 The truncated Pareto distribution
An upper truncated Pareto random variable is defined in the interval , and the PDF is given by
| (5) |
and the truncated DF is defined as
| (6) |
The MLE determines the parameters according to
| (7a) | ||||
| (7b) | ||||
| (7c) | ||||
where the value of can be found using the Brent’s method to find a root of a nonlinear function, i.e. by applying the FORTRAN subroutine ZBRENT [3]. More details can be found in [4].
3 Data analysis and results
For statistical testing the Kolmogorov–Smirnov (K-S) test [5, 6, 7] was employed which does not require data binning. The K-S test, as implemented by the FORTRAN subroutine KSONE [3], finds the maximum distance between the theoretical and the empirical DF as well the significance level (see equations 14.3.5 and 14.3.9 in [3]). A values of assures that the fit is acceptable.
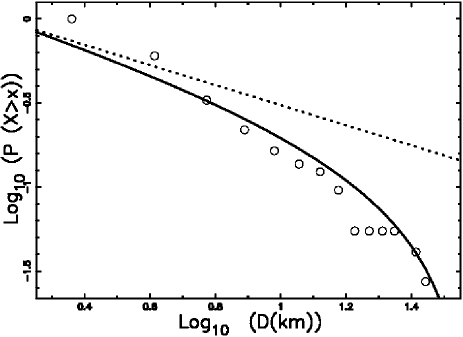
When using the impact crater SFD data of Pluto with km, 37.77 km] the Pareto PDF gave and thus (similar to the value reported by [1]), and the K-S test gave and . Figure 1 shows the empirical and and the two fitted distributions when the interval of crater size values is enlarged so that all values are included in the fitting, i.e., km, 37.77 km]. It can be clearly recognized that the truncated Pareto distribution describes the empirical crater SFD quite well over the whole interval of values available.
4 Conclusions
The distribution of crater diameters of planets is commonly modeled by a power law. A small modification of the ”simple” PDF by a truncated Pareto PDF (as given by equation (5)) allows to avoid the dichotomy of the infinite rather than finite range of existence and it provides a better K-S test statistics with respect to the Pareto PDF (i.e., a ”simple” power law), see captions of Figure 1.
In conclusion, we could show that the empirical impact crater SFD of Pluto (using a first data set based on recent New Horizons’ flyby) is in good agreement with a truncated Pareto distribution. Applying the same modelling approach to an extended data set of Pluto’s crater values is warranted to confirm our results – a task to be done as soon as new images of the New Horizon spacecraft are available.
References
- [1] Scholkmann, F., Power-law scaling of the impact crater size-frequency distribution on pluto: A preliminary analysis based on first images from new horizons flyby, PROGRESS IN PHYSICS 12 2016.
- [2] Evans, M., Hastings, N., & Peacock, B., Statistical Distributions - third edition, John Wiley & Sons Inc, New York, 2000.
- [3] Press, W. H., Teukolsky, S. A., Vetterling, W. T., & Flannery, B. P., Numerical Recipes in FORTRAN. The Art of Scientific Computing, Cambridge University Press, Cambridge, UK, 1992.
- [4] Zaninetti, L. & Ferraro, M., On the truncated Pareto distribution with applications, Central European Journal of Physics 6 (2008) 1.
- [5] Kolmogoroff, A., Confidence limits for an unknown distribution function, The Annals of Mathematical Statistics 12 (4) (1941) 461.
- [6] Smirnov, N., Table for estimating the goodness of fit of empirical distributions, The Annals of Mathematical Statistics 19 (2) (1948) 279.
- [7] Massey, Frank J., J., The kolmogorov-smirnov test for goodness of fit, Journal of the American Statistical Association 46 (253) (1951) 68.