Photoionization Modeling of the Low Luminosity Seyfert 1 Nucleus in NGC 3516
Abstract
Spectroscopic observations of the low luminosity Seyfert 1 nucleus in NGC 3516 obtained with the Hubble Space Telescope show that the visible spectrum is dominated by the Balmer emission lines of Hydrogen (H) and a continuum luminosity that rises into the UV. The anomalous H/H emission line ratio, the Balmer emission line luminosity and the distinctive shape observed for the H emission line profile serve as important constraints in any photoionization model aimed at explaining the visible emission line spectrum of NGC 3516. Photoionization modeling using Cloudy demonstrates that the central UV–X-ray source is able to completely ionize the H gas in between the Balmer and dust reverberation radii if the electron density is 3 107 cm-3 throughout. Thus, according to this model the region responsible for producing the visible H lines is a dust free shell of ionized H gas. Interestingly, the model predicts a rapid rise in the electron temperature as the central UV–X-ray source is approached, mirrored by an equally precipitous decrease in the Balmer line emissivity that coincides with the Balmer reverberation radius, providing a natural explanation for the finite width observed for the H Balmer lines. Collectively, the merit of the model is that it explains the relative intensities of the three brightest Balmer lines, and the shape of the H emission line profile. However, questions remain concerning the unusually weak forbidden lines that can not be addressed using Cloudy due to limitations with the code.
Subject headings:
galaxies: Seyfert, galaxies: individual (NGC 3516), quasars: emission lines1. Introduction
The visible spectrum of the nucleus of NGC 3516 was first described by Seyfert (1943) and includes bright, and unusually broad permitted Balmer emission lines of hydrogen (H), narrow [O iii]4959,5007, and absent [O ii]3727 forbidden emission lines. Collectively, these spectroscopic features have become a defining characteristic of Seyfert 1 active galactic nuclei (AGN) and much effort has been expended since in trying to understand their origin as reviewed recently by Ho (2008).
NGC 3516 is of potentially great importance in deciphering the mystery surrounding the origin of broad H emission lines because this low luminosity active galactic nucleus (LLAGN) is also time-variable allowing various independent measures of the broad line region (BLR) size. For example, correlated variability between the H emission line and the adjacent continuum lead to a Balmer reverberation lag 7 l.d. (Denney et al., 2010). However, complementary observations of correlated time variability between the visible and near infrared continua point to a 2.2 (-band) dust reverberation radius of 50 - 70 l.d (Koshida et al., 2014). Thus, the dust sublimation radius is about an order of magnitude larger than the Balmer reverberation radius. This size discrepancy is very significant and is evidently a common feature of reverberating AGN (Koshida et al., 2014) begging the question what lies in between? A plausible answer to this question is the model proposed by Netzer & Laor (1993), in which the central UV–X-ray source is able to sublimate dust from a sizeable volume of H gas, permitting it to be photoionized. According to this interpretation the Balmer reverberation radius marks just the inner radius of a much larger volume of photoionized gas, an insight articulated previously by Koshida et al. (2014, and references therein). In this context it is of interest to note that Seyfert alikened the visible spectrum of NGC 3516 to that of a planetary nebula which bears some geometrical resemblence to the BLR photoionization model of Netzer & Laor (1993).
| PID | Observation Date | Grating | Spectral Range | Slit | Dispersion | Plate Scale | Integration Time | Datasets |
|---|---|---|---|---|---|---|---|---|
| Å | arc sec | Å/pixel | arc sec/pixel | s | ||||
| (1) | (2) | (3) | (4) | (5) | (6) | (7) | (8) | (9) |
| 7355 | 4-13-1998 | G140L | 1150 – 1730 | 52 x 0.5 | 0.6 | 0.0246 | 32820 | o4st01010 |
| –o4st01070 | ||||||||
| 7355 | 4-13-1998 | G430L | 2900 – 5700 | 52 x 0.5 | 2.73 | 0.05 | 122891 | o4st02010 |
| – o4st13030aaOmitting o4st06030, o4st06040, o4st07030, o4st11020, o4st11030 | ||||||||
| 8055 | 6-18-2000 | G750M | 6295 – 6867 | 52 x 0.2 | 0.56 | 0.05 | 1956 | o56c01020 – |
| – o56c01030 | ||||||||
| 8055 | 6-18-2000 | G750M | 6295 – 6867 | 52 x 0.1 | 0.56 | 0.05 | 60 | o56c01040 |
| 8055 | 6-18-2000 | G430L | 2900 – 5700 | 52 x 0.2 | 2.73 | 0.05 | 600 | o56c01050 |
Of all telescopes, the Hubble Space Telescope (HST) provides the clearest view of the bright AGN in NGC 3516. Consequently, the main objective of this paper is to interpret the exquisite visible spectra obtained with HST in the context of the Netzer & Laor (1993) photoionization model. An important constraint in any such model is the shape and amplitude of the ionizing continuum. Recent observations with allowed Vasudevan & Fabian (2009) to constrain the ionizing continuum of the AGN in NGC 3516 as the combination of emission from an accretion disk and an X-ray power law. That ionizing continuum is adopted here as an input to the photoionization code Cloudy (Ferland et al., 2013) which can predict the relative intensity of the Balmer emission lines for various radial density distributions of photoionized gas. Additionally, since the central black hole (BH) mass is known (Denney et al., 2010) the shape of the broad Balmer emission lines can be used to constrain the Balmer emission line emissivity given a kinematic description for the gas. When combined with the X-ray luminosity, the BH mass implies that the AGN in NGC 3516 is radiating at 0.6% the Eddington luminosity limit (Vasudevan & Fabian, 2009) and is therefore unable to sustain a radiatively driven outflow. Thus, the BLR gas kinematics are most likely dominated by gravity. Time resolved spectra discussed by Denney et al. (2009) indicate that the BLR is actually an inflow of H gas. Paradoxically, the AGN in NGC 3516 may also be associated with an outflow (Barbosa et al., 2009, and references therein) driven by two jets, the orientation and geometry of which has been discussed previously by Ferruit, Wilson & Mulchaey (1998), such jets are comprised of a relativistic plasma producing extended radio continuum and collisionally excited forbidden line emission, but little or no Balmer emission. Consequently, the broad Balmer emission lines most likely originate in H gas that is photoionized by the central UV–X-ray source. The main objective of this paper is to test that conjecture.
The layout of the paper is as follows. A review of the UV and visible spectra of NGC 3516 obtained with the Space Telescope Imaging Spectrograph (STIS) is presented in Section 2. These observations are combined with a model for the ionizing continuum presented in Section 2.2. Emission line ratios, corrected for dust extinction, constrain a Cloudy photoionization model for the BLR in NGC 3516 as described in Section 3. A discussion follows in Section 4 and Conclusions are presented in Section 5.
2. Results
The HST/STIS observations, described in more detail in the following, provide fluxes and relative intensities for the H Balmer emission lines along with a measure of their line profile shapes. These observational results provide key constraints in a photoionization model for the BLR in NGC 3516 that is presented in Section 3.
2.1. Observations
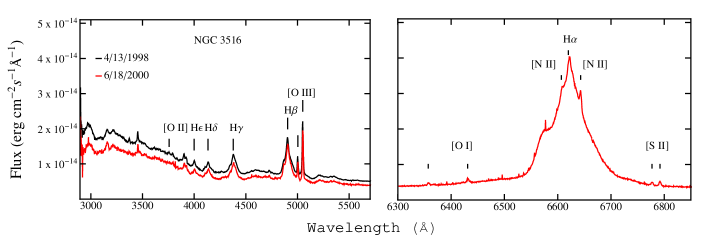
NGC 3516 has been visited twice with STIS. First in 1998 when it was observed intensively for a period of two days using the G430L and G140L gratings, then a second short visit just over two years later, in 2000, when it was observed again with the G430L grating and also the G750M grating. The STIS observations for both visits are summarized in Table 1, and the visible spectra are presented in Figure 1. Some details of those observations have been reported previously by Edelson et al. (2000) and Balmaverde & Capetti (2014). A thorough analysis of the UV emission line spectrum of NGC 3516 has been presented previously by Goad et al. (1999a, b).
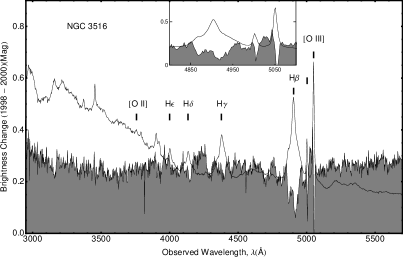
Multiple calibrated exposures obtained through each of the G750M and G430L gratings were shifted and combined for each grating but separately for each visit using the STSDAS task occreject. Subsequently, emission line fluxes were measured using the STSDAS contributed task specfit. Between the years 1998, and 2000 the visible continuum measured with the G430L grating decreased quite conspicuously by 20% as illustrated in Figure 2. The decrease in continuum brightness may be caused in part by the smaller slit size employed for the year 2000 observation. However, NGC 3516 is also known to be reverberating (Denney et al., 2010) and the 5% decrease in the H emission line flux between the two observations is consistent with prior observations. Intriguingly, the flux in the core of the H emission line changed less than the flux in the wings, as the inset to Figure 2 shows in more detail.
The Balmer series of H, and the [O iii]4959,5007 forbidden emission lines dominate the visible emission line spectrum. A small spike on the red side of the broad H emission line profile coincides with the vacuum wavelength 6585.28 Å expected for the brightest [N ii] forbidden emission line. A model for the brighter [N ii] line was constructed that, when removed, did not oversubtract the broad H emission line profile which is otherwise smoothly varying. Although it can not be seen, the fainter vacuum wavelength 6549.85 Å [N ii] emission line is constrained by atomic physics to have the same width and one third the flux of the brighter line. Line fluxes are reported in Table 2 for all the emission lines seen in the G750M spectrum including the broad H emission line, the [N ii] forbidden emission lines, the density sensitive [S ii] vacuum wavelength 6718.29 Å, and 6732.67 Å lines, plus the two [O i] vacuum wavelength 6302.04 Å, and 6365.53 Å lines.
The Balmer series of H continues into the G430L spectrum. Emission line fluxes are reported in Table 2 for H, H, H and H. The latter two lines are considerably fainter, and the adjacent continuum is not flat which introduces an additional model dependent systematic uncertainty, due to the continuum subtraction, that is difficult to quantify. Fluxes are also reported for the vacuum wavelength 4960.30 Å and 5008.24 Å [O iii] emission lines. An upper limit is reported in Table 2 for the vacuum wavelength 4364.44 Å [O iii] emission line which is overwhelmed by the broad H line. A flux is also reported for the unresolved vacuum wavelength 3727.09, 3729.88 Å [O ii] doublet.
| Line | CentralbbObserved wavelength | Fluxcc4-13-1998 observations measured within a 0.5″ x 0.35″ aperture. 6-18-2000 observation, measured within a 0.2″ x 0.35″ aperture. Continuum subtracted but not corrected for dust extinction. Model dependent systematic uncertainties introduce an additional 3% error not reported in the Table. | FWHM |
|---|---|---|---|
| Wavelength (Å) | (10-14 erg cm-2 s-1) | (kms-1) | |
| (1) | (2) | (3) | (4) |
| [O ii] | 3755 1 | 0.8 0.1 | 1255 240 |
| H (broad) | 4000 | 2.9 0.1 | … |
| H (broad) | 4134 | 12.5 0.1 | … |
| H (broad) | 4378 | 30 0.1 | 3323 180 |
| ddThe [O III] emission line parameters chosen so as to not over-subtract the broad H emission line profile | 4401 | 0.3 | 1000 |
| H (broad) | 4905 | 61 0.1 | 2540 170 |
| H (broad)ee6-18-2000 observation | 4905 | 58 0.1 | 2540 170 |
| 5004 1 | 7 0.1 | 910 224 | |
| 5051 1 | 20 0.1 | 1200 40 | |
| [O i] | 6357 1 | 0.3 0.1 | 203 29 |
| [O i] | 6431 1 | 0.4 0.1 | 200 |
| [N ii] | 6607 3 | 0.83 | 200 |
| H (broad) | 6620 | 307 0.1 | 2682 60 |
| [N ii] | 6643 0.3 | 2.5ffThe [N II] emission line flux is chosen so as to not over-subtract the broad H emission line profile. | 200 |
| [S ii] | 6777 3 | 0.5 0.2 | 250 100 |
| [S ii] | 6792 7 | 0.7 | 250 |
Collectively, the HST spectra bear an uncanny resemblence to the one described by Seyfert (1943). Using photographic plates he measured the relative intensities of the Balmer lines and the [O iii]4959,5007 forbidden emission lines, to be within 25% of the values measured with STIS. However, an inconsistency has been found with Edelson et al. (2000) who report H and H emission line fluxes that are one order of magnitude larger than cited in Table 2. Including the forbidden [N ii] emission lines, the broad H flux reported by Balmaverde & Capetti (2014) agrees with the value cited in Table 2 within the 3% uncertainty expected for plausible, but different models of the underlying continuum.
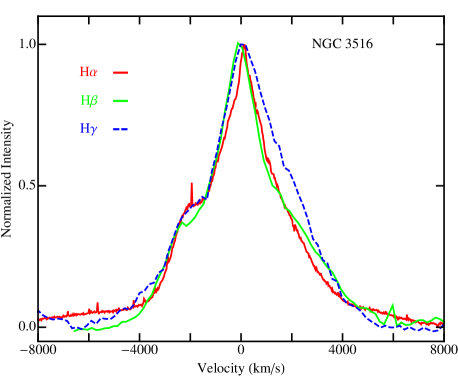
The broad H emission line has a single peak, but is obviously asymmetric due to a “bump” on the blue side of the profile illustrated in Figure 3. This feature was seen, and commented on previously by Boksenberg & Netzer (1977), Wanders et al. (1993) and Popović et al. (2002). Evidently, the feature is real, and has persisted for at least 25 years. Adopting a heliocentric recession velocity of 2508 60 km/s for NGC 3516, measured using the peak of the brightest [O iii] emission line (Figure 1), allows wavelength to be converted into rest frame velocity for each of the H, H, and H emission line profiles. Figure 3 illustrates that the emission line profile shapes are very similar to each other after they have been normalized to their respective peak intensity. The “bump” on the blue side is seen in H, H, and H. The fact that the Balmer emission line profiles are so similar suggests that the dust extinction in the visible part of the spectrum, internal to the BLR, is essentially zero.
Using the results provided in Table 2, observed ratios involving the fluxes for the three brightest Balmer lines; H/H, and H/H, are reported in Table 3 along with the canonical Case B values expected for an idealized nebula of uniform electron temperature, corresponding to 104 K, and a uniform electron density of 104 cm-3 (Hummer & Storey, 1987). Interestingly, the H/H ratio measured with STIS agrees with the average of the values reported previously in Boksenberg & Netzer (1977), and is almost a factor of two larger than the Case B value. Such deviations from recombination theory have been noted for other AGN (Devereux, 2013, and references therein) and can be explained in terms of collisional excitation, enhancing just H, relative to the other Balmer lines. However, the Balmer emission line ratios can also be affected by dust extinction which is addressed in the next section.
| Ratio | Observed | Extinction | Case BaaAssuming a uniform electron temperature of 104 K, and a uniform electron density of 104 cm-3. | Cloudy |
|---|---|---|---|---|
| Corrected | ||||
| (1) | (2) | (3) | (4) | (5) |
| H/H | 5.2 0.01 | 5.0 0.01 | 2.8 | 5.2 |
| H/H | 2.0 0.01 | 2.0 0.01 | 2.1 | 1.9 |
| 5007/H | 0.31 0.02 | 0.30 0.02 | … | 0.37bb solar metallicity. See Table 4. |
| 4959/H | 0.10 0.02 | 0.10 0.02 | … | 0.12bb solar metallicity. See Table 4. |
2.2. UV–X-ray Continuum, and Foreground Dust Extinction
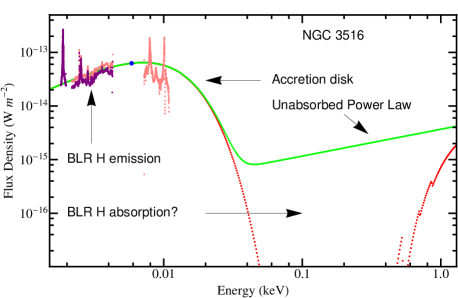
Vasudevan & Fabian (2009) modeled the UV–X-ray continuum of NGC 3516 in terms of a blackbody, representing an accretion disk, and a power law. The amplitude of that continuum model, recapitulated in Figure 4, is constrained by a single XMM-OM observation obtained at the end of the year 2001. However, the model continuum agrees with that measured in the G430L spectrum and the mean extinction corrected 1365 continuum discussed previously by Goad et al. (1999b). Consequently, the model continuum presented in Figure 4 provides a useful constraint on the production rate of H ionizing photons by the central UV–X-ray source. For a distance of 38 Mpc (R.B. Tully, private communication) numerically integrating the continuum yields 1.2 1053 H ionizing photons s-1, of which the majority, 75%, are produced by the accretion disk111 Characterized by the parameter = 0.00288 keV. See Vasudevan & Fabian (2009) for details. and the remainder by the power law. These results constrain a photoionization model for the BLR in NGC 3516 discussed further in Section 3.
As illustrated in Figure 4, the G430L continuum measured in 1998 coincides almost identically with the model accretion disk, but the contemporaneous G140L spectrum lies significantly below. Although one can not rule out time variability as the reason for the discrepancy, the likelihood that the observed continuum is representative of the mean provides an opportunity to estimate the dust extinction by comparison with the model continuum. If one assumes a Galactic form for the redenning law, Av/E(B-V) = 3.2 (Cardelli, Clayton & Mathis, 1989) then a least squares analysis on the difference between the model continuum and the continuum measured in the contemporaneous G430L and G140L spectra yields the following significant result,
| (1) |
which predicts a color excess E(B-V) = 0.05 0.01 consistent with the range of values for the Galactic extinction quoted by Goad et al. (1999b). Consequently, the foreground extinction towards NGC 3516 at the wavelength of the H emission line is likely to be small, 0.1 mag. Values for the ratios H/H, and H/H, are reported in Table 3 corrected for Galactic extinction using equation 1.
3. Photoionization Modeling of the BLR using Cloudy
Evidently, the reason that the LLAGN in NGC 3516 is so bright is because the foreground visible dust extinction is essentially zero. Furthermore, the dust extinction internal to the BLR may also be zero since the Balmer emission line profile shapes are so similar (see Figure 3). Thus, the AGN is essentially completely exposed allowing a very clear view of the BLR. This is perhaps not entirely unexpected as Koshida et al. (2014) measure the dust reverberation radius to be significantly larger than the Balmer reverberation radius (Denney et al., 2010). Collectively, the HST/STIS observations suggest a model for the BLR of NGC 3516, advocated previously by Netzer & Laor (1993), in which the central UV–X-ray source is able to sublimate dust from a sizeable volume of H gas, permitting it to be photoionized. The implications of such a model are explored in the following using version 13.02 of Cloudy (Ferland et al., 2013).
| Parameter |
|---|
| AGN T=8.1e4 K, =-1.4, =-0.5, =-0.5 |
| q(h)=53.09 |
| cosmic rays background |
| radius 16. |
| hden 7.4, power =-0.5 |
| sphere |
| abundances ISM no grains |
| Stop radius 17.35 |
| iterations 2 |
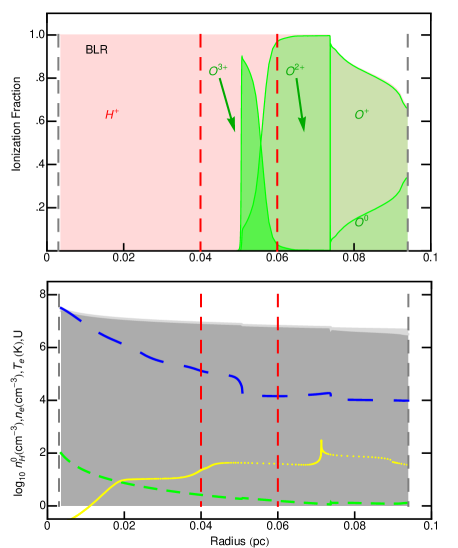
Table 4 summarizes the parameters employed to model photoionization of the BLR in NGC 3516 a full description of which can be found in the Cloudy documentation. Briefly, they describe a spherically symmetric distribution of neutral H gas that is photoionized by the central UV–X-ray source.
The radial number density distribution for the neutral gas is represented by an r-n, power law, normalized by a number density at the inner radius, . A grid of photoionization models spanning 0 n 1.5 and 7.0 log10(cm-3) 8.0 was constructed in order to discover the intersection of model predictions for the intrinsic H/H, H/H, and [O iii]4959,5007/H emission line ratios with the extinction corrected values. Subsequent optimization of the density versus outer radius yielded emission line ratios that are within 5% of the observed extinction corrected values reported in Table 3. As explained in more detail in the following sections, the modeling results point to low density and possibly low metallicity gas as the origin of the visible emission line spectrum observed for NGC 3516.
3.1. Radial Structure, and Physical Properties of the BLR in NGC 3516
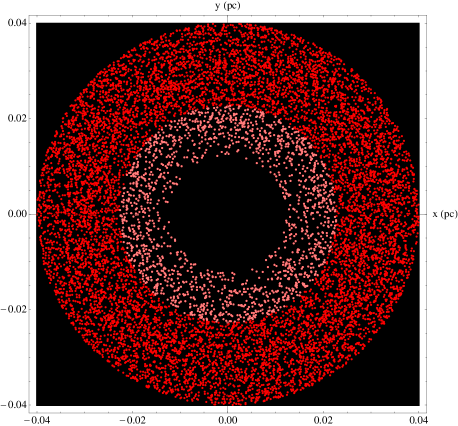
Of particular interest in understanding the physical conditions that may exist in the BLR is what the photoionization code Cloudy has to say about the radial distributions of the ionization fraction, the electron density, the electron temperature, the H emission line emissivity, and the ionization parameter. These results, depicted in Figure 5, represent the model parameters listed in Table 4. Some interesting trends are apparent. First, the upper panel in Figure 5 shows that the H ionization fraction is predicted to be 100% inside the dust reverberation radius measured by Koshida et al. (2014). Plus, a significant ionization gradient is predicted, in the sense that O2+ is inevitably ionized to O3+, as the central UV-X-ray source is approached. Consequently, the H and O emitting regions are spatially disparate, the H emission being produced in a dust-free shell, surrounded by a potentially dusty O emitting region. Second, the lower panel of Figure 5 shows that inside a radius of 0.1 pc, the electron density exceeds the critical density of 7 105 cm-3 for collisional de-excitation of the level of O2+. Third, the lower panel in Figure 5 shows a rapid increase in electron temperature inside the region where H is fully ionized. Cloudy predicts that the electron temperature exceeds 107 K at the Balmer reverberation radius. Such a rapid rise in temperature correlates with an equally rapid decline in the H emission line emissivity. This phenomenon leads to a central void, visualized in Figure 6, inside of which there is no Balmer line emission. The perimeter of this central void coincides with the Balmer reverberation radius. Thus, the Balmer reverberation radius appears to be just the inner radius of a larger volume of ionized gas that is producing Balmer line emission. The reverberating gas, identified with the inner ring of points in Figure 6, represents 15% of the total, based on the same percentage of the total Balmer emission line flux that is observed to be time variable, according to the Fvar statistic (Denney et al., 2009, 2010). Although labelled variously, that statistic is routinely used to quantify variability amplitude by providing a measure of the fractional excess variance in the emission line flux (e.g. Edelson et al., 2000).
NGC 3516 is the third LLAGN following NGC 3227 (Devereux, 2013) and NGC 4051 (Devereux & Heaton, 2013) for which the inner radius of the volume emitting the Balmer emission lines coincides with the Balmer reverberation lag. Various measures of BLR size in NGC 3516 are provided in the next section.
3.2. BLR Size Estimates
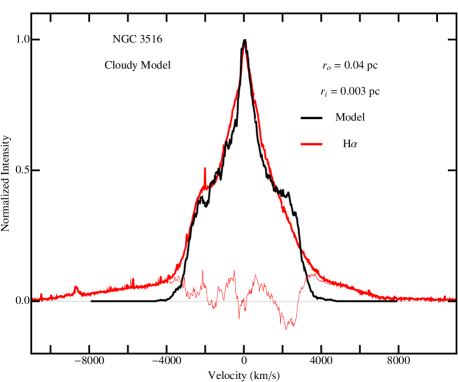
Knowing both the H emission line emissivity, and the central BH mass allows one to construct a model H emission line profile, an example of which is illustrated in Figure 7. The line profile fitting method for estimating the size of the region producing broad Balmer line emission has been described previously (Devereux, 2011). Briefly, the method employs a Monte Carlo simulation of a spherically symmetric distribution of 104 particles of light, the radial distribution of which is described by the H emission line emissivity predicted by Cloudy (see Figure 5).
Time resolved spectra discussed by Denney et al. (2009) indicate an infall component to the BLR in NGC 3516. However, since the time variable component of the H emission line represents only about 15% of the total line flux, it is difficult to judge whether this observation is representative of the kinematic state of BLR as a whole. Nevertheless, for the purposes of computing the model line profile, every particle is assumed to be moving under the influence of gravity, and in free–fall according to the familiar equation v(r) = , where v is velocity, G is the gravitational constant, M∙ is the BH mass, and r is the distance of each point from the central supermassive BH. Such spherically symmetric free-fall models produce single peak broad Balmer emission line profile shapes. Discrete particle models also have the advantage that they reproduce the small-scale structure seen in broad emission line profiles, which is caused by random clumping in radial velocity space, as noted previously by Capriotti, Foltz & Byard (1981).
The central mass determines the relationship between velocity and radius for each point of light and the emissivity determines the number of points at each radius. In the context of the inflow model there are two free parameters available to model the line shape and they are the inner and outer radius of the emitting volume. The inner radius defines the full velocity width at zero intensity of the model broad emission line, and the outer radius defines the maximum intensity of the model broad emission line at zero velocity. Thus, comparing a normalized version of the observed broad emission line with the model one effectively constrains the inner and outer radii of the emitting volume using chi-squared minimization. For a BH mass of 31.7 106 M☉ (Denney et al., 2010) one finds that the inner radius, ri, of the region emitting the Balmer emission lines is 4 l.d. which, within the uncertainties, is comparable to the Balmer reverberation lag, = 7 l.d., measured333For NGC 3516, there is a significant difference between , and , but there are more independent measurements that point to a time lag of 7 l.d. See Denney et al. (2010) for details. by Denney et al. (2010). Whereas the outer radius, ro, of the region emitting the Balmer emission lines is 47 l.d. which coincides with the smallest of the dust reverberation radii measured by Koshida et al. (2014).
The H emissivity predicted by Cloudy does a reasonably good job at reproducing the overall shape of the observed H emission line as illustrated in Figure 7, although there are some differences in detail. By design the model H emission line is symmetric about zero velocity, whereas the observed profile is obviously not. Additionally, the model does not explain the high velocity wings seen in the STIS spectra, suggesting a less precipitous decrease in the H emissivity at small radii than predicted by Cloudy. Nevertheless, the success of the Cloudy model is that the H emitting region, defined above, can explain both the H emission line profile shape (see Figure 7) and the Balmer emission line ratios (see Table 3) but it underestimates the extinction corrected H luminosity by 60%. Since the Balmer emission line emissivity is spatially extended (see Figure 5) the model emission line luminosity can be increased to the observed value by increasing the outer radius to a luminosity radius of 112 l.d., although that change causes the model Balmer emission line profile shape to deviate more from the observed one, and the model Balmer emission line ratios to no longer agree with the extinction corrected values listed in Table 4. In summary, there are several measures of BLR size and they include the Balmer reverberation radius, the dust reverberation radius, the inner and outer radius of the volume required to explain the shape and relative intensities of the Balmer emission lines, and lastly, the Balmer luminosity radius. These various size estimates are illustrated in Figure 5.
4. Discussion
Collectively the STIS observations constrain a Cloudy model for the BLR in NGC 3516 that consists of 500 M☉ of dust-free H gas that is free-falling towards the central BH at a steady-state rate of 1 M☉/yr. Even assuming radiatively inefficient accretion (e.g. Merloni, Heinz, & Di Matteo, 2003), the bolometric luminosity measured for this LLAGN (Vasudevan & Fabian, 2009) indicates that no more than 2% of the inflowing material reaches the event horizon of the BH (Barbosa et al., 2009) raising the question where does the majority of the inflowing mass go? Evidently, the inflow is diverted into an outflow. The mass outflow rate estimated for NGC 3516 by Barbosa et al. (2009) accounts for only about 5% of the inflowing mass quoted above. However, this discrepancy could be easily reconciled if the gas density in the outflow were about a factor of 20 higher than Barbosa et al. (2009) assumed. Then mass would be conserved since the outflow rate would be similar to the inflow rate. A mechanism that would allow such an efficient redirection of matter most likely involves a magnetohydrodynamic process since thermal energy and BH spin appear to be insufficient (e.g. Aktar, Das & Nandi, 2015). A few other puzzles concerning NGC 3516 are discussed in the following.
4.1. X-ray Warm Absorber, Ionization Parameter, and H Column Density
Cloudy predicts that inside the Balmer reverberation radius the H gas is an 107 K plasma producing no H lines at all because the primary source of opacity is electron scattering. This inner sanctum is where the X-ray emission originates. Thus, according to this model, the X-ray, and Balmer emission are mutually exclusive, which would naturally explain the discordance between the time variability of these two types of radiation (Edelson et al., 2000). Furthermore, according to this picture, the X-rays would have to pass through the ionized H to reach the observer which could explain the X-ray absorption features at 1 keV described by Netzer et al. (2002). In fact, the properties of the warm absorber constrained by Netzer et al. (2002); a thin shell with an electron density 2.4 106 cm-3, an electron temperature 3.5 104 K, and a radius 0.2 pc, almost perfectly describe the physical properties of the BLR gas illustrated in Figure 5. The obvious implication being that the BLR the X-ray warm absorber. Subsequently, Huerta et al. (2014, and references therein) have identified several warm absorbers covering a range of ionization parameter, U(r), similar to the range predicted by Cloudy, as illustrated in Figure 5. However, Huerta et al. (2014) advocate U(r) increasing with radius which is completely opposite to the dependence predicted by Cloudy (See Figure 5). Furthermore, integrating the neutral H column of the Cloudy model over the entire range of radii depicted in Figure 5 leads to a H column density 2 1024 atoms/cm-2, which is an order of magnitude larger than estimated for any of the warm absorbers described by Huerta et al. (2014, and references therein). Consequently, it is difficult to associate any of the absorbers identified by Huerta et al. (2014) with the BLR gas.
4.2. Forbidden Emission Lines
What is visually striking about the spectra obtained with STIS of NGC 3516 is how faint the forbidden emission lines are compared to the H Balmer emission lines. For example, the observed [O iii]/H, [O i]/H, [N ii]/H and [S ii]/H emission line ratios are so small that they render NGC 3516 unclassifiable according to the diagnostic diagrams of Kewley et al. (2006). However, when one compares the observed emission line ratios to the intrinsic ones predicted by the photoionization code Cloudy, none of the forbidden lines cited above are expected to be very bright except [O iii]. Cloudy predicts the forbidden [O iii] emission lines to be about one order of magnitude brighter than observed, even though the model electron density exceeds the critical density for collisional de-excitation of the level of O2+ as mentioned previously in Section 3.2. Thus, if the Cloudy calculation is to be believed, then something is diminishing the brightness of the [O iii] emission lines seen in NGC 3516.
Looking at Figure 5, one possibility is dust obscuration. According to the results presented in the upper panel of Figure 5, dust could selectively obscure emission lines produced by any of the first four ionization stages of O. Furthermore, although not shown in the figure, the ionization gradient for O is similar to that of other ions including C, N, and S, because all these elements have similar ionization potentials. Thus, forbidden lines from those elements may also be obscured. Given that the dust extinction is virtually negligible to the H located inside the dust reverberation radius, any dust would have to be distributed in a face-on ring, or annulus, in order to selectively affect just the forbidden lines. Such a geometry envisaged for the dust is reminiscent of a torus which is the basis for a unified model of AGN (Netzer, 2015, and references therein).
Ideally, one would like to use Cloudy to model the impact of dust on the forbidden line emission. Unfortunately, Cloudy has a serious limitation in that it has not reliably predicted emergent emission line intensities for all versions of the code including, and predating v13.02. Although not widely publicized, an admission to this effect is documented on the Cloudy simulations wiki hosted by Yahoo Groups555 in a series of e-mail exchanges666For example, message numbers; 2504, 2501, 2485, 2481 at the end of the year 2014.
According to the Cloudy documentation, the emergent line intensities include the radiative transfer effects involving dust beyond the region where the various emission lines are formed. Thus, the bug is related to the inclusion of dust in the Cloudy models. Regretably dust is included in all models by default unless the user specifies no grains to disable it. A recent comparison of photoionization codes (Péquignot et al., 2001) did not address the inclusion of dust which is perhaps why this problem has gone unnoticed for so long.
The other half of the standard output generated by Cloudy titled Intrinsic line intensities is apparently unaffected by the bug, and it is those results that are used in this paper. However, according to the Cloudy documentation, the intrinsic line intensities do not include the radiative transfer effects involving dust beyond the region where the various emission lines are formed. Consequently the intrinsic line intensities are inappropriate for interpreting observed emission line spectra, unless the dust extinction to each region emitting each emission line is known a priori, and corrected for. Of special concern in this regard are several oft cited, and consequently influential papers dealing with spectroscopy of AGN that do not employ a dust extinction correction beyond the Galactic value. Collectively, several hundred papers utilizing Cloudy have been published in the professional literature. However, since it is not customary among the authors of those papers to declare which output they have been using, be it intrinsic or, emergent, or whether or not the no grains command was implemented, the reliability of any of the results presented is difficult to judge. This all underscores the pitfall associated with a discipline that relies almost entirely on a single photoionization code, in this case Cloudy. Having said all this, Cloudy intrinsic line intensities be useful for interpreting the visible Balmer emission line spectrum of NGC 3516, because for this particular AGN, it has been demonstrated in Sections 2.1 and 2.2, that the visible dust extinction is virtually negligible to the H in the BLR.
4.3. Low Metallicity
If dust is not responsible for the weak forbidden [O iii] emission lines observed for NGC 3516, then the only alternative is low metallicity. A metallicity that is a factor of 10 lower than the ISM value causes Cloudy to reproduce the observed [O iii]/H ratio shown in Table 3. Metal poor gas suggests an origin in the circumgalactic medium. Perhaps the inflow, that we perceive as the BLR in NGC 3516, is just the terminus of a much larger inflow that originates from outside the galaxy. Such inflows of metal poor gas appear to be commonplace, observed in our own Galaxy and others (Lehner et al., 2013), but this is perhaps the first suggestion of an association between the BLR of an AGN, and a low metallicity accretion flow from the circumgalactic medium. Such inflows could also explain the low duty cycle observed for AGN activity in the local universe.
4.4. A UV–Visible Dichotomy?
The main feature of the model presented here to explain the visible emission line spectrum of NGC 3516 is photoionization of low density gas 108 cm-3 which leads to a spatially extended nebula surrounding the central UV–X-ray source. In contrast, Goad et al. (1999b) use Cloudy to explain the UV spectrum of NGC 3516, in terms of photoionization of an ensemble444the LOC model (Baldwin et al., 1995) of optically thick broad line clouds with high density, 109 cm-3 ne 1011 cm-3. These two models are mutually exclusive. The differences could be reconciled if there are two photoionization mechanisms at work, one in the visible, and one in the UV. In effect, a UV–visible dichotomy whereby the UV emission lines are produced by the accretion disk, and the visible emission lines from the photoionized nebula surrounding it. As noted previously in Section 2.1 the largest variance in the visible Balmer emission line flux occurs in the line wings. However, the converse is true for the Ly emission line where the largest variance occurs in the line core (Goad et al., 1999b). This distinction, if confirmed, would establish a basis for further investigation.
Cloudy predicts the photoionized nebula will produce Ly, and C iv 1542 emission lines, in addition to the visible lines already mentioned (see Section 3.1). However, according to this model the nebular C iv 1542 emission would occur in the vicinity of the dust reverberation radius, is quite likely attenuated by dust extinction, and is sufficiently distant from the central BH that it is expected to contribute only to the narrow component of C iv 1542 discussed by Goad et al. (1999b). However, the nebula is expected to contribute significantly to the observed broad Ly emission, although it is difficult to explore further to what extent the nebula lines contribute in the UV given the shortcomings with Cloudy explained previously in Section 4.2.
5. Conclusions
A model has been presented which explains the relative intensities of the H, H, and H, emission lines in terms of a spatially extended, spherically symmetric distribution of neutral H gas that is photoionized by the central UV–X-ray source. Photoionization modeling with Cloudy indicates that the H/H emission line ratio is a proxy for gas density, and constrains the neutral H density, , to be log10(cm-3) = 7.4 at the Balmer reverberation radius. Collectively, the observations support a model, suggested previously by Netzer & Laor (1993), in which the central UV–X-ray source is able to sublimate dust from a sizeable volume of H gas, permitting it to be photoionized. Modeling with the photoionization code Cloudy yields the following insights. First, the Balmer emission line emissivity is essentially zero inside the Balmer reverberation radius. Thus, the Balmer reverberation radius marks the perimeter of a central cavity inside of which there is no Balmer emission providing a natural explanation for the finite width observed for the Balmer emission lines. Second, the H gas is totally ionized between the Balmer reverberation radius and the dust reverberation radius. That same H gas is associated with an H emissivity that reproduces the overall shape of the observed H emission line expected for gas in free-fall. The Cloudy model further predicts forbidden [O iii] emission lines that are one order of magnitude brighter than observed. The discrepancy may indicate that the observed [O iii] emission lines are attenuated by dust, or that the photoionized gas is of low metallicity, or both. A problem with the emergent line intensities computed by the Cloudy photoionization code precludes further investigation of this particular observation.
Acknowledgments
The author is grateful to Dr. Ranjan Vasudevan for providing the ionizing continuum illustrated in Figure 4, and to Dr. Hagai Netzer for helpful comments on an earlier draft of this manuscript. Special thanks also to Drs. Steven Willner, Jon Haass, Giorgio Lanzuisi and an anonymous referee for important contributions that greatly influenced the outcome of this paper.
References
- Aktar, Das & Nandi (2015) Aktar, R., Das, S., & Nandi, A., 2015, MNRAS, 453, 3414
- Baldwin et al. (1995) Baldwin J., Ferland G., Korista K., Verner D., 1995, ApJ, 455, 119
- Balmaverde & Capetti (2014) Balmaverde, B., & Capetti, A., 2014, A&A, 563, 119
- Barbosa et al. (2009) Barbosa, F. K. B., Storchi-Bergmann, T., Cid Fernandes, R., et al. 2009, MNRAS, 396, 2
- Boksenberg & Netzer (1977) Boksenberg, A., & Netzer, H. 1977, ApJ, 212, 37
- Cardelli, Clayton & Mathis (1989) Cardelli, J. A., Clayton, G. C., Mathis, J. S., 1989, ApJ, 345, 245
- Capriotti, Foltz & Byard (1981) Capriotti, E., Foltz, C., & Byard, P., 1980, ApJ, 245, 396
- Denney et al. (2009) Denney, K. D., Peterson, B. M., Pogge, R. W., et al. 2009, ApJ, 704, 80
- Denney et al. (2010) Denney, K. D., Peterson, B. M., Pogge, R. W., et al. 2010, ApJ, 721, 715
- Devereux (2013) Devereux, N., 2013, ApJ, 764, 79
- Devereux (2011) Devereux, N., 2011, ApJ, 727, 93
- Devereux & Heaton (2013) Devereux, N., & Heaton, E., 2013, ApJ, 773, 97
- Edelson et al. (2000) Edelson, R., Koratkar, A., Nandra, K., et al. 2000, ApJ, 534, 180
- Ferland et al. (2013) Ferland, G. J., Porter, R. L.,van Hoof, P. A. M., et al. 2013, RMxAA, 49, 137
- Ferruit, Wilson & Mulchaey (1998) Ferruit, P., Wilson, A. S., Mulchaey, J. S. 1998, ApJ, 509, 646
- Goad et al. (1999a) Goad, M. R., Koratkar, A. P., Axon, D. J., et al. 1999, ApJ, 512 95
- Goad et al. (1999b) Goad, M. R., Koratkar, A. P., Kim-Quijano, J., et al. 1999, ApJ, 524, 707
- Hummer & Storey (1987) Hummer, D. G., & Storey, P. J. 1987, MNRAS, 224, 801
- Ho (2008) Ho, L. C., 2008, ARA&A, 46, 475
- Huerta et al. (2014) Huerta, E. M., Krongold, Y., Nicastro, F., et al. 2014, ApJ, 793, 61
- Kewley et al. (2006) Kewley, L.J., Groves, B., Kauffmann, G., & Heckman, T., 2006, MNRAS, 372, 961
- Koshida et al. (2014) Koshida, S., Minezaki, T., Yoshii, Y., et al. 2014 ApJ, 788, 159
- Lehner et al. (2013) Lehner, N., Howk, J. C., Tripp, T. M., et al. 2013, ApJ, 770, 138
- Merloni, Heinz, & Di Matteo (2003) Merloni, A., Heinz, S., & Di Matteo, T., 2003, MNRAS, 345, 1057
- Netzer (2015) Netzer, H., 2015 ARA&A, 53, 365
- Netzer & Laor (1993) Netzer, H., & Laor, A., 1993 ApJ, 404, L51
- Netzer et al. (2002) Netzer, H., Chelouche, D., George, I. M., et al. 2002, ApJ, 571, 256
- Péquignot et al. (2001) Péquignot, D., Ferland, G., Netzer, H., et al. 2001, ASPC 247, 533
- Popović et al. (2002) Popović , L. Č., Mediavilla, E. G., Kubičela, A., & Jovanović , P. 2002, A&A, 390, 473
- Seyfert (1943) Seyfert. C.K., 1943, ApJ, 97, 28
- Vasudevan & Fabian (2009) Vasudevan, R.V., & Fabian, A.C., 2009, MNRAS, 392, 1124
- Wanders et al. (1993) Wanders, I., van Groningen, E., Alloin, D., et al. 1993, å, 269, 39
Facilities: HST (STIS)